Luis Alberto Carrillo Huaman![]() | Victor Alonso Zevallos Lingan
| Victor Alonso Zevallos Lingan![]() | Yvan Huaricallo*
| Yvan Huaricallo*![]()
© 2025 The authors. This article is published by IIETA and is licensed under the CC BY 4.0 license (http://creativecommons.org/licenses/by/4.0/).
OPEN ACCESS
This study evaluates the variability in the results of compressive strength tests of concrete, which were carried out in four laboratories in the city of Trujillo, Peru, following the guidelines of the ASTM C-39 standard. While all laboratories applied similar technical procedures, variations in curing conditions, test ages, and equipment calibration traceability were identified, affecting the reproducibility of the results. The samples were tested at different ages (3, 7 and 28 days in TEM; only 28 days in the other laboratories), which partially limits comparability. The coefficients of variation (CVs) ranged from 2.1% to 5.8%, and in some cases, approached or exceeded the typical accuracy limits recommended by ASTM C-39 for multi-laboratory evaluations. The study highlights the need for greater standardization of procedures and improved metrological traceability to ensure consistent and reliable results.
compressive strength of concrete, 28-day tests, standard deviation, ASTM C-39 standard, laboratory quality control, standardization of procedures, interlaboratory variability, technical accreditation of laboratories
1.1 Background
In the context of construction in Peru, the compressive strength of concrete represents a critical parameter for the acceptance of structures, and its accurate measurement is essential to guarantee the quality of the works. However, one of the most recurrent problems at the national level is the deficient quality control of concrete [1, 2]. This situation has led, in several documented cases, to housing instability, structural collapses during the operational stage, and a growing perception of insecurity on the part of the population, especially in areas prone to natural disasters.
In the city of Trujillo, there is a duality in the quality control processes and in the training of technical personnel. While some laboratories comply with regulatory guidelines and have adequate equipment, others operate without appropriate technology or trained professionals, which puts the quality of civil works in the region at risk. This reality shows a lack of standardization and technical supervision in concrete tests, which compromises the reliability of the results, especially in relation to compressive strength.
Although previous research has been carried out on alternative concrete and testing techniques, such as the study where a conventional concrete was compared with another that incorporated crushed glass as a coarse aggregate—using a quantitative approach and a pre-experimental design with 40 specimens—the results showed that, although the alternative concrete exhibited strength, it was not suitable for structural elements [3]. However, this type of research does not address the variability between laboratories or the practical implications of such dispersion in real construction contexts.
Therefore, the present study focuses on a comparative analysis of the compressive strength results obtained by four laboratories in Trujillo, using the ASTM C-39 standard as a reference. Through the calculation of coefficients of variation (CV) and the comparison with the levels of reproducible accuracy established by said standard, it is sought to identify technical gaps and propose a baseline to improve quality control in concrete tests in the regional context.
1.2 Problems and gaps in the subject
The main problem addressed in this study is the lack of standardization and the lack of technical supervision in the quality control processes of concrete in Trujillo, which directly affects the safety and stability of the constructions. Although research has been carried out on the subject, inconsistencies persist in the application of regulations and in the technical training of laboratory personnel. This has generated a gap in the effective implementation of quality controls and in the technical validation of compression tests applied on site.
Unlike previous multi-laboratory research, this study focuses on a previously undocumented regional context: the city of Trujillo, Peru, where multiple laboratories coexist without formal accreditation or uniform procedures. Through the statistical analysis of the compressive strength of concrete cylinders, it is sought to evidence the variability of results in real conditions of technical practice, beyond certified environments. Thus, this work not only provides regional data, but also proposes a baseline for future strategies for standardization, technical supervision and accreditation of laboratories at the national level.
This study represents an original contribution by addressing the variability of results in compressive strength tests in real regional contexts, where there is no formal system of standardization or accreditation of laboratories. Unlike previous interlaboratory studies conducted under controlled or academic conditions, this research evaluates reproducibility under local operating conditions, including non-certified laboratories and without external auditing. This approach allows to evidence concrete technical gaps in the quality infrastructure of the construction sector in Peru, providing a quantitative baseline for future improvement strategies. Likewise, the study presents a methodological model that can be replicated for other regions of the country that face similar challenges, thus contributing to the strengthening of the national quality control system in construction materials.
1.3 Objective of the research
The main objective of this research is to determine the coefficient of variation and multi-laboratory dispersion according to ASTM C-39 for cylindrical concrete cores in Trujillo, 2024. The specific objectives are to determine the physical characteristics of the aggregates to be used for the production of the concrete, prepare the mix designs for the concretes considering design f'c of 175 kg/cm² and 320 kg/cm² according to the ACI 211.1 methodology, determine the compressive strength, at different ages, of the concretes made, determine the coefficient of variation of the concretes made according to ASTM C-39, determine the multi-laboratory dispersion of concretes made according to ASTM C-39.
1.4 Contribution of research and closing gaps
A total of 60 cylindrical specimens (15 cm × 30 cm) were used, molded under the parameters of the ASTM C-39 standard. Two design mixtures were used in accordance with ACI 211.1R: one of 175 kg/cm² and the other of 320 kg/cm², whose dosage was replicated in each laboratory. The original mixture was designed in the TEM laboratory, and the other laboratories replicated the same materials and proportions. Each laboratory produced its specimens, cured them under standard conditions (controlled temperature of 23 ± 2℃) and tested them after 28 days. Only in the TEM laboratory were 3- and 7-day tests also performed. All equipment was verified and calibrated prior to testing, and there are certificates supporting its compliance with current ASTM and NTP standards.
1.5 Background
In the research [3-7], the influence of the slenderness ratio on the compressive strength of concrete was analyzed by the elaboration of 180 specimens of f'c = 280 kg/cm², tested at 7 and 28 days. It was observed that reducing slenderness from 2 to 1 increased compressive strength, contributing to the understanding of the effect of slenderness on the variability of concrete strength.
Based on the analysis presented by references [8-12], two test methods, destructive and non-destructive, were evaluated to measure the bounce rate of a concrete with a strength of 210 kg/cm². The results showed that both methods could be used to determine the bounce rate in concrete at different ages, considering ambient temperature and workability. This research provides a key insight into the measurement of compressive strength using non-destructive methods, complementing our research on compressive strength variability in 4 laboratories in Trujillo.
In the investigations [13-16], the properties and mechanical behavior of the aggregates from two quarries were evaluated, applying the ASTM C-33 and NTP 400.037 standards. It was found that the aggregates from the Mantaro River basin resulted in a concrete with higher compressive strength compared to those from the Ichu stream basin. This research is useful for our study, since, as in this case, the ASTM C-39 and NTP 339.034 standards are compared, focusing on determining the coefficient of variation and dispersion in 4 laboratories in Trujillo.
In the research [17], the effect of the addition of polypropylene fibers in concrete with a strength f'c = 210 kg/cm² was analyzed, using aggregates from different quarries. Differences in strength were found, with the percentage of polypropylene fiber being a determining factor. This research is relevant to our study, as it allows us to compare the strength results obtained under different mixing conditions, while our research will focus on the variability of compressive strength in different laboratories in Trujillo.
In the research [18-22], an experimental analysis was performed to compare the compressive strength of simple concrete versus concrete reinforced with polypropylene fiber at different ages (7, 14, 21, and 28 days). The results showed that fiber-reinforced concrete improved strength by 5%, making it more suitable for seismic zones. This research is useful for our study, which also addresses the compressive strength of concrete, but focuses on the variability of strength in 4 laboratories in Trujillo with concretes of 175 kg/cm² and 320 kg/cm² at different ages.
According to the studies [23, 24], the use of carbon nanotubes (CNTs) to improve the impermeability of concrete exposed to sulfates and chlorides in marine structures was investigated. The results showed that carbon nanotubes improve the strength of concrete, reducing cracking by interacting with sulfates and chlorides. This research provides the idea of improving the impermeability of concrete against aggressive environments. In our study, concretes of 175 kg/cm² and 320 kg/cm² with curing times of 3, 7 and 28 days will be analyzed, with the aim of determining the coefficient of variation and dispersion in the 4 selected laboratories in Trujillo.
In the research [25-29], the impact of nopal mucilage on the strength of concrete was evaluated, especially in sulfated soils. The results showed that the addition of nopal mucilage to the modified cement mixture improved some mechanical properties of the concrete. This study provides a perspective on the use of natural admixtures in concrete to improve its performance in aggressive environments. In our research, we will work with concretes of 175 kg/cm² and 320 kg/cm², and the coefficient of variation and dispersion between different laboratories in Trujillo will be compared.
As reported by studies [30-33], the use of eucalyptus bark as a reinforcement in concrete was studied, evaluating its flexural strength. The results showed that the addition of eucalyptus bark improves the bending strength of concrete by 3.61% compared to beams without bark. This study provides insight into the influence of alternative materials on the mechanical properties of concrete. In our study, we will focus on determining the coefficient of variation and dispersion of concretes of 175 kg/cm² and 320 kg/cm² through tests in 4 laboratories in Trujillo.
In the research [12], the effect of the use of Mexican fly ash and sugarcane ash as pozzolans in ternary concretes was evaluated, developing different mixing designs with partial cement replacements in proportions of 15% and 30%. The results showed that cane ash did not significantly affect the compressive strength, but it did improve the electrical resistivity of the concrete. This research provides an idea that supports the effect of the use of sugarcane ash in proportions of 15%, 30%, 45%, 60%, 75%, 90% and 100%. On the other hand, in our study, a concrete mixture was designed to determine how much aggregate is going to be carried in the molds made, and thus be able to determine the coefficient of variation and multi-laboratory dispersion according to the ASTM C-39 standard for cylindrical cores, Trujillo 2024.
Based on the analysis presented by studies [34, 35], the use of the Sikament-306 admixture was evaluated in 80 concrete specimens with different percentages of admixtures (1%, 1.5%, and 2%), measuring their compressive strength at 3, 7, 14, and 28 days. The results showed that the additive improved the compressive strength of concrete. This research underscores the positive effect of admixtures in improving the strength of concrete. In our research, mixtures with different additives will be applied and the dispersion of the results in various laboratories will be analyzed according to the ASTM C-39 standard.
In the research [36], the impact of the use of microsilica in concretes with different water/cement ratios was studied, showing significant improvements in compressive strength, especially in mixtures with a lower water/cement ratio. The research highlights that the water/cement ratio is a determining factor in the durability and strength of concrete. In our study, an investigation will be carried out in 4 laboratories to verify if the results comply with the ASTM C-39 standard; for this, 60 specimens have been developed with a curing period of 3, 7 and 28 days, with the aim of determining the coefficient of variation and multi-laboratory dispersion according to ASTM C-39 for cylindrical cores, Trujillo 2024.
In the research [37], the incorporation of puliton in particular was evaluated in the percentages of 4%, 8%, and 12%, observing the effects on compressive strength. The results indicated an increase in compressive strength, although it was warned that durability could be compromised by greater porosity. This work proposes the use of puliton as an alternative material in the manufacture of concrete. In our research, the properties of concrete will be analyzed in 4 laboratories to evaluate compliance with the ASTM C-39 standard, elaborating 60 specimens at 3, 7 and 28 days to determine the coefficient of variation and multi-laboratory dispersion, specifically for cylindrical cores, in the city of Trujillo, 2024.
In the research [38], 40 specimens were made, of which 20 were standard concrete and 20 included crushed glass as a replacement for coarse aggregate. They were evaluated at 7, 14, 21 and 28 days, determining that the standard concrete reached 210 kg/cm², a value that would not be suitable for structural elements. This research provides the idea of a sample composed of 40 specimens, differentiating between specific pattern and alternative. In our study, an investigation will be carried out in four laboratories in Trujillo with 60 specimens, evaluated at 3, 7 and 28 days, to determine the coefficient of variation and multi-laboratory dispersion according to ASTM C-39.
It should be noted that, although several precedents cited include research with additives or alternative materials such as coconut fiber, glass, prickly pear, among others, their inclusion in this study is not due to the type of concrete used, but to the methodological approach they share. These works apply comparable statistical analyses, particularly in the evaluation of the coefficient of variation and the dispersion of results, central elements also in our research. Therefore, their contribution is considered relevant, since they strengthen the methodological framework in terms of data processing, regardless of the specific nature of the material evaluated.
Unlike previous interlaboratory studies carried out in international contexts, this research focuses on a local reality with technical, logistical and regulatory limitations typical of the Peruvian environment. The novelty of this study lies in establishing a quantitative baseline of the performance of concrete testing laboratories in Trujillo, under real operating conditions, without controlled protocols. Likewise, the coefficients of variation obtained are compared with the reproducible accuracy values established by ASTM C-39, which has not been addressed in previous studies in the national context. This approach allows not only to highlight the existing technical gaps between laboratories, but also to propose an objective evaluation tool to strengthen quality assurance systems in concrete compression tests.
2.1 Type of research
Its purpose is applied research, for this reason, the information known about the variables is based on the studies analyzed in different laboratories, and these can be compared with the results obtained in each test.
The design is experimental, since we will analyze the effects of the independent variable, cylindrical concrete cores according to the mix design of 175 kg/cm2 and 320 kg/cm2, on the dependent variables with respect to the coefficient of variation and multi-laboratory dispersion.
The research design is quasi-experimental, because it is elaborated in 4 laboratories in the city of Trujillo with 30 specimens of f'c = 175 kg/cm2 and 30 specimens of f'c = 320 kg/cm2, according to the mixture design with the ACI 211.1 standard, also a compressive strength will be developed for these specimens and thus determine the coefficient of variation and multi-laboratory dispersion according to the ASTM C-39 standard.
Table 1 shows the design of mixing 30 specimens of 175 kg/cm2 and 320 kg/cm2 to have the results at compressive strength.
Table 1. Research design
|
Laboratory |
Procedure |
Results |
|
|
Tem |
|
30 specimens of 175 kg/cm2, cured for 3, 7, 28 days |
compressive strength |
|
Geconsac |
concrete mix |
||
|
Dino |
30 specimens of 320 kg/cm2, cured for 3, 7, 28 days |
resistance to compression |
|
|
Qce |
|
||
2.2 Research design
2.2.1 Independent variable
This article should be considered with a mixture design of 30 specimens of 175 kg/cm2 and 30 specimens of 320 kg/cm2 for cylindrical concrete cores, taking care of the continuous setting during the 3, 7 and 28 days, the deposit should not exceed 23℃. It is determined to apply load to concrete specimens of 4" × 8" inches (100 × 200 mm). According to the reference [39], "Hardened concrete cores." To evaluate the strength of concrete in a structure, especially when the strength of standardized, modeled cylinders at the site is low, it is recommended to remove specimens (also called cores) from the hardened concrete. Eventually, this procedure can be used in different cases, for example. When anomalies have occurred in the development of the construction, curing failures, early application of loads, fire, old structures, or there are no resistance records, etc.
2.2.2 Dependent variable
The coefficient of variation according to the reference [28], "Coefficient of variation". It is used to compare datasets belonging to different populations. If we look at its formula, we see that it takes into account the value of the mean. Therefore, the coefficient of variation allows us to have a measure of dispersion that eliminates possible distortions of the means of two or more populations:
$C V=\frac{S_X}{Y}$ (1)
X: Variable on which the variance is intended to be calculated. SX: Standard deviation of the variable X. Y: It is the mean of the variable X in the absolute value with x̅ ≠ 0.
To calculate the coefficient of variation, the following tests must be calculated.
Multi-laboratory dispersion refers to the variability in the results of measurements or analyses performed by different laboratories. This type of dispersion is important in the context of multi-laboratory comparison tests, where it is sought to ensure the consistency and reliability of the results obtained by different entities according to the ASTM C-39 standards.
Table 2 shows the classification of variables: independent (cylindrical concrete core) and dependent (coefficient of variation, dispersion and multi-laboratory).
Table 2. Classification of variables
|
Variables |
Relation |
Nature |
Classification Measuring Scale |
Dimension |
Form Measurement |
|
Concrete cylindrical core |
independent |
continuous quantitative |
reason |
dimensionless |
direct |
|
Coefficient of variation |
dependent |
quantitative continuous |
reason |
multidimensional |
innuendo |
|
Dispersion multi-laboratory |
dependent |
quantitative continuous |
reason |
multidimensional |
innuendo |
2.3 Technique and instruments
2.3.1 Data collection technique
To carry out this research, it is necessary to collect information (field note). The analysis is an interactive method that collects information and is very fundamental in this project since it needs specific data to determine the coefficient of variation and dispersion of the most important data collection instruments: The instruments used in this project are the tests in the laboratories, in which different results are recorded where data on the strength of a conventional and reinforced concrete will be observed and analyzed. Through the notes that are collected in the laboratory during the course of the study.
2.3.2 Validation of the data collection instrument
The instruments used in this project are the tests in the laboratories, in which different results are recorded where data on the strength of a conventional and reinforced concrete will be observed and analyzed, through the notes that are collected in the laboratory during the course of the study.
2.3.3 Data analysis
The values obtained from the 60 tests that have been carried out in the 4 laboratories, of two specific laboratories of 175 kg/cm2 and 320 kg/cm2 to facilitate their compression, statistical graphs were prepared for the determination of the coefficient of variation and dispersion.
2.3.4 Data analysis instruments
The analysis of data obtained by the compression tests of 30 specimens of 175 kg/cm2 and 30 specimens of 320 kg/cm2, will be analyzed with the Excel program, which will allow us to analyze the data obtained and verify the hypothesis raised.
2.3.5 Ethical aspects
In this research project it is a scientific study and an ethical aspect is considered in the various phases of its development of each test carried out in 4 laboratories; since ethics is a central element to scientific integration, which guarantees the autonomy and veracity of the results, we also have the certificates that have been granted to us by the TEM laboratories, GECONSAC, DINO and QCE.
2.4 Population and sample
2.4.1 Population
The population is made up of the multi-laboratory coefficient of variation and dispersion according to ASTM C-39 for cylindrical concrete cores made in the city of Trujillo during the year 2024.
2.4.2 Sample
Our research will focus on 4 laboratories for our population, taking into account that there are two types of concrete of 175 kg/cm2 and 320 kg/cm2, where 30 concrete specimens will be needed that will be subjected to a curing of tests of 3, 7 and 28 days. First, 60 tests were carried out in the company TEM (Technology in Materials Testing) according to the ACI 211.1 standard, as well as their respective additions were made through the NTP 339.185 standard; and then we continued with the compressive strength tests of 24 specimens. Secondly, in the Geconsac Laboratory (Geotecnia & Construccion Servicios Generales S.A.C) the 12 specimens compressive strength test was developed. Thirdly, in the laboratory of Dino (Distribuidora Norte Pacasmayo SRL) the compressive strength test of 12 specimens was developed. Finally, in the laboratory of QCE (Quality Control Express S.A.C) the compressive strength test of 12 specimens was developed.
The research will be carried out using a convenience-directed non-probability sampling technique.
2.4.3 Sample size
The expert by non-probabilistic convenience directed sampling. He recommended developing a consistency matrix to determine the dependent and independent variables; In addition, we develop the tests in the TEM laboratory (Technology in Materials Testing) 60 cylindrical specimens must be manufactured for each mixture, which will be evaluated at 3, 7 and 28 days after curing. According to Peruvian Technical Standard 339.034, the minimum number of replicates for the evaluation of the compressive strength test of concrete in cylindrical specimens of 100 mm × 200 mm is 3 replicates.
Table 3 shows the mix design of 175 kg/cm2 and 320 kg/cm2 in the TEM (Technology in Materials Testing) laboratory where the consistency test of 30 specimens was performed for each design, having 60 specimens.
Table 3. Sample size for the workability variable
|
Laboratory |
Concrete Design |
Practice |
No. of Tests |
|
|
175 kg/cm2 |
|
30 |
|
TEM |
|
consistency |
|
|
|
320 kg/cm2 |
|
30 |
|
|
total tests |
|
60 |
Table 4 shows the design of a mixture of 175 kg/cm2 in the TEM, GECONSAC, DINO, QCE laboratories, with their respective curing age of 3.7 and 28 days, in order to proceed to their compressive strength of the 30 specimens mentioned in Table 4.
Table 4. Sample size for variable at compression 175 kg/cm2
|
Laboratory |
Concrete Design |
Curing Age (Days) |
Trials |
No. of Specimens |
|
TEM |
175 kg/cm2 |
3 |
compressive strength |
3 |
|
7 |
3 |
|||
|
28 |
6 |
|||
|
GECONSAC |
175 kg/cm2 |
28 |
compressive strength |
6 |
|
DINO |
175 kg/cm2 |
28 |
compressive strength |
6 |
|
QCE |
175 kg/cm2 |
28 |
compressive strength |
6 |
|
Total tests |
30 |
|||
Table 5 shows the design of a mixture of 320 kg/cm2 in the TEM, GECONSAC, DINO, QCE laboratories; with their respective curing age of 3, 7 and 28 days, in order to proceed to their compressive strength of the 30 specimens.
Table 5. Sample size for variable at compression 320 kg/cm2
|
Laboratory |
Concrete Design |
Curing Age (Days) |
Trials |
No. of Specimens |
|
TEM |
320 kg/cm2 |
3 |
compressive strength |
3 |
|
7 |
3 |
|||
|
28 |
6 |
|||
|
GECONSAC |
320 kg/cm2 |
28 |
compressive strength |
6 |
|
DINO |
320 kg/cm2 |
28 |
compressive strength |
6 |
|
QCE |
320 kg/cm2 |
28 |
compressive strength |
6 |
|
Total tests |
30 |
|||
2.5 Experimental procedure
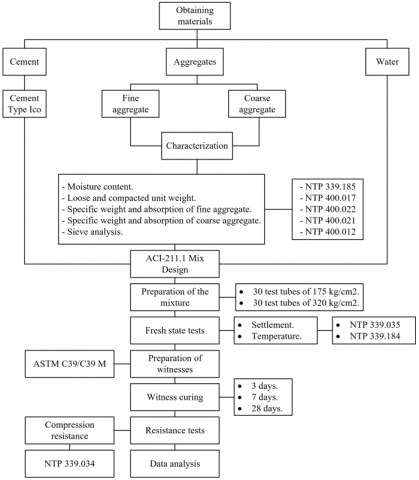
Figure 1 shows the steps to follow in the research project are explained, first we are going to buy the materials (Ico type cement, fine and coarse aggregates, water); The second step is characterized by the tests of moisture content, unit weight and compacting, specific weight and absorption of fine and coarse aggregate, granulometric analysis by sieving; in the third step, the mixture design is made with the ACI-211.1 standard; in the fourth step, the design of the mixture of 175 kg/cm2 and 320 kg/cm2 is developed; in the fifth step, the test is carried out in the fresh state (settling and temperature); in the sixth step, the cylindrical cores are made in compliance with the ASTM C-39/C39 M standard; in the seventh step, the specimens are cured for 3, 7 and 28 days; Finally, the specimens are tested for compressive strength to determine the coefficient of variation and multi-laboratory dispersion.
Figure 1. Flowchart of the research procedure
2.5.1 Specimen preparation and quality control
The concrete was made in accordance with the guidelines of ACI 211.1, using stone aggregates from local quarry, type I cement and a water/cement ratio of 0.55 for f'c = 175 kg/cm² and 0.50 for f'c = 320 kg/cm². The materials were mixed in a 250-liter capacity horizontal axis betonera, following the load sequence recommended by the standard: First the dry aggregates, then the cement, and finally the kneading water in a total mixing time of three minutes.
The cylindrical specimens (150 mm × 300 mm) were molded by hand rod in three layers (25 strokes per layer), in accordance with the procedure established in ASTM C-31. Curing was carried out in saturated water at 23 ± 2℃ until the time of the test.
Compression tests were performed in accordance with ASTM C-39/C39M-18. Each specimen was carefully centered in the hydraulic press, applying load at a controlled rate of 0.25 MPa/s until cylinder failure. The maximum load was recorded in kilonewtons (KN) and then converted to megapascals (MPa).
Regarding calibration, although all laboratories declared compliance with equipment calibration protocols, metrological traceability was not verified through updated certificates. This limitation is recognized as a potential factor of variability in the results obtained.
2.5.2 Moisture content
The percentage of moisture content is governed by N.T.P. 339.185. First, the materials are obtained from the fine and coarse aggregate of the El milagro – Trujillo quarry, the containers were weighed with an analytical balance with an accuracy of 0.1 grams in order to add the samples, the aggregate is subjected to a temperature of 110℃ ± 5℃ in the furnace for a full day. In order to obtain the average of the results, three samples will be used. The moisture content is calculated using the formula below:
$P=\frac{100(w-D)}{D}$ (2)
P: Total evaporable total moisture content of the sample in percentage. W: Mass of the original wet samples in grams. D: Mass of the dry sample in grams.
2.5.3 Unit weight of the soil and compacting
This type of test is developed for different aggregates according to the NTP 400.017 standard, we also detail the methods of calculating the unit weight and compacted. The materials are put in a container and with a rod to make 25 blows and at the end we level it flush with the container, likewise, the aggregate is placed in the mold to fill a height greater than 50 mm above the upper edge.
The soil and compacted unit weight is calculated with the following formulas:
$M=\frac{(G-T)}{V}$ (3)
$M=(G-T) * F$ (4)
where, M = unit weight of the aggregate in kg/m3 (lb/p3). G = weight of the measuring container plus the aggregate in kg(lb). T = weight of the measuring container in kg(lb). V = volume of the measurement in m3 (p3) F = factor of the measurement in m-3 (p3).
2.5.4 Specific weight and absorption of the fine aggregate
To carry out the weight and absorption of the fine aggregate, it is carried out according to the NTP.4000.022 standard. First, the material that we have selected is taken out of the furnace through a crack, then water greater than 50 mm is added to leave it for 24 hours, secondly, once the materials have been obtained with 1 day of rest, it is separated in an aluminum mold to put it in the oven. the weather and let it dry. Then it is placed in a cone where 25 blows will be applied for each layer until it is filled; If the sample crumbles the testing process is correct, the final step is carried out where the material is placed in a pycnometer and we add 90% of water to leave it for 24 hours, we proceed to remove the water and let the sample rest in the pycnometer, also the sample obtained is taken to the oven to obtain the results.
The specific weight and absorption of the fine aggregate is calculated with the following formulas:
$\gamma=\frac{P}{V}$ (5)
γ: Specific weight. P: Aggregate weight. V: Aggregate Volume.
${Absorption}(\%)=\left(\frac{W s-W d}{W d}\right) * 100$ (6)
Ws: Weight of saturated aggregate. Wd: Dry aggregate weight.
2.5.5 Specific weight and absorption of the coarse aggregate
To carry out the weight and absorption of the coarse aggregate, it is carried out according to the NTP.4000.021 standard. First, the material that we have selected is taken out of the furnace through a crack, then water greater than 50 mm is added to leave it for 24 hours, secondly, once the materials have been obtained with 1 day of rest, it is separated in an aluminum mold to put it in the oven. the weather and letting it dry the sample crumbles the test process is correct, the final step is carried out where the material is placed in a machine where 90% of water is immersed to leave it for 24 hours, the water is removed and the sample is left to rest, also the sample obtained is taken to the oven to obtain the results.
The specific gravity and absorption of the coarse aggregate is calculated with the following formulas:
$\gamma=\frac{P}{V}$ (7)
γ: Specific weight. P: Aggregate weight. V: Aggregate volume.
${Absorption}(\%)=\left(\frac{W s-W d}{W d}\right) * 100$ (8)
Ws: Weight of saturated aggregate. Wd: Dry aggregate weight.
2.5.6 Granulometric analysis
The granulometric analysis of aggregates is a test that is carried out by sieving them, either for sand (fine) or for stone (coarse) governed by the same standard, N.T.P.400.012. It consists of dividing and separating the material by means of a series of sieves into several particle size fractions of decreasing size in such a way that the quantities by weight of each size that contribute the total weight can be known. The standard tells us that when a sample portion of the material is obtained after quartering, an amount equal to or greater than the minimum permitted mass must be reserved, according to the maximum nominal size of each aggregate. This amount of aggregate will be screened using a series of stacked sieves, arranged from largest to smallest mesh size, from top to bottom, stirred for a sufficient period of time so that only the particles corresponding to its size remain in each sieve. After the sieving process, the weight of the particles retained in each sieve is noted to calculate the corresponding percentages, which are used to draw the particle size curve, which must be located within the curves defined by the minimum and maximum limits established in N.T.P.400.037. It is essential to note that, for coarse aggregate, the limits are set according to their maximum nominal size, and are organized into specific particle size categories. Finally, the sand must meet certain requirements to be classified as coarse sand, and must have a fineness modulus that varies between 2.3 and 3.1; This range will be calculated using the formula presented below:
$M F=\frac{\left(\sum \% { accumulated\ retained\ in\ meshes\ No.\ 4} \ { to\ No.\ 100) }\right.}{100}$ (9)
where,
MF = Modulus of fineness. ∑ = Percentage retained accumulated in mesh No. 4 to No. 100.
2.5.7 Distribution and manufacture of specimens
The concrete mixtures for both designs (f'c = 175 kg/cm² and f'c = 320 kg/cm²) were manufactured centrally in the TEM Laboratory, using the same aggregates, cement and water, with controlled procedures according to the ACI 211.1 standard. A total of 60 cylindrical specimens (150 mm × 300 mm) were moulded into standardised moulds.
After the initial setting, the specimens were transferred to the participating laboratories (DINO, QCE and GECONSAC) to be cured and tested in their own facilities, while a part remained in TEM. Distribution was carried out within the first 4 hours after molding, using protected transport and avoiding excessive vibrations, in compliance with the guidelines of the ASTM C-31/C31M standard on handling and transport of specimens.
This procedure allowed the mixture design variable to be kept homogeneous, focusing the analysis exclusively on the operational differences in curing and testing between laboratories.
The total number of specimens manufactured, as well as their initial distribution for workability tests, is shown in Table 3. The specific allocation of specimens per laboratory for compressive strength tests is detailed in Tables 4 and 5.
2.5.8 Compression test and equipment conditions
The compression tests were carried out in four regional laboratories in the city of Trujillo: TEM, GECONSAC, DINO and QCE. All laboratories reported that their hydraulic presses were operational and calibrated at the time of the tests, in accordance with the requirements established by the ASTM C-39 standard. Details of the equipment used and their calibration status are presented in Table 6.
Table 6. Detail of equipment calibration by laboratory
|
Laboratory |
Press Capacity (KN) |
Calibration Available |
Last Checked Date |
Grading Entity |
|
DINO |
2000 |
Yes |
Jun-24 |
INACAL |
|
QCE |
2000 |
YES |
Jun-24 |
INACAL |
|
TEM |
2000 |
YES |
Jun-24 |
INACAL |
|
GECONSAC |
2000 |
YES |
Jun-24 |
INACAL |
The calibration information was reported by the participating laboratories themselves, indicating that the presses used had a current verification at the time of the tests, in accordance with the quality requirements established by the ASTM C-39 standard.
3.1 Characteristics of aggregates
To finish the research project, the materials were first obtained from the "El Milagro" quarry located in the province of Trujillo. After obtaining the fine aggregates and coarse aggregates, they were taken to the TEM (Technology in Materials Testing) laboratory. Likewise, it was identified that the materials are suitable for the research where the following results were achieved in the Table 7.
Table 7. Characteristics of the fine aggregate
|
Practice |
Und. |
N.T.P |
Results |
|
Moisture content |
% |
339.19 |
0.10 |
|
Loose unit weight |
kg/m3 |
400.02 |
1.68 |
|
Compacted unit weight |
kg/m3 |
400.02 |
1.83 |
|
Specific weight |
g/m3 |
400.02 |
1.79 |
|
Absorption |
% |
400.02 |
0.20 |
|
Granulometric analysis by sieving |
_ |
400.02 |
2.75 |
Table 7 shows the design of the average results of each test performed on the fine aggregate of the tests such as moisture content, loose unit weight, compacted unit weight, specific weight, absorption and respecting the N.T.P.
Table 8 shows the design of the average results of each test performed on the aggregate thickness of the tests such as moisture content, loose unit weight, compacted unit weight, specific weight, absorption and respecting the N.T.P.
Table 8. Characteristics of coarse aggregate
|
Practice |
Und. |
N.T.P. |
Result |
|
Moisture content |
% |
339.19 |
3.70 |
|
Loose unit weight |
kg/m3 |
400.02 |
1.37 |
|
Compacted unit weight |
kg/m3 |
400.02 |
1.55 |
|
Specific weight |
g/m3 |
400.02 |
2.39 |
|
Absorption |
% |
400.02 |
1.10 |
|
Granulometric analysis by sieving |
_ |
400.01 |
6.80 |
3.2 Mixing design
Table 9 shows the 175 kg/cm2 concrete mix design, the amount of Pacasmayo Extraforte, Water, Fine Aggregate and Coarse Aggregate materials; these materials will be used in the 60 specimens.
Table 10 shows the 320 kg/cm2 concrete mix design, the amount of Pacasmayo Extraforte, Water, Fine Aggregate and Coarse Aggregate materials; these materials will be used in the 60 specimens.
Table 9. Concrete mix design 175 kg/cm2
|
Material |
Stock Weight (Kg/m3) |
Batch (m3) |
|
Pacasmayo Extraforte |
366 |
13.9 |
|
Water |
208 |
7.9 |
|
Fine aggregate |
488 |
18.54 |
|
Coarse aggregate |
860 |
32.68 |
Table 10. Concrete mix design 320 kg/cm2
|
Material |
Stock Weight (Kg/m3) |
Batch (m3) |
|
Pacasmayo Extraforte |
536 |
19.29 |
|
Water |
208 |
7.48 |
|
Fine aggregate |
385 |
13.86 |
|
Coarse aggregate |
860 |
30.96 |
3.3 Workability of concrete
Figure 2 illustrates the workability results for the 175 kg/cm² concrete mix tested in the laboratories (TEM, DINO, GECONSAC, QCE). The slump values remained within the range specified in the mix design, but with slight variations between laboratories. TEM and QCE reported higher workability, indicating a more fluid consistency, while DINO and GECONSAC exhibited lower slump values, reflecting stiffer mixtures. These differences are attributable to factors such as the moisture condition of aggregates, mixing energy, and handling time prior to testing. Importantly, the observed variations in slump were consistent with the compressive strength results at 28 days: laboratories with higher slump (greater fluidity) showed more homogeneous strength values, while lower slump corresponded to slightly higher dispersion in compressive strength outcomes.
Figure 2. Workability of concrete 175 kg/cm2
Figure 3 shows the workability of the 320 kg/cm² concrete mix across the same laboratories. In this case, the higher cement content resulted in a mixture with greater cohesiveness and slightly reduced slump compared to the 175 kg/cm² mix. TEM and QCE again presented the highest slump values, ensuring adequate placement and compaction, whereas DINO and GECONSAC recorded lower workability. The relationship with compressive strength was similar: more workable mixtures tended to reach the target strength with less variability, while stiffer mixtures displayed wider dispersion of results at 28 days.
Figure 3. Workability of concrete 320 kg/cm2
3.4 Compressive strength of concrete 175 kg/cm2
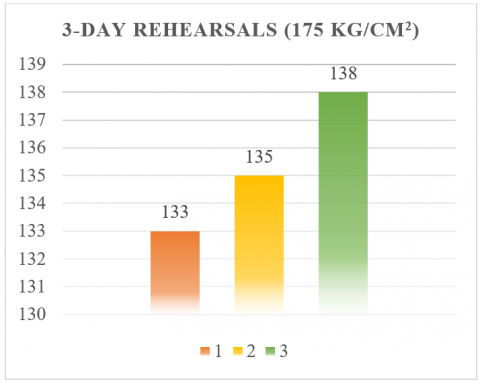
In the TEM laboratory the compressive strength of the 3, 7, 28 days of curing was developed, from Figure 4, the curing of 3 days is evidenced for the 3 specimens, in bar 1 it has a resistance of 133 kg/cm2; in bar 2 it has a resistance of 135 kg/cm2 and in bar 3 it has a resistance of 138 kg/cm2, where we can see that in the third bar the resistance is greater resistance than the other bars.
Figure 4. Compressive strength (175 kg/cm2) of concretes at 3 days of curing
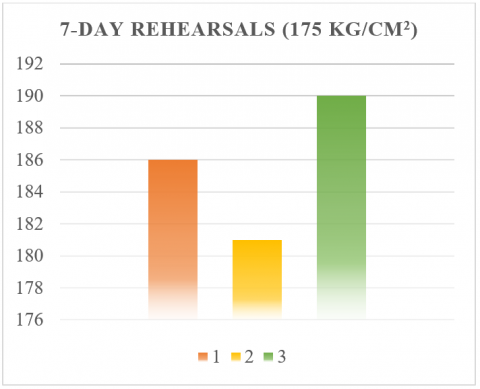
In Figure 5, the curing of 7 days is evidenced for the 3 specimens, in bar 1 it has a resistance of 186 kg/cm2; in bar 2 it has a resistance of 181 kg/cm2 and in bar 3 it has a resistance of 190 kg/cm2, where we can see that in the third bar the resistance is greater resistance than the other bars.
Figure 5. Compressive strength (175 kg/cm2) of concretes at 7 days of curing
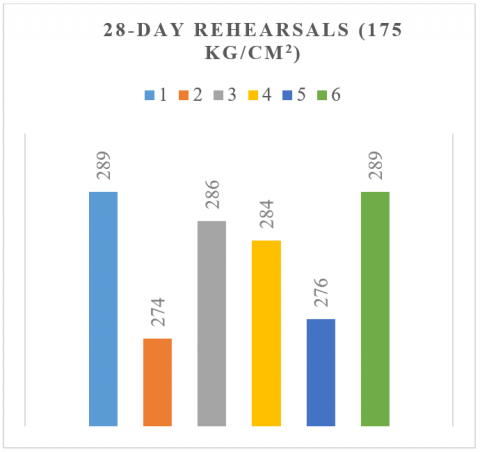
In the TEM laboratory the compressive strength of the 28 days of curing was developed, Figure 6 shows the curing of 28 days for the 6 specimens, in bar 1 it has a resistance of 289 kg/cm2; in bar 2 it has a resistance of 274 kg/cm2, in bar 3 it has a resistance of 286 kg/cm2, in bar 4 it has a resistance of 284 kg/cm2, in bar 5 it has a resistance of 276 kg/cm2 and in bar 6 it has a resistance of 289 kg/cm2 from where we can see that in bar 1 and bar 6 they have greater resistance than the other bars.
Figure 6. Compressive strength (175 kg/cm2) of concretes at 28 days of curing
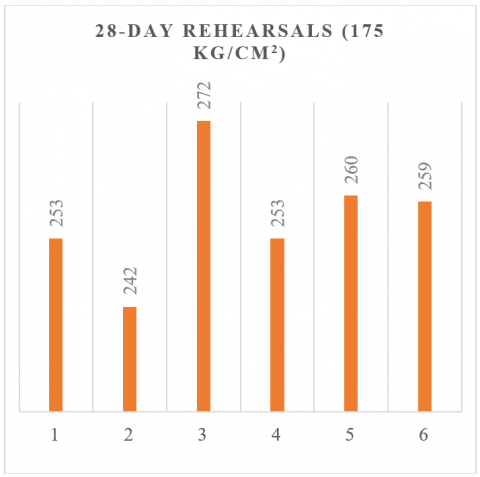
In the GECONSAC laboratory the compressive strength of the 28 days of curing was developed, from Figure 7, the curing of 28 days is evidenced for the 6 specimens, in bar 1 it has a resistance of 272.60 kg/cm2; in bar 2 it has a resistance of 281.177 kg/cm2, in bar 3 it has a resistance of 245.48 kg/cm2, in bar 4 it has a resistance of 271.71 kg/cm2, in bar 5 it has a resistance of 240.51 kg/cm2 and in bar 6 it has a resistance of 258.59 kg/cm2 from where we can see that in bar 2 it has greater resistance than the other bars.
Figure 7. Compressive strength (175 kg/cm2) of concretes at 28 days of curing- GECONSAC laboratory
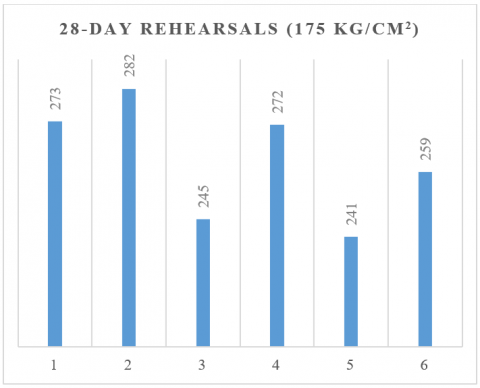
In the DINO laboratory the compressive strength of the 28 days of curing was developed, Figure 8 shows the curing of 28 days for the 6 specimens, in bar 1 it has a resistance of 253 kg/cm2; in bar 2 it has a resistance of 242 kg/cm2, in bar 3 it has a resistance of 272 kg/cm2, in bar 4 it has a resistance of 253 kg/cm2, in bar 5 it has a resistance of 260 kg/cm2 and in bar 6 it has a resistance of 259 kg/cm2, where we can see that in bar 3 it has greater resistance than the other bars.
Figure 8. Compressive strength (175 kg/cm2) of concretes at 28 days of curing- DINO laboratory
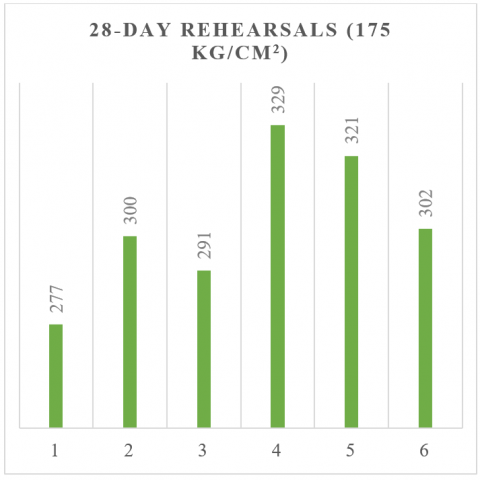
In the QCE laboratory the compressive strength of the 28 days of curing was developed, Figure 9 shows the curing of 28 days for the 6 specimens, in bar 1 it has a resistance of 277 kg/cm2; in bar 2 it has a resistance of 300 kg/cm2, in bar 3 it has a resistance of 291 kg/cm2, in bar 4 it has a resistance of 329 kg/cm2, in bar 5 it has a resistance of 321 kg/cm2 and in bar 6 it has a resistance of 302 kg/cm2, where we can see that in bar 4 it has greater resistance than the other bars.
Figure 9. Compressive strength (175 kg/cm2) of the concretes at 28 days of curing- QCE laboratory
3.5 Compressive strength of concrete 320 kg/cm2
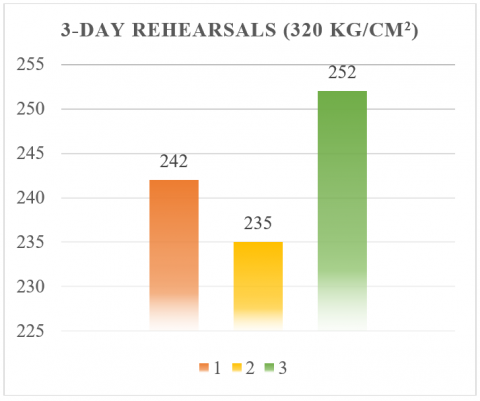
In the TEM laboratory the compressive strength of the 3, 7, 28 days of curing was developed, Figure 10 shows the curing of 3 days for the 3 specimens, in bar 1 it has a resistance of 242 kg/cm2; in bar 2 it has a resistance of 235 kg/cm2, in bar 3 it has a resistance of 252 kg/cm2, where we can see that in bar 3 it has greater resistance than the other bars.
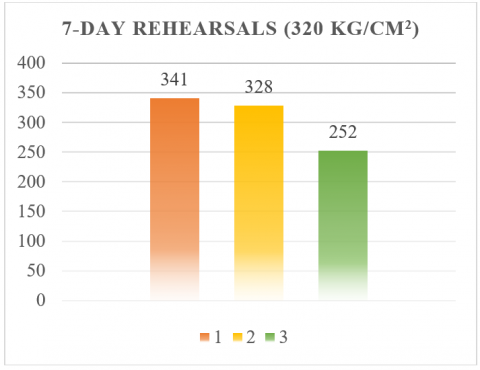
In Figure 11, the curing of 7 days is evidenced for the 3 specimens, in bar 1 it has a resistance of 341 kg/cm2; in bar 2 it has a resistance of 328 kg/cm2, in bar 3 it has a resistance of 326 kg/cm2, where we can see that in bar 1 it has greater resistance than the other bars.
Figure 10. Compressive strength (320 kg/cm2) of the concretes at 3 days of curing- TEM laboratory
Figure 11. Compressive strength (320 kg/cm2) of the concretes at 7 days of curing- TEM laboratory
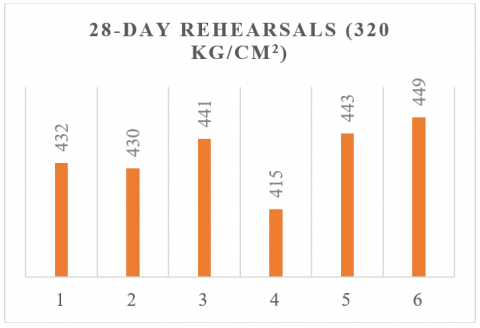
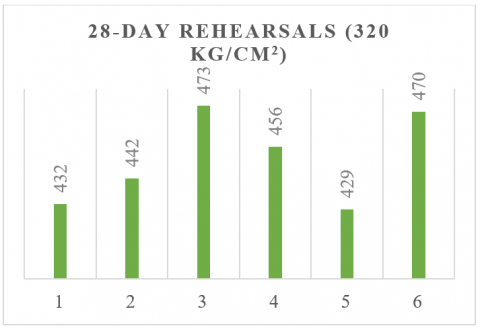
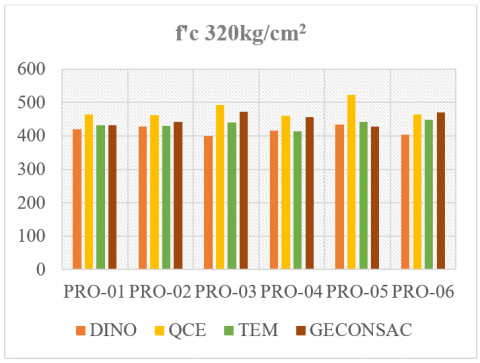
In the TEM laboratory the compressive strength of the 28 days of curing was developed, Figure 12 shows the curing of 28 days for the 6 specimens, in bar 1 it has a resistance of 432 kg/cm2; in bar 2 it has a resistance of 430 kg/cm2, in bar 3 it has a resistance of 441 kg/cm2, in bar 4 it has a resistance of 415 kg/cm2, in bar 5 it has a resistance of 443 kg/cm2 and in bar 6 it has a resistance of 449 kg/cm2, where we can see that in bar 6 it has greater resistance than the other bars.
Figure 12. Compressive strength (320 kg/cm2) of concretes at 28 days of curing - TEM laboratory
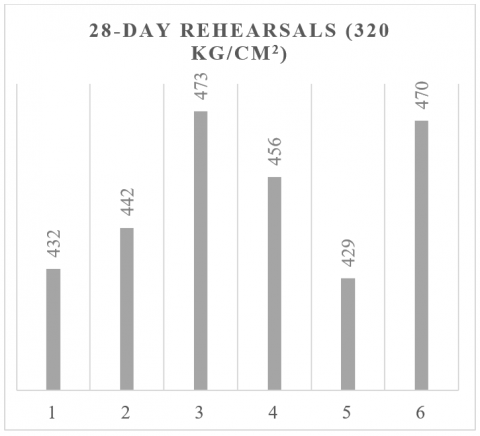
In the GECONSAC laboratory the compressive strength of the 28 days of curing was developed, Figure 13 shows the curing of 28 days for the 6 specimens, in bar 1 it has a resistance of 431.63 kg/cm2; in bar 2 it has a resistance of 442.45 kg/cm2, in bar 3 it has a resistance of 472.88 kg/cm2, in bar 4 it has a resistance of 455.69 kg/cm2, in bar 5 it has a resistance of 429.21 kg/cm2 and in bar 6 it has a resistance of 470.33 kg/cm2, where we can see that in bar 3 it has greater resistance than the other bars.
Figure 13. Compressive strength (320 kg/cm2) of concretes at 28 days of curing - GECONSAC laboratory
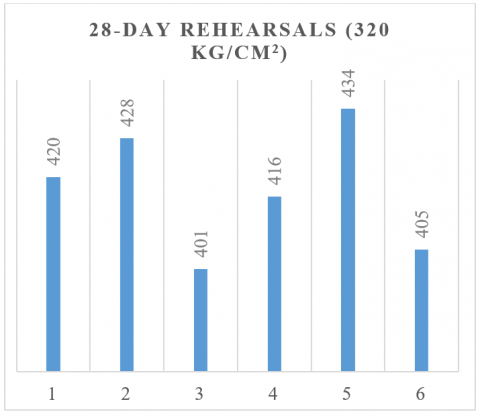
In the DINO laboratory the compressive strength of the 28 days of curing was developed, from Figure 14, the curing of 28 days is evidenced for the 6 specimens, in bar 1 it has a resistance of 420 kg/cm2; in bar 2 it has a resistance of 428 kg/cm2, in bar 3 it has a resistance of 401 kg/cm2, in bar 4 it has a resistance of 416 kg/cm2, in bar 5 it has a resistance of 434 kg/cm2 and in bar 6 it has a resistance of 405 kg/cm2, where we can see that in bar 5 it has greater resistance than the other bars.
Figure 14. Compressive strength (320 kg/cm2) of concretes at 28 days of curing - DINO laboratory
In the QCE laboratory the compressive strength of the 28 days of curing was developed, Figure 15 shows the curing of 28 days for the 6 specimens, in bar 1 it has a resistance of 464 kg/cm2; in bar 2 it has a resistance of 463 kg/cm2, in bar 3 it has a resistance of 492 kg/cm2, in bar 4 it has a resistance of 461 kg/cm2, in bar 5 it has a resistance of 523 kg/cm2 and in bar 6 it has a resistance of 465 kg/cm2, where we can see that in bar 5 it has greater resistance than the other bars.
Figure 15. Compressive strength (320 Kg/cm2) of concretes at 28 days of curing-- QCE laboratory
3.6 Compressive strength of concrete 175 kg/cm2 and 320 kg/cm2
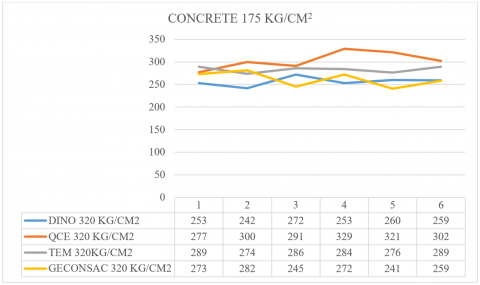
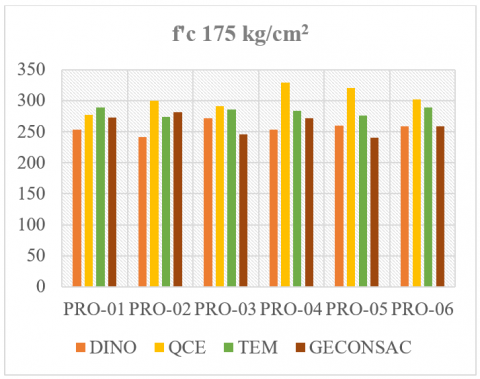
Table 11 shows the results of the 175 kg/cm2 concrete produced in the laboratories (DINO, QCE, TEM, GECONSAC) showing a number of specimens (6 units in each of them), the minimum quantity DINO 242; QCE 277; TEM 274, GECONSAC 240.51. The maximum quantity DINO 242; QCE 277; TEM 274; GECONSAC 240.51. The average of the maximum and minimum amount is DINO 256.5; QCE 303.3; TEM 283; GECONSAC 261.8. The percentage of variation is presented in the DINO laboratory 11.70%; QCE 17.10%; TEM 5.30%; GECONSAC 15.80%. The average standard deviation in DINO 9.1; QCE 17.5; TEM 5.9; GECONSAC 15. Its variance in the DINO laboratory 98.7; QCE 365.9; TEM 42.4; GECONSAC 268.7. The median in the DINO laboratory was 256; QCE 301; TEM 285; GECONSAC 265.15. The validation coefficient in the DINO laboratory is 3.50%; QCE 5.80%; TEM 2.10%; GECONSAC 5.70%.
Table 11. Concrete result 175 kg/cm2
|
No. |
Sample |
DINO |
QCE |
TEM |
GECONSAC |
|
1 |
PRO-01 |
253 |
277 |
289 |
273 |
|
2 |
PRO-02 |
242 |
300 |
274 |
282 |
|
3 |
PRO-03 |
272 |
291 |
286 |
245 |
|
4 |
PRO-04 |
253 |
329 |
284 |
272 |
|
5 |
PRO-05 |
260 |
321 |
276 |
241 |
|
6 |
PRO-06 |
259 |
302 |
289 |
259 |
|
N = |
6 |
6 |
6 |
6 |
|
|
Min = |
242 |
277 |
274 |
240.51 |
|
|
Max = |
272 |
329 |
289 |
281.77 |
|
|
Average = |
256.5 |
303.3 |
283.0 |
261.8 |
|
|
% Var = |
11.7% |
17.1% |
5.3% |
15.8% |
|
|
Desv Std Prom = |
9.1 |
17.5 |
5.9 |
15.0 |
|
|
Variance = |
98.7 |
365.9 |
42.4 |
268.7 |
|
|
Median = |
256 |
301 |
285 |
265.15 |
|
|
Coef. Validation = |
3.5% |
5.8% |
2.1% |
5.7% |
|
Figure 16. Final result of concrete 175 kg/cm2
In Figure 16, the 6 specimens of each laboratory are shown, and the results of Figures 6-9 will also be compared. In PRO-01 it is determined that the TEM laboratory has the highest resistance and the least resistance is the DINO laboratory.
In PRO-02 it is determined that the highest resistance is from the QCE laboratory and the lowest is from the DINO laboratory. In PRO-03 it is determined that the highest resistance is from the QCE laboratory and the lowest is from the GECONSAC laboratory. In PRO-04 it is determined that the highest resistance is from the QCE laboratory and the lowest from the DINO laboratory. In PRO-05 it is determined that the highest resistance is from the QCE laboratory and the least resistance is from the GECONSAC laboratory. In PRO-06 it is determined that the highest resistance is from the QCE laboratory and the least resistance is from the DINO laboratory.
Figure 17. Statistical result of concrete 175 kg/cm2
In Figure 17, it is evident in the laboratories that DINO has an average standard deviation of 9.1 and thus we determine the validation coefficient of 3.5%. In the laboratory QCE has an average standard deviation of 17.5 and thus we determined the validation coefficient of 5.8%. In the TEM laboratory it has a deviation of 5.9 and thus we determined the validation coefficient of 2.1%. In the GECONSAC laboratory it has a deviation of 15.0 and thus we determined the validation coefficient 5.7%. The final result is determined that in the QCE laboratory it has a higher percentage of 17.5 and the TEM laboratory has the lowest percentage of 5.9.
Table 12. Coefficient of variation at 28 days, concrete f ́c of 175 kg/cm²
|
Laboratory |
Coefficient of Variation (%) |
Meets ASTM C-39 (≤ 4.6%) |
|
DINO |
3.5 |
Yes |
|
QCE |
5.8 |
No |
|
TEM |
2.1 |
Yes |
|
GECONSAC |
5.7 |
No |
According to ASTM C-39, the maximum recommended limit for the coefficient of variation (CV) in multi-laboratory tests is 4.6%. In the 175 kg/cm² mix design, TEM and DINO laboratories met this parameter. In contrast, QCE and GECONSAC exceeded this limit, suggesting greater variability in their 28-day compression results (Table 12).
Table 13. Concrete result 320 kg/cm2
|
No. |
SAMPLE |
DINO |
QCE |
TEM |
GECONSAC |
|
1 |
PRO-01 |
420 |
464 |
432 |
32 |
|
2 |
PRO-02 |
428 |
463 |
430 |
442 |
|
3 |
PRO-03 |
401 |
492 |
441 |
473 |
|
4 |
PRO-04 |
416 |
461 |
415 |
456 |
|
5 |
PRO-05 |
434 |
523 |
443 |
429 |
|
6 |
PRO-06 |
405 |
465 |
449 |
470 |
|
N = |
6 |
6 |
6 |
6 |
|
|
Min = |
401 |
461 |
415 |
429.21 |
|
|
Max = |
434 |
523 |
449 |
472.88 |
|
|
Average = |
417.3 |
478.0 |
435.0 |
450.4 |
|
|
% Var = |
7.9% |
3.0% |
7.8% |
9.7% |
|
|
Desv Std Prom = |
11.7 |
22.7 |
11.0 |
17.3 |
|
|
Variance = |
163.9 |
620.0 |
146.0 |
359.0 |
|
|
Median = |
418 |
464.5 |
436.5 |
449.07 |
|
|
Coef. Validation = |
2.8% |
4.8% |
2.5% |
3.8% |
|
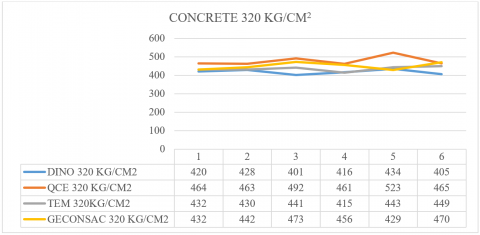
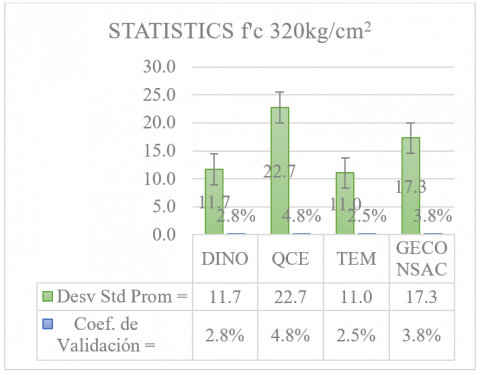
Table 13 shows the results of the 320 kg/cm2 concrete produced in the laboratories (DINO, QCE, TEM, GECONSAC) where a number of specimens (6 units in each of them) is shown, the minimum quantity DINO 401; QCE 461; TEM 415, GECONSAC 429.21. The maximum quantity DINO 434; QCE 523; TEM 449; GECONSAC472.88. The average of the maximum and minimum quantity is DINO 417.3; QCE 478; TEM 435; GECONSAC 450.4. The percentage of the variation is presented in the DINO laboratory at 7.90%; QCE 13.00%; TEM 7.80%; GECONSAC 9.70%. The average standard deviation in DINO 11.7; QCE 22.7; TEM 11; GECONSAC 17.3. Its variance in the DINO laboratory 163.9; QCE 620; TEM 146; GECONSAC 359. The median in the DINO laboratory was 418; QCE 464.5; TEM 436.8; GECONSAC 449.07. The validation coefficient in the DINO laboratory is 2.80%; QCE 4.80%; TEM 2.50%; GECONSAC 3.80%.
Table 14. Coefficient of variation at 28 days, concrete f ́c of 320 kg/cm²
|
Laboratory |
Coefficient of Variation (%) |
Meets ASTM C-39 (≤ 4.6%) |
|
DINO |
2.8 |
Yes |
|
QCE |
4.8 |
No |
|
TEM |
2.5 |
Yes |
|
GECONSAC |
3.8 |
Yes |
Table 14 shows that the 320 kg/cm² mixture design, the TEM, DINO and GECONSAC laboratories complied with the maximum limit of 4.6% established by the ASTM C-39 standard for the coefficient of variation (CV). On the other hand, QCE presented a value slightly above the threshold, which indicates a slight additional dispersion in its results.
Figure 18. Concrete results 320 kg/cm2
In Figure 18, the 6 specimens of each laboratory are shown, and the results of Figures 12-15 will also be compared. In PRO-01 it is determined that the highest resistance is in the QCE laboratory and the least resistance is in the DINO laboratory. In PRO-02 it is determined that the highest resistance is from the QCE laboratory and the lowest is from the DINO laboratory. In PRO-03 it is determined that the highest resistance is from the QCE laboratory and the lowest is from the DINO laboratory. In PRO-04 it is determined that the highest resistance is from the QCE laboratory and the lowest from the TEM laboratory. In PRO-05 it is determined that the highest resistance is from the QCE laboratory and the least resistance is from the GECONSAC laboratory. In PRO-06 it is determined that the highest resistance is from the GECONSAC laboratory and the least resistance is from the DINO laboratory.
In Figure 19, it is evident in the laboratories that DINO has an average standard deviation of 11.7 and thus we determine the validation coefficient of 2.8%. In the laboratory QCE has an average standard deviation of 22.7 and thus we determined the validation coefficient of 4.8%. In the TEM laboratory it has a deviation of 11.0 and thus we determined the validation coefficient of 2.5%. In the GECONSAC laboratory it has a deviation of 17.3 and thus we determined the validation coefficient 3.8%. The final result is determined that in the QCE laboratory it has a higher percentage of 22.7 and the TEM laboratory has the lowest percentage of 11.0.
Figure 19. Statistical result of concrete 320 kg/cm2
The experimental program was based on the ACI 211.1 mix design method, targeting strengths of f'c = 175 kg/cm² and f'c = 320 kg/cm², with slumps of 6″ and 7″, respectively. The mix proportions summarized in Tables 15 and 16 ensured consistent material dosing across all batches, with a total of 60 cylindrical specimens prepared for testing. The subsequent evaluation in four laboratories (TEM, GECONSAC, DINO, QCE) provided a valuable basis for interlaboratory comparison of fresh and hardened concrete properties.
Table 15. Concrete mix design 175 kg/cm2
|
Material |
Stock Weight (kg/m3) |
Batch (m3) |
|
Pacasmayo Extraforte |
366 |
13.9 |
|
Water |
208 |
7.9 |
|
Fine Aggregate |
488 |
18.54 |
|
Coarse Aggregate |
860 |
32.68 |
Table 16. Concrete mix design 320 kg/cm2
|
Material |
Stock Weight (kg/m3) |
Batch (m3) |
|
Pacasmayo Extraforte |
536 |
19.29 |
|
Water |
208 |
7.48 |
|
Fine Aggregate |
385 |
13.86 |
|
Coarse Aggregate |
860 |
30.96 |
The next step is to place the aggregates in a concrete mixer of f'c= 175kg/cm2 and f'c= 320 kg/cm2, where we will obtain different results for 3, 7 and 28 days of curing in the 4 selected laboratories TEM, GECONSAC, DINO, QCE.
In this research, it was possible to determine the coefficient of variation and the multi-laboratory dispersion, obtaining the following results: DINO registered an average standard deviation of 11.7 and a coefficient of variation of 2.8%; QCE had a mean standard deviation of 22.7 and a coefficient of 4.8%; TEM obtained an average standard deviation of 11.0 and a coefficient of 2.5%, while GECONSAC reached a standard deviation of 17.3 and a coefficient of variation of 3.8%.
When comparing these values with the reference limits established by the ASTM C-39 standard for multilaboratory tests, it is concluded that the TEM and DINO laboratories satisfactorily meet the acceptable threshold of statistical accuracy, registering coefficients of variation less than 4.6% for both mixture designs (175 and 320 kg/cm²). On the other hand, QCE exceeds this threshold in both mixtures, while GECONSAC exceeds the limit in the design of 175 kg/cm². This evaluation, as shown in Tables 14 and 16, shows the need for laboratories with high deviations to strengthen their quality control processes, particularly in the standardization of test procedures, metrological verification of equipment and technical training of personnel.
In particular, the QCE laboratory, presenting the highest standard deviation and the highest coefficient of variation among the four evaluated, reflects a significant variability in its results. This dispersion could be associated with factors such as poorly standardized internal procedures, differences in specimen curing, or the lack of recent calibration of testing equipment. The influence of the experience and training of the operational personnel is also considered. Based on the accuracy limits set by ASTM C-39 for multi-laboratory studies, the values reported by QCE are outside the optimal range, suggesting the need to implement internal technical audits and ongoing training programs.
It is worth mentioning that, although some laboratories indicated that they were certified to perform compression tests, no documents were presented to support such accreditations, such as the registration number, the technical scope or the certifying entity. This lack of traceability in certification represents a limitation to directly correlate accreditation with the statistical performance of laboratories.
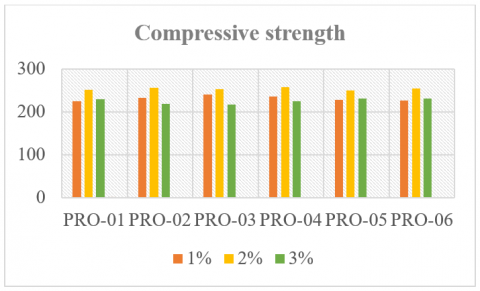
On the other hand, a thesis [22] was identified in the literature review that studied the compressive strength in concretes with the addition of coconut fiber and different percentages of fine and coarse aggregate, with a design of f'c = 210 kg/cm². In this study, 48 specimens were tested at 14 and 28 days, obtaining significant increases in resistance for contents of 1%, 2% and 3% of additive. However, although this type of work contributes to the development of alternative technologies, its approaches and objectives are not directly aligned with the purpose of this study, which focuses exclusively on the variability of interlaboratory results under conventional test conditions.
In this sense, although comparative calculations of the coefficient of variation and dispersion were carried out in concretes with additives such as coconut fiber (where standard deviation values between 2.0 and 5.7, and coefficients of variation between 0.8% and 2.4% were obtained), these data cannot be directly extrapolated to this statistical analysis between conventional laboratories. Therefore, it has been decided to restrict the analysis and discussion to the results obtained under normative conditions of quality control, eliminating irrelevant references and strengthening the technical consistency of the interpretation.
In Figure 20, the author prepared 6 trials of 3 types of percentage quantity at 1%, 2% and 3% where it is possible to determine that it has a good percentage in PRO-04, where we want to compare our results using our method and formulas in excel.
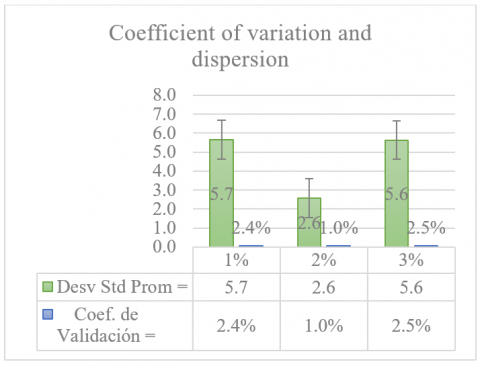
In Figure 21, the thesis students had as results in their coefficient of variation and dispersion 1% (2.4%), 2% (1.0%) and 3% (2.5%), where it is true that the lower the resistance, the greater the 2% and it is possible to put an end to our discussion.
Figure 20. Compressive strength results of concretes with 1%, 2% and 3% coconut fiber addition [39]
Figure 21. Coefficient of variation and dispersion of concretes with 1%, 2% and 3% coconut fiber addition [39]
According to ASTM C-39/C39M-18, in multi-laboratory studies the typical acceptable coefficients of variation for concretes with strengths below 35 MPa range from 4% to 6%, depending on the level of reproducibility sought and the test environment. In this study, the TEM and DINO laboratories have QoL below 3%, which reflects an adequate technical control. GECONSAC is at the acceptable limit, while QCE exceeds the reference values established by the standard, even reaching 4.8% on average.
In Table 17, the deviation suggests a loss of statistical reproducibility which, according to the technical literature and regulatory experience, may be related to several operational factors: Expired or inaccurate calibrations in the test presses, lack of uniformity in mixing and curing procedures, or deficiencies in the training of the personnel performing the tests. Previous studies have documented that human error and variability in specimen positioning directly influence the dispersion of results, especially when centralized alignment and loading protocols are not used.
Table 17. Calculation of the coefficient of variation and dispersion [39]
|
No. |
SAMPLE |
1% |
2% |
3% |
|
1 |
PRO-01 |
224.2 |
251.12 |
229.78 |
|
2 |
PRO-02 |
232.22 |
255.82 |
219.05 |
|
3 |
PRO-03 |
240.97 |
252.61 |
217.41 |
|
4 |
PRO-04 |
235.59 |
257.24 |
224.73 |
|
5 |
PRO-05 |
227.93 |
249.89 |
231.76 |
|
6 |
PRO-06 |
227.09 |
254.57 |
230.54 |
|
N = |
6 |
6 |
6 |
|
|
Min = |
224.2 |
249.89 |
217.41 |
|
|
Max = |
240.97 |
257.24 |
231.76 |
|
|
Average = |
231.3 |
253.5 |
225.5 |
|
|
% Var = |
7.2% |
2.9% |
6.4% |
|
|
Desv Std Prom = |
5.7 |
2.6 |
5.6 |
|
|
Variance = |
38.4 |
8.0 |
38.1 |
|
|
Median = |
230.075 |
253.59 |
227.255 |
|
|
Coef. Validation = |
2.4% |
1.0% |
2.5% |
|
In the case of QCE, it is recommended to implement an internal technical audit, review field test protocols, ensure metrological traceability of the equipment used, and periodically train technical personnel, in order to reduce variability and comply with the interlaboratory accuracy standards required by international standards such as ASTM C-39 and complementary standards such as ISO/IEC 17025.
According to ASTM C-39/C39M-18, for concrete mixes with compressive strength less than 35 MPa, the typical coefficient of variation of reproducibility between laboratories should not exceed 4.6%. In the case of the QCE laboratory, an average CV of 4.8% was observed, which represents an excess of 0.2 percentage points with respect to the normative threshold. Although this difference may seem marginal, in structural contexts it can imply significant errors in the acceptance of concrete, especially if it is a large volume or highly critical work.
This deviation, although slight, reveals a break in QCE's interlaboratory control capacity, which must be addressed through the standardization of procedures and the metrological traceability of its equipment. Its inclusion within the "non-standard" range of ASTM C-39 justifies the need to implement urgent technical improvements and makes the laboratory a priority case for continuous improvement and technical audit programs.
4.1 Limitations
In the present study, a mixing plant was not used for the manufacture of the specimens. Each participating laboratory reproduced the mixture design provided by the research team, following the dosage established under the guidelines of ACI 211.1. This decision responded to the need to evaluate the variability of the tests under real operating conditions, as they are usually carried out in the Trujillo region.
The aggregates and materials were procured locally by each laboratory, and detailed technical instructions were provided for the mixing, molding, curing, and testing of the cylinders. However, a system of direct supervision and cross-audits between laboratories were not implemented, which is a methodological limitation recognized in this study. This decentralization may have influenced the dispersion of results due to uncontrolled variations in factors such as mixing time, concrete homogeneity, compaction technique, or curing conditions.
Likewise, complete uniformity in the test ages was not achieved. While the TEM laboratory performed tests at 3, 7 and 28 days, the other laboratories (QCE, DINO and GECONSAC) tested only after 28 days. To guarantee the comparative validity of the statistical analysis, only the results obtained at 28 days were considered, an age that represents the most widely used technical standard in the acceptance of concrete structures. However, this lack of methodological homogeneity limits the possibility of comparing the evolution of the resistant development of concrete in all cases.
Finally, each laboratory tested six specimens per type of concrete (f'c = 175 and 320 kg/cm²), using three replicates at 28 days for two different batches. Only the TEM laboratory distributed its six specimens in three ages, using two cylinders for each interval (3, 7 and 28 days). This strategy, although valid within the practical conditions of the study, does not meet the ideal number of replicates per age defined in ASTM C-39. This limitation was due to logistical and budgetary constraints, and reflects the operational reality of regional laboratories, where testing practices are usually concentrated exclusively after 28 days.
Despite these limitations, the study offers a useful and representative approach to the interlaboratory variability existing in non-standardized regional technical contexts, and proposes a baseline on which future strategies of standardization, metrological control and technical accreditation can be implemented.
The present study evaluated the variability of concrete compressive strength results among four laboratories in the city of Trujillo, Peru, following the guidelines of the ASTM C-39 standard. Two mixture designs (f'c = 175 and 320 kg/cm²) were analyzed, with a total of 48 specimens, and the coefficient of variation (CV) and standard deviation (SD) were calculated for each laboratory.
The results show that the TEM and DINO laboratories obtained a good statistical performance, with average CV less than 3%, complying with the reproducibility limits recommended by ASTM C-39. For its part, GECONSAC is at the acceptable limit, while the QCE laboratory exceeded the threshold of 4.6% established by the standard, with an average CV of 4.8% and a SD of 22.7, evidencing a significant dispersion in its results.
This dispersion may be associated with factors such as non-standardized internal procedures, variable curing conditions, absence of recent metrological verification of the equipment, and lack of continuous training of technical personnel. Direct comparison with the normative values of ASTM C-39 allows us to conclude that QCE presents a performance outside the optimal range, which requires corrective interventions.
Among the limitations of the study are the decentralized preparation of the samples, the lack of homogeneity in the test ages (only TEM applied 3/7/28 days) and the limited number of specimens per laboratory. Although these conditions limit classical statistical reproducibility, they faithfully reflect the real operating conditions of laboratories in non-standardized Peruvian regional contexts.
The main scientific contribution of this study lies in providing a quantitative and contextual baseline on interlaboratory variability in real operating conditions, an aspect little addressed in the national and international literature. This approach allows identifying technical gaps in concrete testing processes and proposes a methodological model that can be replicated in other regions of the country.
It is recommended that future research expand the number of laboratories evaluated, standardize test ages, verify equipment calibration using traceable metrological certificates, and consider cross-technical audits between laboratories. These actions will strengthen the concrete quality control system in Peru and move towards a more robust and reliable national accreditation system. Include mix designs with mineral or chemical additives (e.g., microsilica, fly ash, plasticizers) to analyze their effect on the consistency of results between laboratories. Implement non-destructive tests such as ultrasound or sclerometer, which can be correlated with the results obtained by compression and serve as complementary methods of verification in the field. Expand the number of participating laboratories, including those accredited under ISO/IEC 17025, to generate comparisons with international quality standards. Apply blind testing methodologies, where operators are unaware of the provenance of the specimen, in order to minimize technical bias and assess the true reliability of the results.
[1] Díaz Barreiro, P. (2014). Protocol for construction pathology studies in reinforced concrete buildings in Colombia. https://www.academia.edu/71958801/Protocolo_para_los_Estudios_de_Patolog%C3%ADa_de_la_Construcci%C3%B3n_en_Edificaciones_de_Concreto_Reforzado_en_Colombia.
[2] Ojeda, J.M.P., Bocanegra, S.R., Huatangari, L.Q. (2021). Determination of the compressive strength of concrete using artificial neural network. International Journal of Engineering Technology Innovation, 11(3). https://es.scribd.com/document/417389764/Ntp-339-034-Metodo-de-Ensayo-Normalizado-for-Determination-of-Compression-Strength-of-Concrete-in-Cylindrical-Specimens.
[3] Prasittisopin, L., Ferdous, W., Kamchoom, V. (2023). Developments in the Built Environment. https://repositorio.upn.edu.pe/handle/11537/34213.
[4] Al-Zirjawi, Z., Naimi, S. (2024). The effect of concrete cover thickness for reactive powder concrete on the column resistance against fire. Mathematical Modelling of Engineering Problems, 11(5): 1366-1374. https://doi.org/10.18280/mmep.110528
[5] Parung, H., Tumpu, M., Tjaronge, M.W., Amiruddin, A.A., Walenna, M.A., Mansyur. (2023). Crack pattern of lightweight concrete under compression and tensile test. Annales de Chimie - Science des Matériaux, 47(1): 35-41. https://doi.org/10.18280/acsm.470105
[6] Fang, J., Zhao, L., Shi, J.C. (2021). Frost resistance and pore structure of concrete incorporated with rubber aggregates and nano-SiO2. Materials, 14(5): 1170. https://doi.org/10.3390/ma14051170
[7] Ahmed, A.M.A., Mantawy, I.M. (2025). Additive construction of low embodied carbon concrete: Geopolymer concrete. Journal of Building Engineering, 111: 112984. https://doi.org/10.1016/j.jobe.2025.112984
[8] Li, X.H., Li, L.J., Zheng, Y.M., Li, Y.L., Chen, Z.J., Xiao, J., Yuan, M., Zhang, J., Pan, Z.Z., Xiong, Z. (2023). A Study of the compressive behavior of recycled rubber concrete reinforced with hybrid fibers. Materials, 16(13): 4731. https://doi.org/10.3390/ma16134731
[9] Akbulut, Z.F., Guler, S., Yavuz, D., Avcı, M.S. (2025). Toward sustainable construction: A critical review of recycled aggregate concrete properties and future opportunities. Case Studies in Construction Materials, 23: e05133. https://doi.org/10.1016/j.cscm.2025.e05133
[10] He, H.J., Wang, Y.X., Yuan, J., Xu, K., Wang, S.F., Qiao, H.X., Wu, T., Yang, J., Liu, J.D., Yu, J., Wang, B. (2023). A new type of mineral admixture and its impact on the carbonation resistance of EPS concrete. Sustainability, 15(9): 7233. https://doi.org/10.3390/su15097233
[11] Aramburu, A., Calderon-Uriszar-Aldaca, I., Puente, I., Castano-Alvarez, R. (2024). Effects of 3D-printing on the tensile splitting strength of concrete structures. Case Studies in Construction Materials, 20: e03090. https://doi.org/10.1016/j.cscm.2024.e03090
[12] Wang, Z.Q., Chen, M., Liao, Y. (2023). Analysis of fire resistance of prestressed concrete T-beam based on ABAQUS numerical simulation. Applied Sciences, 13(8): 4683. https://doi.org/10.3390/app13084683
[13] Hass, L., Bos, F.P., Salet, T.A.M. (2025). Bond governed interactions between helical reinforcement and 3D printed concrete. Journal of Building Engineering, 99: 111447. https://doi.org/10.1016/j.jobe.2024.111447
[14] Bhirud, Y., Vaidya, O., More, S., Shaikh, A., Pawar, A., Pawar, L., Yeole, P. (2025). Shrinkage behaviour of self-compacting concrete with higher binder content: Experimental results and predictive equation. Discover Materials, 5(3). https://doi.org/10.1007/s43939-025-00184-z
[15] Helal, Z., Salim, H., Ahmad, S.S.E., Elemam, H., Mohamed, A.I.H., Elmahdy, M.A.R. (2024). Sustainable bacteria-based self-healing steel fiber reinforced concrete. Case Studies in Construction Materials, 20: e03389. https://doi.org/10.1016/j.cscm.2024.e03389
[16] Bulut, H.A., Kandil, U. (2025). Investigation of freeze-thaw performance for sustainable rubberized concrete composites with different water to cement ratios. Materiales de Construcción, 75(357): e364. https://doi.org/10.3989/mc.2025.384024
[17] Elinwa, A.U. (2025). Sawdust ash-Conplast admixed concrete: Compressive strength, and acid-sulphate evaluation. Materials Chemistry and Physics, 346: 131394. https://doi.org/10.1016/j.matchemphys.2025.131394
[18] Ćaran, B., Milić, V., Švaco, M., Jerbić, B. (2025). Odometry calibration and pose estimation of a 4WIS4WID mobile wall climbing robot. arXiv preprint arXiv:2509.04016. https://doi.org/10.48550/arXiv.2509.04016
[19] Li, Y., Zhong, R., Yu, J., Song, J., Wang, Q., Chen, C., Li, X., Liu, E. (2025). Uniaxial compressive strength of concrete inversion using machine learning and computational intelligence approach. Results in Engineering, 26: 105627. https://doi.org/10.1016/j.rineng.2025.105627
[20] Chen, Z., Wu, J. (2025). Verification power of rational-valued automata with deterministic and affine states. arXiv preprint arXiv:2509.07857. https://doi.org/10.48550/arXiv.2509.07857
[21] Kanagaraj, B., Kumar, P.D., Angom, V., Samuvel Raj, R., Anand, N., Lubloy, E. (2025). Effect of nano humic acid from agricultural land residue on physical, mechanical and thermal properties of concrete. Progress in Engineering Science, 2(3): 100104. https://doi.org/10.1016/j.pes.2025.100104
[22] Cui, S.N., Wang, T., Zhang, Z.C., Sun, X., Li, J.H., Li, B.X., Zhang, W.S., Su, T., Cao, F.B. (2023). Frost resistance and life prediction of recycled brick aggregate concrete with waste polypropylene fiber. Reviews on Advanced Materials Science, 62(1): 20230154. https://doi.org/10.1515/rams-2023-0154
[23] Fu, C., Li, M. (2024). Frost resistance prediction for rubberized concrete based on artificial neural network. Discover Applied Sciences, 6: 648. https://doi.org/10.1007/s42452-024-06357-4
[24] Mayta Mamani, J.C. (2024). Evaluación de la resistencia del concreto a compresión con diferentes adiciones de material puzolánico de Yura-Arequipa, 2022. Universidad Continental. https://repositorio.continental.edu.pe/handle/20.500.12394/14926.
[25] Hamoda, A., Abadel, A.A., Baktheer, A., Emara, M. (2025). Concentric compressive performance of precast concrete filled steel tube with intermediate construction connection made of high-performance concretes. International Journal of Concrete Structures and Materials, 19: 82. https://doi.org/10.1186/s40069-025-00785-1
[26] Mishra, M., Sobuz, M.H.R., Kabbo, M.K.I., Jameel, M., Alahmari, T.S., Ahmad, N., Khan, M.M.H. (2025). Experimental assessment and data-driven hybrid machine learning quantification with parametric optimization of compressive strength of ceramic waste concrete. Case Studies in Construction Materials, 23: e05043. https://doi.org/10.1016/j.cscm.2025.e05043
[27] Kim, H.K., Lee, J.S., Lee, H.W., Kwon, S.J. (2025). Strength development and neutralization progress in high-performance blended cement concrete exposed to atmospheric, tidal, and submerged sea conditions. International Journal of Concrete Structures and Materials, 19: 40. https://doi.org/10.1186/s40069-025-00788-y
[28] Fernández-Sanjuán, P., Alcaraz, M., Bosco, G., Pérez-Martín, N., et al. (2024). Modifications in upper airway collapsibility during sleep endoscopy with a mandibular positioner: Study in snorers and obstructive sleep apnea patients. Journal of Clinical Medicine, 13(5): 1184. https://economipedia.com/definiciones/coeficiente-de-variacion.html.
[29] Kusbiantoro, A., Kusumawardani, R., Budi Wirawan, A., Arifin, M.F.A., Pengestuti, E.K., Nugroho, U., Azizah, K.P. (2026). Assessment of dynamic properties and finite element model on single-span concrete girder bridge. International Journal of Engineering, 39(3): 727-738. https://doi.org/10.5829/ije.2026.39.03c.13
[30] Cappucci, G.M., Ruffini, V., Barbieri, V., Siligardi, C., Ferrari, A.M. (2022). Life cycle assessment of wheat husk based agro-concrete block. Journal of Cleaner Production, 349: 131437. https://doi.org/10.1016/j.jclepro.2022.131437
[31] Özalp, F., Yilmaz, H.D., Zeytun, S., Akcay, B. (2023). Effects of EAF slag, steel fiber, and polyurea coating on mechanical properties and sulfuric acid resistance of concrete pipes. Journal of Pipeline Systems Engineering and Practice, 14(2). https://doi.org/10.1061/jpsea2.pseng-1280
[32] Li, J.N., Singh, A., Zhao, Y., Sun, J., et al. (2024). Enhancing thermo-mechanical and moisture properties of 3D-printed concrete through recycled ultra-fine waste glass powder. Journal of Cleaner Production, 480: 144121. https://doi.org/10.1016/j.jclepro.2024.144121
[33] Puy-Alquiza, M.J., Miranda-Avilés, R., Miranda Puy, M.Y., Salazar-Hernández, M.C., Moncada Sánchez, C.D. (2025). Adobes recycled with polystyrene: An alternative for the conservation and restoration of monuments and historical sites. Materiales de Construcción, 75(357): e369. https://doi.org/10.3989/mc.2025.386524
[34] Abd, H.J., Ismael, M.A. (2025). Direct shear of self-consolidating concrete and conventional concrete with different coarse aggregate size. Mathematical Modelling and Engineering Problems, 12(1): 133-140. https://doi.org/10.18280/mmep.120115
[35] Schossler, R.T., Ullah, S., Alajlan, Z., Yu, X. (2025). Data-driven analysis in 3D concrete printing: Predicting and optimizing construction mixtures. AI in Civil Engineering, 4(1). https://doi.org/10.1007/s43503-024-00044-4
[36] Ahmed, H.U., Mohammed, A.S., Mohammed, A.A. (2023). Engineering properties of geopolymer concrete composites incorporated recycled plastic aggregates modified with nano-silica. Journal of Building Engineering, 75: 106942. https://doi.org/10.1016/j.jobe.2023.106942
[37] Valencia Saavedra, W.G., Angulo, D.E., Mejía de Gutiérrez, R. (2016). Fly ash slag geopolymer concrete: Resistance to sodium and magnesium sulfate attack. Journal of Materials in Civil Engineering, 28(12). https://doi.org/10.1061/(asce)mt.1943-5533.0001618
[38] Asamenew, Z.M., Cherkos, F.D. (2024). Physio-mechanical and micro-structural properties of cost-effective waste eggshell-based self-healing bacterial concrete. Cleaner Materials, 12: 100246. https://doi.org/10.1016/j.clema.2024.100246
[39] Wang, L., Guo, F.X., Yang, H.M., Wang, Y., Tang, S.W. (2021). Comparison of fly ash, PVA fiber, MgO and shrinkage-reducing admixture on the frost resistance of face slab concrete via pore structural and fractal analysis. Fractals, 29(2): 2140002. https://doi.org/10.1142/s0218348x21400028