Dina H. Shaker*![]() | Raheek I. Ibrahim
| Raheek I. Ibrahim![]() | Manal K. Oudah
| Manal K. Oudah![]() | Hussain H. Al-Kayiem
| Hussain H. Al-Kayiem![]()
© 2025 The authors. This article is published by IIETA and is licensed under the CC BY 4.0 license (http://creativecommons.org/licenses/by/4.0/).
OPEN ACCESS
Crude oil migration in porous media plays a pivotal role in enhancing oil well productivity. This study investigates the effect of high-frequency ultrasound on enhanced oil recovery by improving oil permeability in porous reservoir rocks. A computational fluid dynamics (CFD) simulation using ANSYS Fluent was used to model oil flow under ultrasound-induced conditions. The simulation considered acoustic cavitation effects, including bubble growth and collapse, which led to localized increases in pressure (up to 6.83 MPa) and temperature (up to 80℃), resulting in significant changes in oil viscosity and flow behavior. The results showed that applying ultrasound reduced crude oil viscosity by approximately 48% (from 12.36 to 6.43 Pa·s) and enhanced flow rate by up to 86% at elevated temperatures. Furthermore, the flow rate increased linearly with decreasing pressure, which in turn decreased with increasing temperature due to the decreased viscosity. The study confirmed that the combined effect of increasing pressure and decreasing viscosity through cavitation significantly improves oil mobility in porous media. These results demonstrate the effectiveness of ultrasound as a low-cost and environmentally friendly enhanced oil recovery (EOR) technique, particularly suitable for mature reservoirs with high-viscosity crude oil and low permeability.
acoustic cavitation, acoustic energy, CFD simulation, crude oil, enhanced oil recovery, porous medium, ultrasonic waves, viscosity reduction
Determination of fluid flow in porous media with varying permeability is crucial to various scientific and technical challenges including petroleum engineering, chemistry, microbiology, and soil physics. When an oil reservoir is discovered, the internal pressure is initially high enough to push the crude oil to the surface. However, this pressure decreases over time, leaving more than 60% of the crude oil in the reservoir untapped [1]. To address this, recovery methods such as primary, secondary, and enhanced oil recovery (EOR) techniques are used. Ultrasound represents a highly efficient and eco-friendly unconventional technique for enhancing oil recovery from mature reservoirs [2, 3]. It uses sound energy to create cavities to generate large energy alternatives to other conventional energy sources. Ultrasound waves are produced by piezoelectric transducers and propagate through the medium as acoustic waves, inducing compression that leads to the formation of microcavities. The subsequent expansion, frictional interaction, and collapse of these cavities release substantial energy in the form of localized pressure and heat, which disrupts the molecular bonds within crude oil [4]. However, conventional EOR methods such as thermal, gas, or chemical flooding often face limitations such as high operational costs, environmental concerns, and reduced efficiency in low-permeability formations. These methods can also be less effective in heavy oil reservoirs due to high oil viscosity and poor sweep efficiency. Despite being recognized as effective, existing studies on ultrasound-based EOR often focus on laboratory-scale observations or lack detailed quantitative modeling of how cavitation and thermal effects directly influence fluid flow and reservoir conditions. Recent advancements in computational fluid dynamics (CFD) have enabled high-resolution simulations of multiphase flow in porous media, offering insights that were previously difficult to obtain experimentally. Studies by Chemini et al. [5], Niazi et al. [6], and Madani et al. [7] demonstrated the use of CFD in capturing the dynamics of crude oil and acoustic interactions in porous structures. However, most prior models either simplified acoustic effects or overlooked how ultrasound-induced pressure and temperature fields alter permeability and flow behavior at pore-scale levels. Therefore, the specific research gap addressed in this study is the lack of integrated CFD modeling that captures the coupled effects of acoustic cavitation, temperature rise, and viscosity reduction on crude oil flow in porous media. This study aims to bridge that gap by simulating the ultrasound-enhanced EOR process with a focus on cavitation bubble dynamics, flow enhancement, and pressure distribution. To implement this process, it is necessary to understand the parameters and how they can be manipulated to improve this recovery [8]. Therefore, in order to understand this phenomenon, in the present work we seek to study the flow of crude oil in a porous medium, which represents the oil reservoir. CFD is used to solve the transport equations on a small scale; in this way, detailed models for experimental investigation can be obtained. The main problem with CFD simulation is its computational cost; in fact, it is time-consuming and cannot be easily used in large-scale optimization workflows, multi-scale modeling, or direct control. The datasets generated by CFD simulation can be used to predict fluid dynamics properties and performance [9, 10]. There are several studies that have addressed the use of CFD in studying the flow of crude oil inside oil pipelines. Banerjee et al. [11], studied crude oil flow in horizontal pipes using ANSYS to predict required flow velocity and pressure drop. CFD analysis was employed to reduce experimental costs, involving stainless steel pipes with internal diameters of 1, 1.5, and 2 inches. A velocity gradient from the wall to the center was observed, indicating variation across fluid layers. The CFD results showed strong agreement with experimental data, with a deviation of less than 5%, confirming the method’s accuracy in predicting flow behavior in horizontal pipes. In the study conducted by Alhajri and Alajmi [12], porous flow was analyzed using CFD via ANSYS to evaluate the impact of different porous media on heat exchanger performance. The results demonstrated a clear potential for enhancing heat transfer efficiency by incorporating porous materials. Key parameters such as pressure, velocity, and wall shear stress were examined. The pressure drops along the porous medium was attributed to flow resistance near the walls, leading to reduced fluid velocity and force. Additionally, increasing pore density resulted in lower pressure and velocity, as the pores impeded fluid motion, causing momentum loss and decreased flow speed. According to the study of Nemati et al. [13], a novel method was employed to evaluate buckling in porous media through pore network modeling. A 3D pore network was constructed, incorporating a specific algorithm to randomly connect adjacent pores. Then, the fluid flow inside the porous media was simulated, and the pressure distribution inside it was studied. The results confirmed that the random approach enables the estimation of buckling along effective flow paths without the need to define the complete path explicitly. Path probabilities were determined based on fluid flow rates. Additionally, the influence of various parameters such as the number of iterations, network size, pore count, pore radius distribution, and pore geometry on the buckling behavior of sandstone was thoroughly analyzed. The study of Ahmadi et al. [14] aimed to experimentally verify the efficiency of using water flooding to recover oil from oil wells by using accurate glass models saturated with viscous oil and containing layers of different permeability. This experiment was simulated using CFD to predict flow rates within porous media in order to reduce the time, effort, and high cost of this type of experiment. Chemini et al. [5] focused on understanding fluid flow in porous media, which is important in many industrial, petroleum and environmental applications. Using ANSYS Fluent software, it relied on two-dimensional computational dynamic modeling of single-phase flow in steady state and unsteady oil-water flows. The effects of temperature, permeability, velocity and pressure on the flow inside porous media were studied, as well as the total pressure distribution in porous media. In addition, a study was conducted on the pressure gradient and the effect of permeability on the penetration time of recoverable oil. The study gave a clear idea of the most important results that can be obtained practically and in a short time. This study proved that the flow inside homogeneous porous media is linear and independent of other parameters. The study also showed that the average flow in porous media increases with increasing temperature when porosity and permeability are constant. Niazi [15] studied the effect of using water with crude oil when transporting oil in oil pipelines using three-dimensional and two-phase computational fluid dynamic simulation. He expressed crude oil pipelines with real dimensions and, through the program, analyzed the pressure and volume fraction of the stages of transporting crude oil and water. Thus, he verified that using water reduces the energy consumption used by 50%. In the study conducted by Wang et al. [16], the movement of particles in porous media across various oil field units was analyzed using CFD-DEM simulation. The study examined how particle flow affects pressure and porosity. A decrease in porosity was found to cause particle blockage and sedimentation, while increased porosity extended particle paths and allowed for smoother exit through microchannels. Simulation results showed that higher porosity reduces particle residence time, which then increases with rising particle temperature. Additionally, lower particle velocity and temperature were associated with increased fluid viscosity. Madani et al. [7] studied the use of CFD in estimating the permeability and porosity of oil and gas reservoirs, as this issue poses a challenge in tight formations that sometimes cause little or no transmission in oil reservoirs. To address this, several methods were proposed, including the pore pressure fluctuation method. This technique was simulated using CFD, and the results showed that the analytical data of the simulation agreed excellently with the practical analytical results, which confirms the effectiveness of this method and the accuracy of its results. Niazi et al. [6] studied the acoustic pressure distribution by numerically solving the equation of propagation of sound wave energy in a sonic reactor to improve crude oil production. Through the study, the active cavitation regions where the bubbles generated by sound waves grow and the way they collapse inside the oil were determined by calculating the amount of negative pressure required for the growth and collapse of the cavities. Computational fluid dynamics simulations of cavity formation within saturated crude oil at 25℃ revealed that bubble collapse can generate localized pressures up to 3000 atmospheres and temperatures reaching approximately 3200 K.
Accordingly, it can be concluded that these huge amounts of generated energy can be applied to obtain the required changes in the properties of crude oil and thus upgrade the crude oil. An urgent mitigation of the emergence of many old oil wells whose production has become weak and uneconomical due to the high viscosity of the oil and the poor permeability of the oil well rocks. Attempts have been performed and reported to enhance the oil recovery by various techniques. They addressed the flow of crude oil in porous media and pipelines and examined the effect of changing the inlet velocity and temperature of crude oil on the flow behavior in the porous media. The objective of the current study is to investigate the possibility of mitigating the high oil viscosity and low productivity by ultrasound approach to improve the oil permeability. The research methodology was mainly carried out by CFD simulation by ANSYS commercial software. The effect of ultrasound on the flow behavior of crude oil in porous media was achieved by investigating the dynamics of acoustic cavitation bubble formation inside the crude oil. It is hypothesized that the growth of cavitation bubbles would raise the temperature and pressure inside the crude oil leading to enhancement in oil flow inside porous media. The pressure gradient and the amount of crude oil flow inside the porous media have been determined.
2.1 Materials
2.1.1 Crude oil
The crude oil used in the experiment was supplied from Al- Daura Refinery/Baghdad, Iraq. Table 1 shows the physical properties of the crude oil used.
2.1.2 Porous media
The current study also used the properties of oil reservoir rocks from the Iraqi oil fields (Rumaila) in Basra Governorate/Iraq, specifically from the production layer (Mishrif). Table 2 summarizes the main physical properties of the stone used.
Table 1. Physical properties of crude oil
|
Properties of Crude Oil |
|
|
Sample name |
PL |
|
A.P.I.Gr.@ Orbs. Temp |
28.8 |
|
Temp. (℃) |
68 |
|
J.P.E.G. @ 60℃ |
28.3 |
|
Density @ Obs. Temp. |
0.8816 |
|
Temp. (℃) |
20 |
|
Density@15℃ (kg/m3) |
885.1 |
|
Viscosity at 40℃ (Pa·s) |
12.36 |
|
Viscosity at 80℃ (Pa·s) |
6.43 |
Table 2. Physical properties of a core plug sample obtained from the Iraqi Ministry of Oil
|
Well Name |
Formation Name |
Core Type |
Depth (m) |
Bulk Volume (cm3) |
Porosity (%) |
Permeability (m2) |
|
R-163 |
Mishrif |
Sand stone |
2385.86 |
72.45 |
34.311 |
52.3 × 10⁻¹⁶ |
2.2 Numerical procedure
2.2.1 Geometry generation
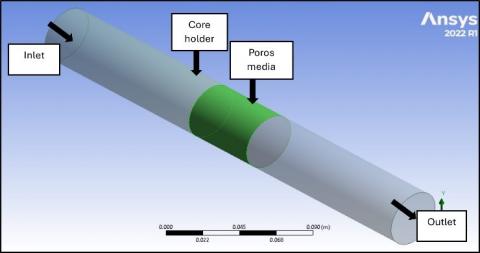
To simulate the plug holder, the researchers employed a three-dimensional numerical simulation with a horizontal metal pipe of 20 cm in length and 3.81 cm in diameter. As shown in Figure 1, this pipe contained a porous media replicating the rocks in an oil well, with dimensions of 5 cm in length and 3.81 cm in diameter. The study concentrated on examining the flow of crude oil through the porous media.
Figure 1. The computational model with geometries
2.2.2 Mesh generation
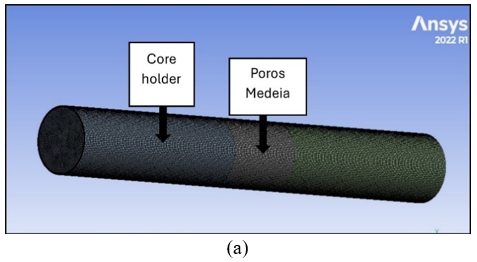
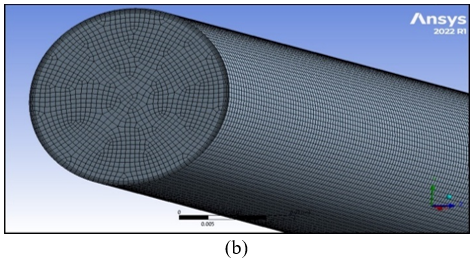
The rock carrier and porous medium were divided into hexagonal cells of a certain size, which are more accurate for studying fluid flow inside cylindrical shapes, as shown in Figure 2(a). A finer mesh design is needed to improve performance, especially in regions with large fluctuations in flow. Although finer meshes require more processing power and time, A mesh independence study was essential and was carried out by performing multiple simulations using varying mesh resolutions, starting with a coarse mesh and progressively refining it until further refinement had no significant impact on the simulation results [17]. Through this process, the optimal global mesh size was identified, resulting in a maximum cell dimension of approximately 180 μm within the core region of the model. To accurately capture the steep gradient variations typically present near the wall caused by the no-slip boundary condition inflation layers were incorporated adjacent to the wall, as illustrated in Figure 2(b). This leads to a more accurate prediction of the flow in this region [18]. Five inflation layers were created, covering about 20% of the model radius.
Figure 2. 3D meshing elements for tube and Poros media
Figure 3 shows the mesh-independent curve used to find the appropriate number of elements and nodes for the CFD simulation. For this purpose, six different meshes were created to determine the number of nodes and elements that would give the most accurate results. Therefore, the appropriate number of nodes was 495075 and elements 481458. The number of elements was increased along the cylinder walls to provide more accurate results. It can be seen that the accuracy of the fluid dynamics simulation depends largely on the quality of the mesh. There are several parameters that determine the quality of the mesh, including skewness, which in the current study was 0.9; smoothness was medium in this study; and the cell growth rate was 1.2 from the outer perimeter towards the center of the cylinder.
Figure 3. The max. pressure of all the investigated meshes in mesh independence study
2.2.3 Governing equations
This paper used the Eulerian approach in ANSYS/Fluent to model multiple distinct and interacting phases. It was used to model the flow of crude oil within a porous medium that represents a typical oil field rock. This approach models the fluid flow by solving Darcy’s law and Navier-Stokes equation [19, 20]. This paper presents the investigation of the relationships between Darcy's law (at the macroscopic level) and the Navier-Stokes equations (at the microscopic level) applied to the actual complex pore geometry of rocks with different porosities [21]. The propagation of ultrasound waves in porous media was represented using 3D numerical simulation.
Numerical simulation: The ultrasound equation can be used to describe how waves propagate through a physical medium. The acoustic wave equation describes sound pressure as a function of space and time [22]. The propagation of the wave is linear, and shear stress is neglected. The sound wave equation can be expressed as flowing equation:
$\left(\frac{1}{\rho} \nabla p\right)-\frac{1}{\rho c^2} \frac{\partial^2 p}{\partial t^2}=0$ (1)
where, c represents sound speed. Eq. (1) applies in the time harmonic situation $\left(P(r, t)=p(r) e.^{i \omega t}\right)$ [23]. It takes the following form:
$\left(\frac{1}{\rho} \nabla p\right)-\frac{\omega^2}{\rho c^2} p=0$ (2)
where, $\omega=2 \pi f$ is the angular frequency. The acoustic pressure distribution in the computational domain is determined by numerically solving the Helmholtz Eq. (2). Where Eq. (2) states that a change in temperature causes a change in the speed of sound in the fluid (c), which leads to a change in the acoustic pressure distribution across the porous medium.
Darcy’s Law: Darcy established that the flow rate (volume/unit time) is directly proportional to the cross-sectional area of the porous medium and to the pressure head difference. $\Delta h=\left(h_1-h_2\right)$ across a length $L$, and inversely proportional to the length $L$. The ratio $\Delta h / L$ is defined as the hydraulic gradient i. and accordingly, Darcy’s law can be expressed as shown in Eq. (3) [21]:
$v=\frac{Q}{A}=-k\left(\frac{h 1-h 2}{L}\right)=-k \cdot i$ (3)
In this context, v represents the flow velocity and k denotes the hydraulic conductivity. Darcy’s law is applicable under laminar flow conditions, typically associated with low Reynolds numbers ($R_e$) [24]:
$R_e=\frac{v d_e}{\mu}$ (4)
Here, $d_e$ denotes the effective pore diameter, and μ represents the kinematic viscosity of the oil. This derived relation can be extended to 3D porous media, as illustrated in Eq. (5) [21]:
$\mathrm{V}=-k \cdot \nabla h$ (5)
where, V is the effective velocity, and ∇h is the hydraulic gradient. Let z be the evaluation head with respect to fixed reference datum, P is the pressure, ρ is the fluid density and g is the acceleration due to gravity therefore the total head can be as following:
$h \approx \frac{P}{\rho g}+\nabla z$ (6)
Therefore, Eq. (1) can be reformulated in term of evaluation z of fluid pressure P:
$V=-k\left(\frac{\nabla P}{\rho g}+\Delta z\right)=-\frac{K}{\mu}(\Delta P+\rho g \nabla z)$ (7)
where, $\mu$ denotes the dynamic viscosity of the fluid, while K represents the intrinsic permeability of the porous medium, which is related to the hydraulic conductivity as $K=k \cdot \mu /(\rho \cdot g)$.
Navier-Stokes Equation: Darcy's formulas can be derived more fundamentally from the physical equations at a very averaging the Navier-Stokes equations for fluid flow at constant density [25, 26]. Assuming constant fluid temperature and density, and that the porous medium governs pressure in the flow field, the Navier-Stokes equation for reverse flow at a pore location is [21]:
$\rho \frac{\partial v_s}{\partial t}+\rho\left(V \cdot \nabla v_s\right)+\frac{\partial P}{\partial s}-R_s=-\rho g \frac{\partial z}{\partial s}$ (8)
where, $v_s$ is the velocity of fluid in s- direction, $R_s$ is the force resistance to the motion of fluid inside the pore.
The resistance $R_s$ value shown in Eq. (9) [21] can be expressed as the drag force of the fluid molecules within the porous medium, as it is proportional to the average velocity (mass). This force usually acts in the direction opposite to the applied speed.
$R_s=-\left(\frac{\mu}{c}\right) v$ (9)
where, C is the conductance of pore. When the force $R_s$ is much greater than the acceleration of the load, the Navier-Stokes equation can be expressed as [21]:
$\rho \frac{\partial v_s}{\partial t}+\frac{\mu}{C} v_s=-\rho g \frac{\partial z}{\partial s}-\frac{\partial P}{\partial s}$ (10)
By multiplying Eq. (8) by $(C \cdot d \sigma / d s)$, where σ is the local coordinate of a particular streamline then Eq. (10) car be rewritten as flow [21]:
$C \rho \frac{\partial v}{\partial t}+\mu v=-C\left(\frac{\partial P}{\partial s}+\rho g \frac{\partial z}{\partial s}\right) \frac{\partial \sigma}{\partial s}$ (11)
The average governing equation for laminar flow in porous media is derived by averaging the volume as per Eq. (11) and applying a coordinate transformation along the fixed x, y, and z directions, resulting in the following equation [21]:
$\bar{v}_{\imath}+\bar{C} \frac{\rho}{\mu} \frac{\partial \bar{v}_{\imath}}{\partial t}=-\frac{K_{i j}}{n \mu}\left(\frac{\partial \bar{P}}{\partial x_i}+\rho g \frac{\partial z}{\partial x_i}\right)$ (12)
The overbar denotes averaged variables, n represents the porosity, and Kij is the permeability tensor derived from the average conductance of pores projected onto the global x, y, and z directions. The second term on the left-hand side of Eq. (12) corresponds to local accelerations, which can be neglected due to the typically low Reynolds numbers in porous media. The effective (Darcy) velocity is obtained by multiplying Eq. (12) by the porosity n. Consequently, the Navier-Stokes equations can be expressed as follows [21]:
$v=-\frac{K_{i j}}{\mu}\left(\frac{\partial \bar{P}}{\partial x_j}+\rho g \frac{\partial z}{\partial x_j}\right)$ (13)
Table 3. The boundary conditions utilized in the present study
|
Item |
Boundary Conditions |
|
Crude oil velocity inlet |
v1 = 1 × 10⁻⁵ m/s; v2 = 3 × 10⁻⁵ m/s v3 = 5 × 10⁻⁵ m/s; v4 = 7 × 10⁻⁵ m/s |
|
Temperature |
40 and 80℃ |
|
Pipe wall |
non-slip wall |
2.2.4 Boundary conditions
The physical flow specifications of the fluid used, the models, boundary conditions, and initial flow conditions were determined based on the first thinking stage [27]. Table 3 shows the boundary conditions for this research.
2.2.5 Simulation procedure
Using ANSYS Fluent 2022, the finite volume method was implemented to partition the differential equations of single-phase flow and velocity into the computational domain. To calculate the pressure field and crude oil flow inside the porous medium, the coupled algorithm was used to couple the pressure and velocity equations. Contour plots and computational equations were applied to arrive at the desired results. The numerical simulation was run using an Intel® Core i9 (16 GHz) CPU and 1 TB SSD; the results converged after 500 iterations and the running time was about 1 hour.
The most important results obtained using the simulation method can be summarized as the distribution of pressure and velocity and the determination of crude oil flow within the porous medium. They can be explained in detail as follows:
3.1 Pressure behavior in porous medium
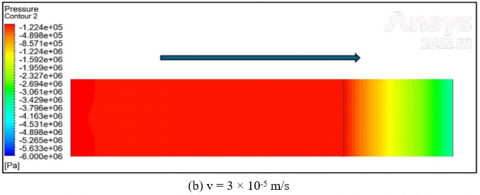
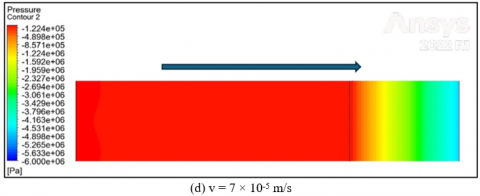
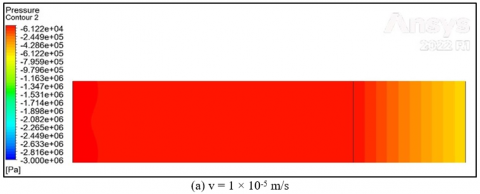
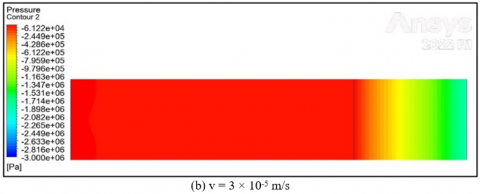
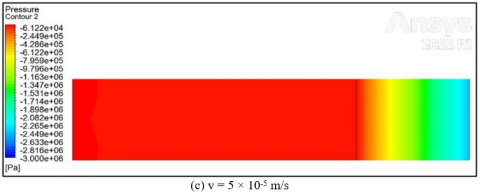
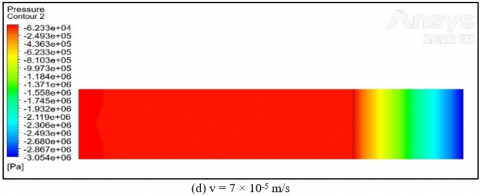
Figure 4 presents the pressure contour distributions inside the porous medium at a constant temperature of 40°C for four different crude oil inlet velocities (1 × 10⁻⁵, 3 × 10⁻⁵, 5 × 10⁻⁵, and 7 × 10⁻⁵ m/s). The pressure ranges from approximately 9.76 × 10⁵ Pa near the outlet (blue zones) to 6.83 × 10⁶ Pa near the inlet (red zones). The color gradient clearly reflects the pressure drop occurring due to flow resistance across the homogeneous porous structure. As velocity increases, the pressure gradient becomes steeper, indicating more rapid saturation of the porous medium.
Figure 4. Pressure contour distributions within the porous medium at a temperature of 80℃ for various crude oil inlet velocities 40℃
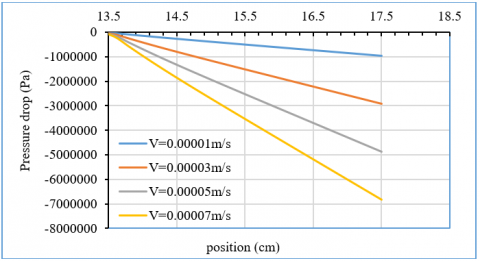
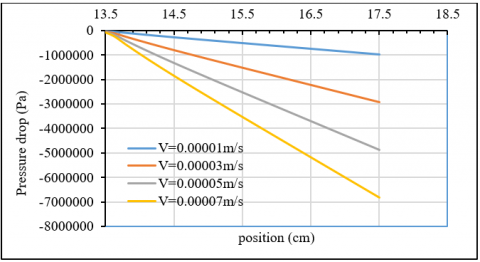
Figure 5. Pressure drop in props media with different inlet velocity at temperature 40℃
Figure 5 shows the corresponding axial pressure patterns along the porous medium for each inlet velocity at 40°C. The x-axis represents the longitudinal position within the porous region (13.5 to 18.5 cm), while the y-axis shows the pressure in Pascals. We observe that the pressure decreases at a quasi-constant rate as the crude oil injection velocity into the porous medium changes. The pressure drop within the porous medium is greatest at the high injection velocity of 7 × 10⁻⁵ m/s, reaching 6.83 × 10⁻⁵ Pa, while the pressure drop is lowest at the lowest crude oil injection velocity of 1 × 10⁻⁵ m/s, reaching 9.76 × 10⁻⁵ Pa. This is due to the faster saturation of the sample with crude oil at high velocities compared to low velocities. It can be concluded that the pressure drop is approximately linear, with the rate of pressure drop increasing with increasing flow rates.
When the temperature is raised to 80℃, as shown in Figure 6, the overall pressure values decrease for all inlet velocities compared to the 40℃ condition. This is attributed to the decrease in crude oil viscosity at higher temperatures, which facilitates fluid movement through the pores. The pressure ranges from 5.08 × 10⁵ Pa to 3.55 × 10⁶ Pa at 80℃, noticeably lower than those observed at 40℃ for the same velocities. These results were consistent with the results of Chemini et al. [5] and Gauna and Zhao [28].
Figure 6. Pressure contour distributions within the porous medium at a temperature of 80℃ for various crude oil inlet velocities
The pressure decreases linearly inside the porous medium at a temperature of 80℃, as shown in Figure 7, more than it does at a temperature of 40℃. The pressure drops inside the porous medium at the highest speed 7 × 10⁻⁵ m/s reaches 3.5547 × 10⁶ Pa, and the pressure drop value at the lowest crude oil injection speed 1 × 10⁻⁵ m/s is 5.078 × 10⁵ Pa. This is due to the viscosity and density of the crude oil at high temperatures, so the sample is saturated with crude oil faster at high speeds compared to low speeds. According to Darcy’s law, at constant velocity and permeability, the pressure gradient is proportional to the viscosity. These results were consistent with the results of Chemini et al. [5] and Gauna and Zhao [28].
Figure 7. Pressure drop in the porous medium at a temperature of 80℃ for different inlet velocities
3.2 The flow rate of crude oil in porous media
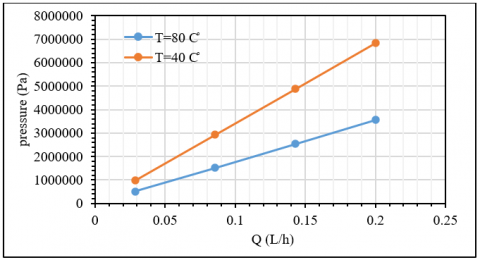
The flow rate of crude oil and the pressure drop inside the porous medium were studied at different temperatures of 40 and 80℃ and constant porosity and permeability values of the porous medium. As shown in Figure 8, the flow rate of crude oil increases linearly with the pressure drop inside the porous medium at constant temperature and porosity of the sample. The flow rate of crude oil is low at low pressure and increases with increasing pressure applied to the sample. The reason is that the permeability of the porous medium is directly proportional to the inlet oil pressure and inversely proportional to its viscosity. This explains the low flow of crude oil in old oil wells due to the large drop in pressure level in these reservoirs in addition to the high viscosity of crude oil in them. When comparing pressure values at different temperatures, we notice that the amount of pressure required to flow the same amount of crude oil into the porous medium is less at a temperature of 80℃ than at a temperature of 40℃ due to the decrease in the viscosity of the crude oil when the temperature is raised, which facilitates its flow into the porous medium. From here, it was concluded that the method of oil recovery using ultrasound waves is an effective method for stimulating low-production and old oil wells because it works to increase the pressure by generating cavities whose growth and explosion inside the reservoir raises the pressure and temperature of the oil reservoir. In addition, this method is environmentally friendly and has low economic cost. These results were consistent with the results of Chemini et al. [5] and Gauna and Zhao [28].
Figure 8. Relation between pressure and flow rate in Poros media
3.3 Cavitation-induced pressure and temperature effects
To better understand the role of cavitation in enhancing oil flow, previous CFD studies have shown that cavitation bubble collapse can produce local pressure spikes up to 3000 atm and temperatures exceeding 3200 K in crude oil systems [6]. While our model does not explicitly resolve individual bubble dynamics, the acoustic energy input used in our simulations corresponds to conditions that favor active cavitation. These extreme localized conditions can significantly reduce crude oil viscosity and alter rock-fluid interactions, leading to the observed increase in flow rate and decrease in pressure drop.
Future extensions of this study may include a multiphase model capable of simulating bubble nucleation, growth, and collapse to more precisely quantify the cavitation contribution to flow enhancement.
This study employed CFD simulations to investigate crude oil flow through porous media under the influence of ultrasonic waves. By incorporating the effects of acoustic cavitation, the research aimed to enhance oil recovery in low-productivity reservoirs by improving permeability and oil mobility.
The simulation results led to several key conclusions:
Pressure behavior: Pressure drop across the porous medium increased linearly with inlet velocity, regardless of temperature, reaching up to 6.83 × 10⁶ Pa at the highest velocity. This trend is consistent with Darcy’s law and highlights velocity as a primary factor in pressure loss.
Temperature effect: Raising the temperature from 40℃ to 80℃ significantly reduced crude oil viscosity, leading to a pressure drop reduction of up to 50%. This underscores the value of thermal stimulation in enhancing flow efficiency.
Flow rate response: Crude oil flow rate increased proportionally with the pressure gradient, particularly at higher temperatures. At 80℃, less pressure was needed to maintain the same flow rate as at 40℃, indicating improved energy efficiency.
Ultrasound effectiveness: Ultrasonic waves enhanced both temperature and pressure within the reservoir via cavitation, improving crude oil mobility. The method is environmentally friendly and potentially cost-effective, especially in aging reservoirs where conventional techniques are less efficient.
Model validation: Although micro-scale cavitation was not explicitly simulated, its influence was accounted for through appropriate boundary conditions. The simulation results matched general trends observed in prior studies, offering qualitative validation of the model’s accuracy.
Broader implications and future work: The findings suggest that ultrasound-assisted oil recovery is a promising alternative to traditional methods, particularly in formations with high viscosity and low permeability. Future work should include laboratory experiments and consider integrating ultrasound with other EOR methods.
Environmental and economic impact: Ultrasound-assisted EOR can lower CO₂ emissions and energy consumption—potentially by up to 35%—compared to conventional techniques such as steam injection, offering a more sustainable and economical solution for difficult reservoirs.
In summary, ultrasound-assisted oil recovery shows strong potential for improving production in challenging reservoir conditions and warrants further experimental and field-scale validation.
I would like to thank the Department of Electromechanical Engineering at the University of Technology and the Iraqi Ministry of Oil for their assistance in completing this research.
|
A |
Cross-sectional area of the porous medium, m2 |
|
c |
Speed of sound, m/s |
|
de |
The effective pore diameter |
|
g |
The acceleration due to gravity, m/s2 |
|
h |
The total head, m |
|
k |
The hydraulic conductivity, m/s |
|
K |
The intrinsic permeability of porous media, mD |
|
L |
The length of Poros media, m |
|
P |
The pressure of fluid, bar |
|
Q |
The flow rate, volume/unit time |
|
Re |
Reynolds numbers |
|
t |
Time, s |
|
v |
The flow velocity, m/s |
|
V |
The effective velocity, m/s |
|
vs |
The velocity of fluid in s- direction, m/s |
|
z |
The evaluation head with respect to fixed reference datum |
|
Δh |
Proportional to the difference in oil height across a length |
|
∇h |
The hydraulic gradient, m |
|
Greek symbols |
|
|
ρ |
Density of the liquid, kg/m3 |
|
ω |
Angular velocity, rad/s |
|
μ |
kinematic viscosity, pa·s |
|
σ |
The local coordinate of a particular streamline |
[1] Shafiai, S.H., Gohari, A. (2020). Conventional and electrical EOR review: The development trend of ultrasonic application in EOR. Journal of Petroleum Exploration and Production Technology, 10: 2923-2945. https://doi.org/10.1007/s13202-020-00929-x
[2] Khan, M., Islam, M. (2007). Enhanced Oil Recovery (EOR) operations. In The Petroleum Engineering Handbook: Sustainable Operations. Elsevier, pp. 243-293. https://doi.org/10.1016/B978-1-933762-12-8.50014-3
[3] Saleh, S.N., Mohammed, T.J., Hassan, H.K., Barghi, S. (2021). CFD investigation on characteristics of heavy crude oil flow through a horizontal pipe. Egyptian Journal of Petroleum, 30(3): 13-19. https://doi.org/10.1016/j.ejpe.2021.06.003
[4] Li, X., Zheng, L., Li, G., Pu, J., Zhang, T., Huang, F. (2024). Enhanced oil recovery in tight reservoirs by ultrasonic-assisted CO2 flooding: Experimental study and molecular dynamics simulation. Fuel, 378: 132889. https://doi.org/10.1016/j.fuel.2024.132889
[5] Chemini, R., Aksouh, M., Lemouari, B., Djibo, S.A. (2018). CFD Modeling and simulation of oil-water flows in oil reservoir. In the 2nd National Conference on Computational Fluid Dynamics & Technology.
[6] Niazi, S., Hashemabadi, S.H., Razi, M.M. (2014). CFD simulation of acoustic cavitation in a crude oil upgrading sonoreactor and prediction of collapse temperature and pressure of a cavitation bubble. Chemical Engineering Research and Design, 92(1): 166-173. https://doi.org/10.1016/j.cherd.2013.07.002
[7] Madani, S.A., Mokhtari, M., Seibi, A. (2016). CFD simulation of pore pressure oscillation method for the measurement of permeability in tight porous-media. In Proceedings of the 2016 COMSOL Conference in Boston.
[8] Wang, Z., Fang, R., Guo, H. (2020). Advances in ultrasonic production units for enhanced oil recovery in China. Ultrasonics Sonochemistry, 60: 104791. https://doi.org/10.1016/j.ultsonch.2019.104791
[9] Smith, J.D., Neto, A.A., Cremaschi, S., Crunkleton, D.W. (2013). CFD-based optimization of a flooded bed algae bioreactor. Industrial & Engineering Chemistry Research, 52(22): 7181-7188. https://doi.org/10.1021/ie302478d
[10] Meriem-Benziane, M., Bou-Saïd, B., Abdelkader, B. (2021). A CFD modeling of oil-water flow in pipeline: Interaction analysis and identification of boundary separation. Petroleum Research, 6(2): 172-177. https://doi.org/10.1016/j.ptlrs.2020.10.004
[11] Banerjee, S., Banik, A., Rajak, V.K., Bandyopadhyay, T.K., Nayak, J., Jasinski, M., Kumar, R., Jeon, B.-H., Siddiqui, M.R., Khan, M.A. (2024). Two-phase crude oil–water flow through different pipes: An experimental investigation coupled with computational fluid dynamics approach. ACS Omega, 9(10): 11181-11193. https://doi.org/10.1021/acsomega.3c05290
[12] Alhajri, S.M., Alajmi, E.F.E. (2021). Flow analysis through porous media with deterministic distributions using computational fluid dynamics (CFD) method. International Journal of Innovative Science and Research Technology, 6(7): 1650-1659.
[13] Nemati, R., Shahrouzi, J.R., Alizadeh, R. (2020). A stochastic approach for predicting tortuosity in porous media via pore network modeling. Computers and Geotechnics, 120: 103406. https://doi.org/10.1016/j.compgeo.2019.103406
[14] Ahmadi, P., Ghandi, E., Riazi, M., Malayeri, M.R. (2019). Experimental and CFD studies on determination of injection and production wells location considering reservoir heterogeneity and capillary number. Oil & Gas Science and Technology–Revue d’IFP Energies nouvelles, 74: 14. https://doi.org/10.2516/ogst/2018078
[15] Niazi, S. (2018). CFD simulation of a crude oil transport pipeline: Effect of water. Petroleum & Petrochemical Engineering Journal (PPEJ), 2(6): 000167.
[16] Wang, S., Li, H., Wang, R., Tian, R., Sun, Q., Ma, Y. (2018). Numerical simulation of flow behavior of particles in a porous media based on CFD-DEM. Journal of Petroleum Science and Engineering, 171: 140-152. https://doi.org/10.1016/j.petrol.2018.07.039
[17] Eesa, M. (2009). CFD studies of complex fluid flows in pipes. PhD Thesis, University of Birmingham.
[18] Lintermann, A. (2020). Computational meshing for CFD simulations. In Clinical and Biomedical Engineering in the Human Nose: A Computational Fluid Dynamics Approach, pp. 85-115. Springer, Singapore. https://doi.org/10.1007/978-981-15-6716-2_6
[19] Khalil, I., Lakkis, I. (2023). Computational Fluid Dynamics: An Introduction to Modeling and Applications. McGraw Hill.
[20] Andersson, B., Andersson, R., Håkansson, L., Mortensen, M., Sudiyo, R., Van Wachem, B. (2011). Computational Fluid Dynamics for Engineers. Cambridge University Press.
[21] Narsilio, G.A., Buzzi, O., Fityus, S., Yun, T.S., Smith, D.W. (2009). Upscaling of Navier–Stokes equations in porous media: Theoretical, numerical and experimental approach. Computers and Geotechnics, 36(7): 1200-1206. https://doi.org/10.1016/j.compgeo.2009.05.006
[22] Kim, H.J., Chi, M.H., Hong, I.K. (2009). Effect of ultrasound irradiation on solvent extraction process. Journal of Industrial and Engineering Chemistry, 15(6): 919-928. https://doi.org/10.1016/j.jiec.2009.09.025
[23] Niazi, S., Hashemabadi, S., Noroozi, S. (2014). Numerical simulation of operational parameters and sonoreactor configurations for the highest possibility of acoustic cavitation in crude oil. Chemical Engineering Communications, 201(10): 1340-1359. https://doi.org/10.1080/00986445.2013.808999
[24] Uruba, V. (2019). Reynolds number in laminar flows and in turbulence. AIP Conference Proceedings, 2118: 020003. https://doi.org/10.1063/1.5114728
[25] Bear, J. (2013). Dynamics of Fluids in Porous Media. Courier Corporation.
[26] Chen, X., Jin, L., Zhang, X. (2014). Slip flow and heat transfer of magnetic fluids in micro porous media using a lattice Boltzmann method. Open Access Library Journal, 1(9): 1-17. https://doi.org/10.4236/oalib.1101165
[27] Shaw, C. (1992). Using Computational Fluid Dynamics. Prentice Hall.
[28] Gauna, E.A., Zhao, Y. (2017). Numerical simulation of heat transfer in porous metals for cooling applications. Metallurgical and Materials Transactions B, 48: 1925-1932. https://doi.org/10.1007/s11663-017-0981-1