Md. Jashim Uddin
© 2025 The author. This article is published by IIETA and is licensed under the CC BY 4.0 license (http://creativecommons.org/licenses/by/4.0/).
OPEN ACCESS
The current study presents a computational fluid dynamics (CFD) technique with COMSOL Multiphysics software 5.2 through satisfactory validation of the method. In this research, a pulsatile flow through a stenotic common carotid artery is numerically investigated with the goal of assessing the impact of stenosis morphology, pulse rate and stenosis severity on hemodynamic parameters. The results indicate that the oscillatory shear index (OSI) is the most important factor in the advancement of atherosclerosis as it measures the varying characteristics of blood flow close to the arterial wall, potentially encouraging plaque formation. The investigation confirms that OSI-based peak distance strongly depends on the pulse rate, stenosis severity and rheological characteristics of blood. Results also show that the mean and maximum OSI increase as the increases of stenosis severity. This study further explores the impact of the pulse rate on OSI and shows that the oscillatory reattachment point is decreased with the increase of pulse rates. It is further notably that the mean OSI increases proportionally with the pulse rates, while the max OSI values are identical due to the effects of pulse rates through rheological models. The current findings indicate a lower risk of thrombogenesis at the post-stenotic zone and show a larger oscillatory peak distance (OPD) in the Newtonian model compared to the rheological models. Findings also reveal that the OSI-based peak distance increases with an increase in stenosis severity. Finally, for the pulse rate of 130 bpm (beats per minute), the OPD decreases by 5.66, 9.03 and 12.16% for 110, 90 and 70 bpm, respectively.
computational fluid dynamics (CFD), pulsatile flow, stenosis severity, oscillatory shear index, pulse rate, stenosis morphology, non-Newtonian, hemodynamics
One of the most common human disorders worldwide is arterial stenosis, which is characterized by abnormal growths in the artery wall’s lumen that appear at various points throughout the cardiovascular system. The cholesterol deposits on the wall of the artery and connective tissue expansion in the wall build plaques that spread inward and obstruct the blood flow. The unique draw, in this case, is stenosis, which is the shape that typically disrupts the blood flow to a partial obstruction in the artery as a result of atherosclerotic progression [1]. Hemodynamics in arterial blockage, evaluated by the nature of pulsatile flow, the physical characteristics of blood and the structure of the plaque and vessel, has been mimicked and discussed experimentally. Specifically, Ahmed and Giddens [2] have used laser Doppler anemometry to observe the pulsatile flow at the post-stenotic zone for a range of Reynolds values. Numerous findings have contributed to a better knowledge of the flow abnormalities caused by the artery’s constriction, which is connected to numerous theoretical and experimental efforts. A thorough model of pulsatile hemodynamics in the carotid artery, including both normal and stenosis-affected conditions, has been presented by Kaid et al. [3]. This study examines how flow disturbance and stagnation points are affected by hemodynamic parameters like Womersley number, arterial geometry, and Reynolds number. A Doppler ultrasonic velocimeter has been used by Deplano and Siouffi [4] to computationally study a stenosis model. Particularly at the post-stenotic location, they have observed that the field of velocity is highly reliant on the flow waveform.
Ojha et al. [5] have used photochromic tracer techniques to obtain the velocity profiles of pulsatile flow of the stenosis tubes of mild to moderate. Tang et al. [6] have used fluid-wall interaction to experimentally study blood flow via a carotid artery. According to their observations of the non-linear connection between stress and strain, the site of stenosis exhibits both the greatest compressive and tensile stress, and the stress distribution has a significant localized mode. The blood flow dynamics of carotid artery bifurcations that are stenosed and stented have been numerically simulated using computational fluid dynamics (CFD) analysis [7]. Observations of the transitional flow in the post-stenotic area reveal that the pressure and velocity profiles oscillate immediately downstream of the stenosis. According to Buchanan et al. [8], in the instance of pulsatile flow, distinct flow types developed for the highest Womersley number. Using a range of stenosis intensities, Long et al. [9] have investigated pulsatile blood flow in the stenosis models of three symmetrical and three axisymmetrical. For every model, they have focused on the wall shear stress (WSS) distributions and the flow separation zone (FSZ). Through the use of a 50% diameter reduction axisymmetric stenotic artery model, Banerjee et al. [10] have numerically investigated the impact of various Womersley numbers and waveforms on the flow system and the parameters of hemodynamics. Using Newtonian and other rheological models, Razavi et al. [11] have investigated the effects of pulsatile flow in an axisymmetric stenosed artery. As the degree of stenosis rises, they have determined that WSS develops dramatically at the stenosis throat and the flow gets more disrupted in the post-stenotic region.
The pulsatile blood flow via a stenotic artery has been numerically simulated by Karimi et al. [12] using a variety of blood rheologies for both two dimensions (2D) and three dimensions (3D) axisymmetric models. The outcomes of the simulations have been compared between the two models. The impact of the Reynolds number, Womersley number, and constriction ratio of obstruction on the flow characteristics in stenosed arteries has been computationally simulated by Liao et al. [13], and Hasan and Das [14]. All of this research is related to Newtonian blood properties. Plaque height has a major impact on the distribution of plaque wall stress (PWS) and its velocity near the plaque [15]. Higher plaque heights result in a greater force associated with blood flow near the plaque, which raises the compression stress. Considering pulsatile flow, Tu and Deville [16] have executed finite element simulations through stenosis using the properties of different rheological models for a rigid blockage tube. They praised the disturbances for being more resilient in terms of their vorticity intensity and insisted on the geometrical barrier, especially for severe stenoses. Chan et al. [17] explain comparisons with Carreau and power law models with the Newtonian model of 45% constriction using trapezoidal profiles, and argue that there are slight differences in the Carreau model in terms of pressure, velocity and WSS, and that the power law model has significantly more remarkable vortices and low WSS. In the field of low shear rate, blood rheology is crucial. In order to compare healthy and blocked models of patient-specific cases, Mendiera et al. [18] have examined the effects of non-Newtonian blood on hemodynamics using different rheological models for the bifurcated carotid artery.
Numerical simulation also plays a significant activity in biomedical engineering, blood flow-related sectors [19, 20] and biological cell separation [21, 22]. The principles of fluid mechanics may be useful in determining the reasons behind arterial stenosis. When conducting research on hemodynamic parameters, these principles can be consulted. It is possible to use these factors to predict the location, course, and timing of the lesion’s creation [23]. According to the study conducted by Wang et al. [24], a predictive surrogate model (PSM) is used to predict the blood hemodynamics in carotid artery stenosis. This model captures the hemodynamic parameters, namely, pressure, velocity components, WSS and oscillatory shear index (OSI). Additionally, it creates trustworthy error scales for WSS indices and velocity components, whereas OSI shows somewhat greater inaccuracies. The highest WSS value is found at the plaque neck when the blood pressure is 500 Pa, and the highest WSS value is found in the areas near the plaque root when the blood pressure is 1500 Pa [25]. Additionally, it has been noted that the area with extremely high WSS values grows as the plaque size does. The effects of stenosis on blood turbulence have been investigated by Srinivasan and Madathil [26], who have discovered a direct correlation between increased turbulent velocity and stenosis severity. Blood is regarded as an incompressible, non-Newtonian fluid in this study, and the arterial wall is regarded as rigid. Doutel et al. [27] have used a steady laminar flow with a solid wall concept to conduct experimental and numerical studies on a left coronary bifurcated artery. Trigui et al. [28] have discussed the pulsed flows in a severe aortic stenotic model and have presented that 75% diameter occlusion in a troublesome case of aortic wall damage. To investigate pulsatile blood flows via a 2D stenotic artery, Roy et al. [29] have used the Carreau-Yasuda model. They have used a rigid wall, a time-varying pressure at the outflow, and the Womersley flow as an entrance. According to Udupa et al. [30], who looked into the connection between hyperviscosity and physiological conditions, exercise encourages the separation zone downstream of the stenosis. The effects of alternating between resting and exercise conditions are also investigated by the researchers, who found a correlation between the rate of transition and the onset of stenosis. Though the effect of heart rate or pulse rate and mild stenosis morphology on hemodynamics blood flow is investigated [11, 31-33], the combined effects of pulse rate and stenosis morphology on OSI-based peak distance have not yet been estimated, which motivated me to do the present study.
The main objective of this investigation is to promote the understanding of the downstream flow of stenosis at common carotid artery flow conditions in axisymmetrical stenotic vessels with different stenosis severities, pulse rate of bpm and viscosity models. Extensive simulations of Newtonian and non-Newtonian flows have been performed to uncover the connections between hemodynamic factors and fluid dynamics. The oscillatory peak distance (OPD), mean and maximum OSI are more greatly affected by the stenosis severity compared to the various pulse rates. The present observations show that when an atheromatous plaque develops gradually under certain conditions, risk factors for atherosclerosis based on an OSI may change in a complex way.
The following methodical steps linked to CFD are used to get an efficient solution of computation regarding various models of blood flow rheology:
2.1 Computational domain
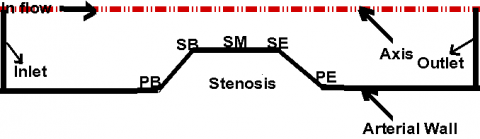
A rigid wall tube has been considered as the 2D model of the carotid artery with axisymmetrical trapezoidal stenosis as displayed in Figure 1. The 3D bifurcated flexible wall’s geometry with asymmetric plaques should be considered to attain accurate outcomes.
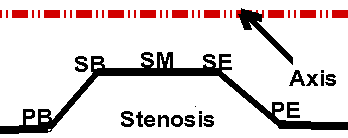
Figure 1. The current simulated schematic diagram
The degree of stenosis is altered from 30% to 60% in area reduction to explore how the trapezoidal form of the condition affects the flow characteristics. The stenosis expounds the area reduction as:
$(A R)=\frac{\pi R^2-\pi(R-h)^2}{\pi R^2}$
where, R and h represent the undisturbed radius and the maximum height of stenosis, which is defined as the stenosis severity. The blood flow behavior is also investigated due to the formation of stenosis for plaque beginning (PB), plaque ending (PE), stenosis beginning (SB), stenosis middle (SM) and stenosis ending (SE). The undisturbed part of the artery has a diameter of D = 7 mm, which is equal to the average diameter of the common carotid artery (CCA) of humans. A two-dimensional axisymmetric computational domain with polar coordinates (r, z) is used due to the CCA. The computational domain is divided into three parts, and their lengths with respect to D are 4D for pre-stenotic, 2D for stenotic and 20D for post-stenotic, respectively.
2.2 The simulation’s governing equations and boundary conditions
In two-dimensional cylindrical co-ordinates (r, z), the continuity and Navier-Stokes equations for incompressible axisymmetric flow can be expressed as follows:
Continuity equation: The continuity equation is defined as
$\frac{1}{r} \frac{\partial\left(r u_r\right)}{\partial r}+\frac{\partial u_z}{\partial z}=0$ (1)
r- direction momentum equation: The r- direction momentum equation can be stated as
$\begin{aligned} & \frac{\partial u_r}{\partial t}+u_r \frac{\partial u_r}{\partial r}+u_z \frac{\partial u_r}{\partial z}=-\frac{1}{\rho} \frac{\partial p}{\partial r}+\frac{\mu}{\rho}\left[\frac{\partial}{\partial r}\left(\frac{1}{r} \frac{\partial\left(r u_r\right)}{\partial r}+\frac{\partial^2 u_r}{\partial z^2}\right)\right]\end{aligned}$ (2)
z- direction momentum equation: The z- direction momentum equation can be explained as
$\begin{aligned} & \frac{\partial u_z}{\partial t}+u_r \frac{\partial u_z}{\partial r}+u_z \frac{\partial u_z}{\partial z}=-\frac{1}{\rho} \frac{\partial p}{\partial z}+ \frac{\mu}{\rho}\left[\frac{1}{r} \frac{\partial}{\partial r}\left(r \frac{\partial u_z}{\partial r}+\frac{\partial^2 u_z}{\partial z^2}\right)\right]\end{aligned}$ (3)
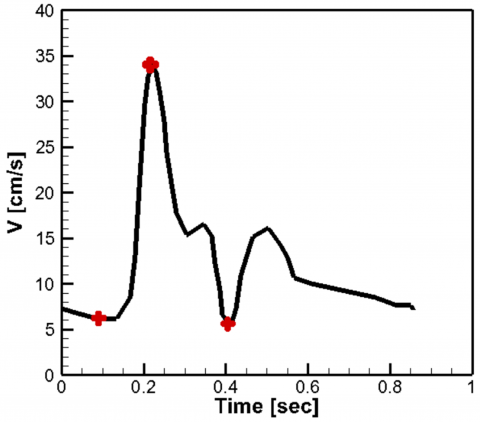
where, ur and uz are the radial and axial velocity components along radial co-ordinate (r) and axial co-ordinate (z), ρ indicates the density (kg/m3); p is the pressure (Pa). The density, and the constant viscosity of Newtonian fluid for blood are generally considered by ρ = 1050 kg/m3 and μ = 0.0035 Pa.s, respectively. The artery wall is assumed to be rigid, and a no-slip boundary condition is established along the wall of the artery. The carotid artery pulse applied in this investigation for the inlet boundary condition is introduced by Razavi et al. [11] in Figure 2 and is attained with fitting harmonic functions. The outlet boundary condition of the assumed artery is subjected to zero-gauge pressure.
2.3 Rheological models
The CFD technique incorporates Newtonian fluid along with two non-Newtonian fluids. The parameters are obtained by Cho and Kensey [34] by fitting the experimental data for blood. The Carreau model shows resemblances to the Newtonian fluid at elevated shear rates (appropriately above 100/s). It is shown that at high shear rates, the power-law model tends toward zero. Blood is widely regarded to behave as a Newtonian fluid when shear rates exceed 100/s. The Carreau and power-law models’ non-Newtonian blood characteristics have been described by Razavi et al. [11].
The Carreau model:
$\mu=\mu_{\infty}+\left(\mu_0-\mu_{\infty}\right)\left(1+A|\dot{\gamma}|^2\right)^n$
where, A = 10.976, n = -0.3216, μ∞ = 0.0035 Pa.s, μ0 = 0.056 Pa.s.
The power-law model:
$\mu=\mathrm{k}|\dot{\gamma}|^{\mathrm{n}-1}$
where, k = 0.035, n = 0.6.
Figure 2. Pulsatile inlet velocity vs. time
2.4 Numerical solution
The programming code COMSOL Multiphysics 5.2, which is based on the finite element technique, has been used for the completion of the model, mesh and computing tasks. The assumed geometry has been meshed in an unstructured discretization to generate mesh elements for gaining the optimum results by checking the grid independence. The solution’s implicit backward differentiation formula (BDF) has been accepted by the solver system. At every time step, a usual appeasement convergence is achieved with an iteration tolerance of 10-4. The time step of 0.0003 s has been accepted to capture the transient nature accurately. The introduced model has been accommodated on the CPU (Intel Core i7, 8th Gen 8700 with base frequency 3.20–4.60 GHz) surface.
2.5 Grid independence
In order to discuss grid independence, a grid resolution attempt is performed to find a suitable grid conduct where the simulated result is independent of the mesh size. Different numerical simulations of Mesh 1, Mesh 2, Mesh 3, Mesh 4 and Mesh 5 have been chosen to check the velocity on the stenosis throat and at a distance of 1D and 2D downstream of the stenosis from the stenosis middle. The accuracy can be controlled under the Mesh 4 because no significant variation is observed between the Mesh 4 and Mesh 5. The discretized grid distribution with unstructured geometry at the stenosis site is shown in Figure 3. The number of domain elements, boundary elements and degree of freedom for the different mesh tests are concentrated in Table 1.
Figure 3. Grid distribution at the stenosis site
Table 1. Mesh parameters and velocity at different axial positions
|
Parameter |
Domain Elements |
Boundary Elements |
Degree of Freedom |
Axial Velocity [cm/s] at Throat |
Axial Velocity [cm/s] at 1D |
Axial Velocity [cm/s] at 2D |
|
Mesh 1 |
10170 |
944 |
18337 |
47.7459 |
45.3791 |
43.6628 |
|
Mesh 2 |
34268 |
1826 |
57370 |
47.8116 |
46.0871 |
44.0889 |
|
Mesh 3 |
68142 |
2490 |
110071 |
47.8340 |
46.2701 |
44.2544 |
|
Mesh 4 |
154848 |
3000 |
241495 |
47.8728 |
46.3613 |
44.3293 |
|
Mesh 5 |
323163 |
8815 |
519013 |
47.8737 |
46.3613 |
44.3299 |
2.6 Methodology validation
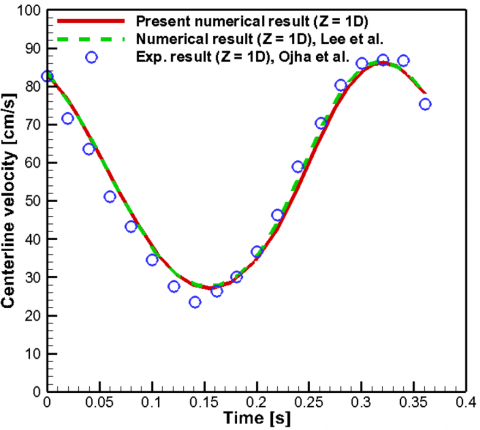
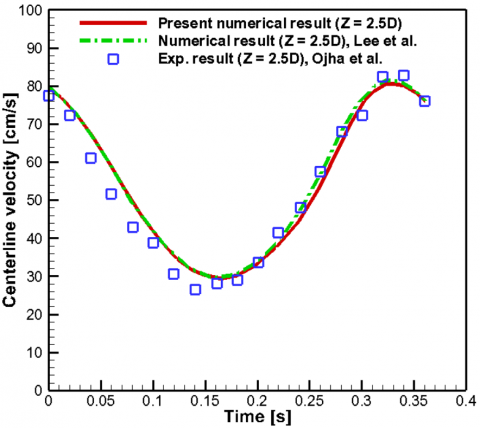
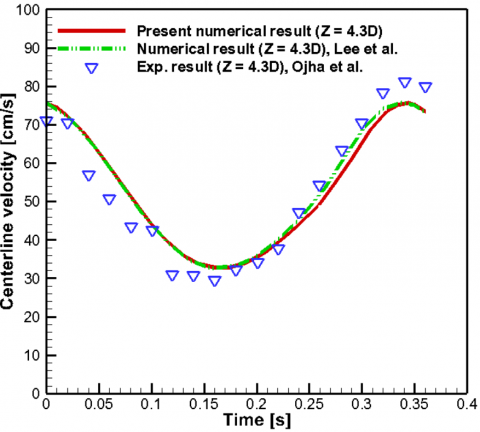
The current numerical simulations are contrasted with the computational and experimental findings of Ojha et al. [5] and Lee and Xu [35] in order to ensure the credibility of the numerical outcomes. Unsteady centerline velocity distributions are investigated for validation at various post-stenotic positions (Z = 1D, 2.5D and 4.3D), where Z can be identified as the axial distance of the point from the stenosis throat in the line of axis, and the diameter is D. With the exception of a little variation, as shown clearly in Figure 4, the numerical outcomes of the current research are substantially more congruent with the works of experimental and numerical data from Ojha et al. [5] and Lee and Xu [35] respectively.
Figure 4. Comparison of centerline axial velocity between present predictions and experiment of Ojha et al. [5] and computational data of Lee and Xu [35] at post-stenotic locations of Z = 1D, Z = 2.5D and 4.3D
Numerical computations are performed at various stenosis strengths. Each computation’s total time is t = 0.8572 s, which corresponds to a heart rate of roughly 70 beats per minute. The following times, which represent the critical moments in a single cardiac cycle, are used to measure hemodynamic parameters.
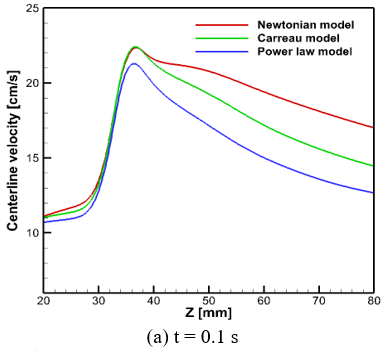
At t = 0.1 s, the cycle is almost at its start, before the blood flow accelerates.
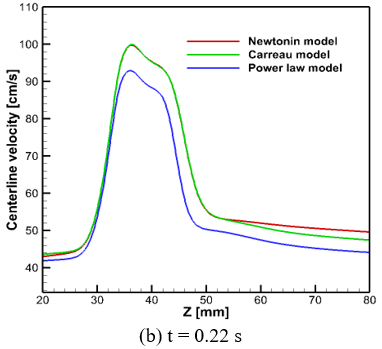
At t = 0.22 s, the artery experiences its maximum flow rate, which is identified as systole.
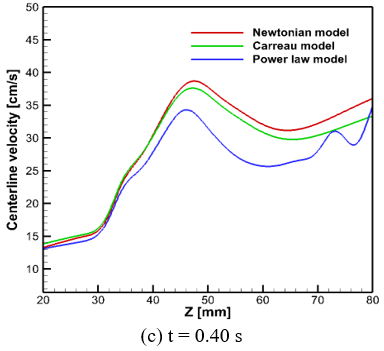
At t = 0.4 s, the artery’s lowest flow rate occurs, which is chosen as diastole.
The effects of non-Newtonian behavior, inlet velocity, stenosis severity, and pulse rate are examined in relation to streamline flow patterns, WSS, OSI, and centerline pressure and velocity.
3.1 Entrance velocity’s impact
Figures 5 and 6 show how centerline velocity and centerline pressure distribution are affected by pulsatile inflow velocity. The centerline velocity is a significant factor in the investigation of pulsatile flow areas. The flow recirculation area forms immediately downstream of the stenosis and is distinguished by negative wall shear stresses. The rheology of fluid flow has a comprehensive effect on the vortex. The patterns of the centerline velocity distributions are identical for the three models, but the recovery time of the flow from its perturbed states is longer in the Newtonian model. This clarifies that a substantial recirculation area is present behind the obstruction, and it signifies that the blood has a non-Newtonian nature. Figures 5(a)-(c) show the centerline velocity ordination for non-Newtonian (Carreau & power-law) and Newtonian models at accelerating, maximum and minimum flow phases, respectively. During the accelerating and maximum flow phases, it is noted that the distributions of velocity for both Newtonian and Carreau models are nearly identical. At the minimum flow phase, the centerline velocity of Newtonian fluid is greater than the other models. Across all phases, it can be concluded that the Carreau model’s velocity profiles closely follow the Newtonian model’s distributions in every aspect of the geometry, while the power-law model shows discrepancies in the centerline velocity when compared to the other models during a full cardiac cycle.
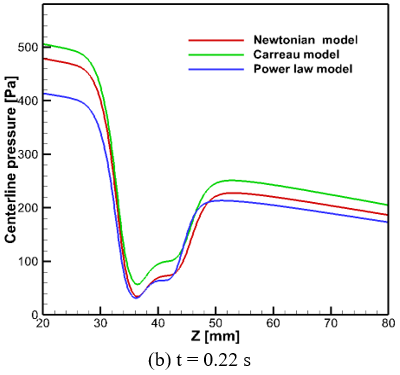
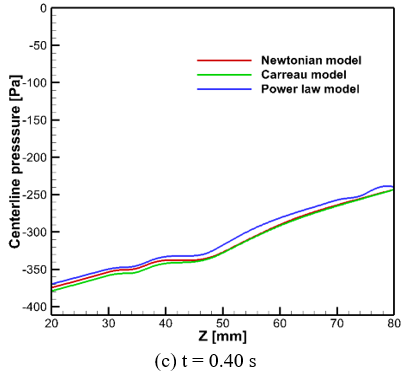
The typical behavior of the pressure limits may be demonstrated by their alteration along the artery’s centerline. Figures 6(a)-6(c) illustrate the variations in centerline pressure for both the Newtonian and non-Newtonian models at various time points (t = 0.1, 0.22 and 0.4 s) within a single cycle. In the time of earlier acceleration or t = 0.1s and maximum flow phase or t = 0.22 s as a systole, the pressure is superior at the upstream part than at the downstream part, and it decreases at the throat of stenosis and partially recovers at the downstream section. The collapse of the pressure is bigger in periods of comparatively larger flow because of the peak velocity involved. When t = 0.4 s, the imposed flow is in the opposite direction, and it is negative. As expected, the Carreau and power-law models’ pressure exceeds compared to that of the Newtonian model over the course of the cycle. As a result, the Newtonian model’s pressure and the non-Newtonian model’s pressure match.
Figure 5. Centerline velocity along the symmetric axis at several time instants (a) earlier acceleration or t = 0.1 s (b) peak systole or t = 0.22 s and (c) diastole or t = 0.4 s
Figure 6. Centerline pressure along the symmetric axis at different time steps (a) earlier acceleration or t = 0.1 s (b) peak systole or t = 0.22 s and (c) diastole or t = 0.4 s
3.2 Effect of stenosis locations
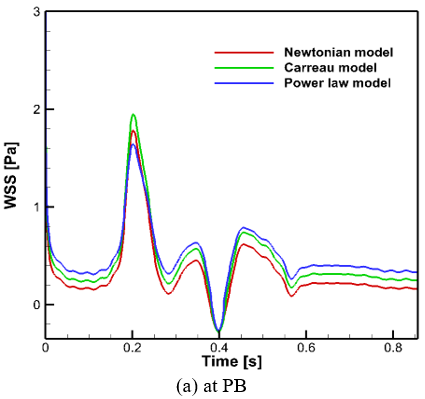
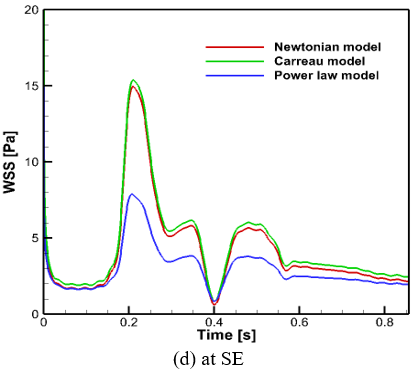
WSS vs. time histories (Figure 7) at five distinct stenosis locations (PB, PE, SB, SM and SE) in the 60% area reduction are displayed in this work for the whole cardiac cycle. All the selected stenosis wall points undergo oscillating WSS across the pulse cycle, with the amplitude of the oscillation depending sharply on the stenosis location. The three WSS curves at PB and PE are very familiar, suggesting that the impact of the viscous models on the flow turns out to be negligible at these locations. Differences become noteworthy in the WSS curves for the three models, especially at SB, SM and SE throughout the cardiac cycle, and the highest deviation is observed in the case of the power-law model. In the stenosis model, WSS oscillates most intensely at PE and WSS curves for the three models, as shown in Figure 7, are more complicated, indicating negative WSS at this point.
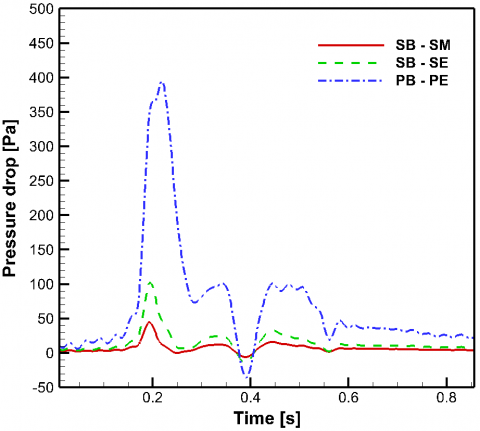
Figure 8 displays the history of pressure drops (SB-SM), (SB-SE) and (PB-PE) during one cardiac cycle only for the Newtonian model in the area reduction of 60%. Both pressure drop cases are identical in shape but significantly different in magnitude. For the first quarter of the complete cardiac cycle, the pressure drops rise with time, while for the second quarter of the flow cycle, the pressure drops decline with time. The pressure differences (SB-SM), (SB-SE) and (PB-PE) are negative when the flow rate is minimum (t = 0.4), but the maximum deviation is observed between the PB and plaque ending (PE). The negative pressure drop indicates a collapse during the complete flow cycle. The maximum pressure drop in the case of (PB-PE) at the maximum flow rate (t = 0.22) is about 4 and 8 times higher than in the case of (SB-SE) and (SB-SM).
Figure 7. Five different stenosis locations, and variations of WSS vs. time at (a) PB, (b) SB, (c) SM, (d) SE and (e) PE for different models
Figure 8. Pressure drop vs. time for Newtonian model
3.3 Effect of hemodynamic (OSI) parameter
OSI, the mechanical component associated with the pulsation of flow, evaluates the main flow direction for a full cardiac cycle. It can be defined as
$\operatorname{OSI}=\frac{1}{2} \times\left(1-\frac{\left|\int_0^T W S S d t\right|}{\int_0^T|W S S| d t}\right)$ (4)
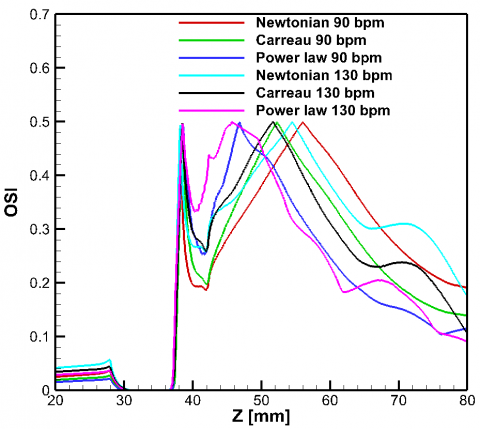
When the temporal average shear vector and the instantaneous shear stress vector are aligned, their magnitude is 0. The maximum OSI is 0.5, which relates to a flow that is purely oscillating with a value $\int_0^T \mathrm{WSS}_{\text {mean }} \mathrm{dt}$ equal to 0. The zones demonstrating elevated OSI are utmost susceptible to the composition of atherosclerotic lesions. This occurs because the cells of the endothelium elongate and orient themselves parallel to the main flow direction. Razavi et al. [11], along with Buchanan et al. [8], illustrate the OSI curve’s fluctuation and identify the points of separation and reattachment, which are also investigated in the current OSI curves, as shown in Figures 9 and 14. Figure 9 exhibits OSI values for the 60% stenosis of 90 and 130 bpm utilizing the Newtonian and non-Newtonian fluids. It is noticeable that two peaks appear on the OSI profile concerning the points of time average separation and reattachment across all models, which could help identify areas prone to atherosclerosis, and their locations are depicted. The first summit reveals the location of flow separation, whereas the subsequent summit reveals the location of flow reattachment, at which TAWSS equals zero. It is recognized that plaque formation relies on the residence time of the lipid molecules at the mentioned endothelium location. The comparison regarding flow separation between Newtonian and non-Newtonian fluids indicates that non-Newtonian characteristics are especially important in physiological states because of the intricate makeup and flow behavior of bodily fluids such as blood.
Figure 9. OSI for both Newtonian and non-Newtonian models is measured along the arterial wall at 90 and 130 beats per minute
3.4 Effect of pulse rate on OSI
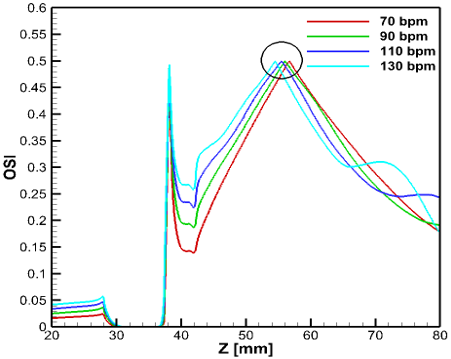
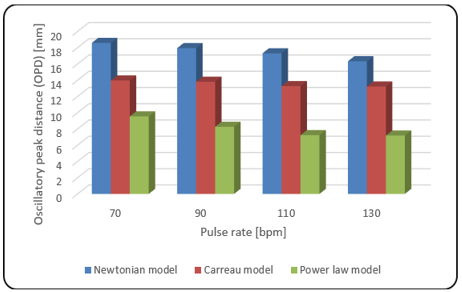
The hemodynamic weightiness of common carotid artery blockage and the risk of its development may be evaluated by comparing the effect of hemodynamics induced by pulse rates of 70, 90, 110 and 130 bpm (beats per minute). Regarding the effect of pulse rates, it is evident that the oscillatory peak distance (the length between the first peak and the second peak) is affected by the pulse rate of 130 bpm compared to the pulse rate of 70 bpm. Figure 10 displays that an increased pulse rate tends to decrease the oscillatory peak distance, especially when we focus on the oscillatory peak values in the case of a Newtonian fluid. For instance, the first peaks appear at 10.12 mm for pulse rates of 70 and 90 bpm and at 10.17 mm for pulse rates of 110 and 130bpm, while the second peak occurs at 28.71, 28.07, 27.48 and 26.50 mm for pulse rates of 70, 90, 110 and 130 bpm respectively, from PB.
The effect of varying pulse rates on the oscillatory recirculation length in a stenosed carotid artery is investigated through a cardiac cycle with a fixed stenosis of 60%. The first peak point and the second peak points corresponding to the locations of time-averaged separation and reattachment may be evaluated using the curves of OSI. The measured length between these two points indicates the oscillatory-based recirculation length that could lead to the advancement of atherosclerosis at the stenosis onset. The peak point variety has a significant impact on the function of the endothelial cells. The simulated results are compared for different pulse rates of bpm. The value of the OPD decreases monotonically with increasing pulse rates, as shown in Figure 11 and Table 2. In Table 2, the simulation findings indicate that with a pulse rate of 130 bpm, the OPD reduces by 5.66, 9.03, and 12.16% for pulse rates of 110, 90, and 70 bpm, respectively. Also, Table 2 presents that the Newtonian model creates more disturbed flow patterns compared to non-Newtonian models. The value of oscillatory peak distance in the Newtonian model is more times larger for the power-law model than that for the Carreau model (Figure 11). In cardiovascular disease, increased OSI, which indicates flow instability and decreased WSS, which suggests reduced blood flow regions, are associated with a higher risk of thrombus formation and plaque rupture. Variations in the WSS and OSI can reveal information about the course of the atherosclerotic disease and possible therapeutic approaches. Stenosis intervention policies could gain from hemodynamic parameters, possibly focusing on regions of irregular flow with treatments designed to enhance blood circulation and decrease inflammation.
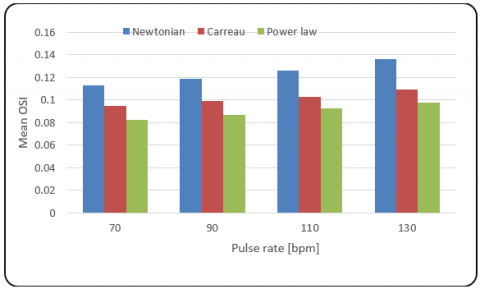
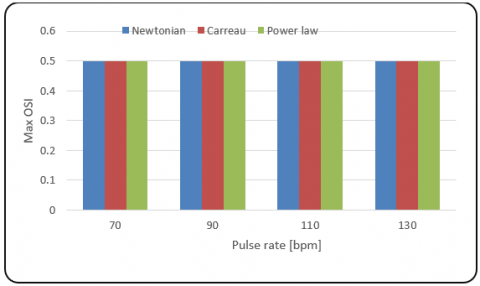
It is obvious that the pulse rate has an extensive significance on the mean and max OSI in a constricted carotid artery. In this paper, we investigate how the behaviors of the oscillatory flow vary with the variation of pulse rates for the pulsatile flow. The location of the atherosclerosis formation corresponding to low shear stress in the downstream regions also depends on the human pulse rate. The predicted numerical outcomes of mean and max OSI are compared and presented in Figures 12 and 13 for three different viscous models due to 60% stenosis. The mean oscillatory shear index monotonically increases with increasing pulse rate (Figure 12), showing no change in maximum oscillatory shear index (Figure 13). Though the average oscillatory shear index is an increasing trend with respect to increasing pulse rate, it is noticed that the mean OSI is higher in the Newtonian model than that of the other models (Figure 12). The differences of the mean OSI between the simulated pulse rate of 70 bpm and the considered pulse rates of 90, 110 and 130 bpm for all models in a 60% stenosis are indicated in Table 3.
Figure 10. OSI along the artery wall for different pulse rates of Newtonian fluid
Figure 11. OPD for different pulse rates through rheological models
Table 2. OPD obtained from OSI due to pulse rate for rheological models
|
Model Name |
Pulse Rate [bpm] |
OSI |
OPD [mm] |
|
|
First Peak[mm] from PB |
Second Peak[mm] from PB |
|||
|
Newtonian |
70 |
10.12 |
28.71 |
18.59 |
|
Carreau |
10.47 |
24.43 |
13.96 |
|
|
Power law |
10.61 |
20.15 |
9.54 |
|
|
Newtonian |
90 |
10.12 |
28.07 |
17.95 |
|
Carreau |
10.47 |
24.28 |
13.81 |
|
|
Power law |
10.56 |
18.82 |
8.26 |
|
|
Newtonian |
110 |
10.17 |
27.48 |
17.31 |
|
Carreau |
10.47 |
23.74 |
13.27 |
|
|
Power law |
10.56 |
17.79 |
7.23 |
|
|
Newtonian |
130 |
10.17 |
26.50 |
16.33 |
|
Carreau |
10.47 |
23.69 |
13.22 |
|
|
Power law |
10.56 |
17.74 |
7.18 |
|
Figure 12. Mean oscillatory shear index for different pulse rates through rheological models
Figure 13. Maximum oscillatory shear index for different pulse rates through rheological models
Table 3. Report on mean OSI related to pulse rates for 60% stenosis
|
Model |
Stenosis Severity |
Pulse Rates (bpm) |
Mean OSI |
Differences from 70 bpm (%) |
|
Newtonian |
60% |
70 |
0.113 |
0 |
|
Carreau |
0.0947 |
0 |
||
|
Power-law |
0.0822 |
0 |
||
|
Newtonian |
90 |
0.119 |
5.04 |
|
|
Carreau |
0.0992 |
4.54 |
||
|
Power-law |
0.0866 |
5.08 |
||
|
Newtonian |
110 |
0.126 |
10.32 |
|
|
Carreau |
0.103 |
8.06 |
||
|
Power-law |
0.0924 |
11.04 |
||
|
Newtonian |
130 |
0.136 |
16.91 |
|
|
Carreau |
0.109 |
13.12 |
||
|
Power-law |
0.0979 |
16.04 |
3.5 Stenosis severity’s impact
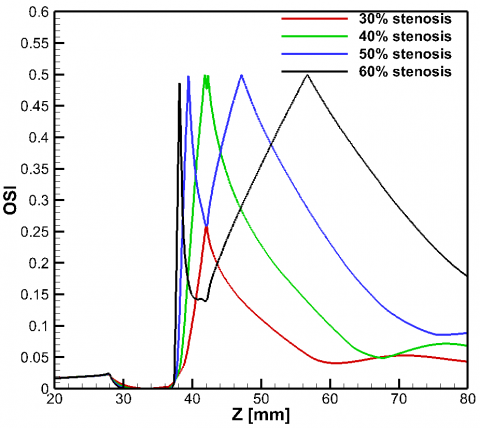
The degree of stenosis is a significant indicator of OSI. This analysis focuses solely on Newtonian fluid in unsteady flow conditions within a common carotid artery featuring a symmetrical stenosis morphology of 30-60%. The stenosis severity influences the OSI behaviors at the recirculation zone downstream of the stenosis. Figure 14 shows the impact of AR severities on the OSI distribution. There is an expressible increase in time-average wall shear stress with increasing stenosis severity. For the 30% AR, the flow is mildly perturbed as expected, and there exists no flow separation or recirculation even though the same inlet velocity is imposed. Compared to a 40%, 50% and 60% area blockage, the peak distance has grown remarkably. Because elevated TAWSS levels can cause endothelial cell injury, the TAWSS sites have clinical significance. The impact of a shear stress-based OSI indicator has been proposed in this research due to stenosis strength for analyzing the wall surface. It is found that the time average wall shear stress is quite low and oscillates between the values of positive and negative values in the area after the stenosis due to intense unsteady flow. The OSI reaches a peak value at the downstream of stenosis, indicating that the wall experiences high oscillation shear stress or zones of flow reversal. Analyzing the connection between WSS and OSI in intravascular flows reveals that areas of low TAWSS and high OSI align closely with regions where flow recirculations occur. As the stenosis becomes stronger, as displayed in Figure 14, the negative wall shear stress and OSI continue to trend upward in the downstream constriction zones. There is only one peak point noticed for 30% stenosis (Figure 14), and no separation is observed. For 40% and 50% stenosis, the separation point (first peak) is shifted towards the vicinity of the stenosis, and the reattachment point (second peak) is placed far from the stenosis and creates a larger oscillatory peak distance, respectively. Finally, as the stenosis severity increases OSI-based peak distance increases continually in the downstream areas of the stenosis.
Figure 14. OSI distribution along the artery wall for Newtonian model in case of different stenosis severities
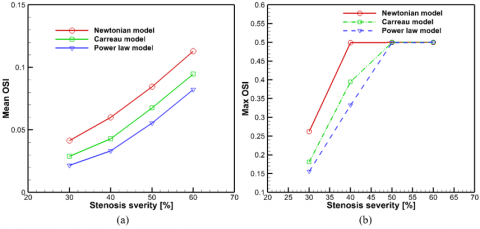
3.6 Effect of stenosis severity on mean and max OSI
The OSI brings out the complete WSS oscillation during the pulsatile blood flow. An increase in the severity of arterial stenosis causes an increase in OSI, mainly involved to the oscillatory fluctuation of the WSS. The increment of mean OSI with respect to the degree of stenosis is higher in the Newtonian model than in the other models captured (Figure 15 (a)). A significant impact of the intensity of stenosis on the max OSI is noticed between 30 and 50% stenosis in the case of two non-Newtonian models. In this interval, there is a sudden increase in OSI to the peak value of 0.5 (Figure 15(b)). However, an abrupt increase of the max OSI value is viewed with the severity of stenosis of about 30–40% for the Newtonian model.
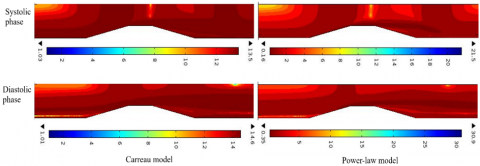
3.7 Non-Newtonian importance factor
The local non-Newtonian importance factor, $I F_L$ is identified by Ballyk et al. [36] to introduce a quantitative significance of non-Newtonian blood flow behavior, which is referred to as
$I F_L=\frac{\mu_{\text {eff }}}{\mu_N}$ (5)
where, $\mu_{eff}$ is the effective blood viscosity and $\mu_{N}$ is the dynamic viscosity of the Newtonian model. Figure 16 shows the surface contour of the importance factor due to the non-Newtonian nature of distinct models in a stenosis severity of 60% regarding systolic and diastolic phases. Due to viscosity variation with respect to shear rate, the power-law model provided higher values in comparison to the other models. As displayed in Figure 16, in maximum flow rate, non-Newtonian models exhibited a reduction and at lower flow rates, these models demonstrated an increment in $I F_L$.
Figure 15. (a) Mean and (b) maximum OSI distributions through different stenosis severities for all cases investigated
Figure 16. Surface contour of non-Newtonian importance factor through rheological models
A common carotid artery with stenosis severities of symmetric type, ranging from 30 to 60% is subjected to numerical modeling for both Newtonian and non-Newtonian fluids in the presence of unsteady blood flow. Every blood viscosity model has the same inclinations for centerline velocity, centerline pressure, and WSS; however, the values of these parameters vary from model to model. WSS and pressure drop with respect to time are higher in the stenosis throat location and between PB and PE, respectively. With the exception of the power-law model, the discrepancies between the models become increasingly significant when the inlet velocities change.
The main conclusion from this research is that variations in the degree of stenosis significantly affect the hemodynamics across various models. Hemodynamic parameters are also significantly involved in the pulse rate. A clear relationship between the temporary input velocities and the WSS parameter is revealed by accounting for the time impacts of pulsatile flow. Maximum flow through the artery results in elevated WSS readings at the stenosis peak. WSS decreases during the decelerating phase, and sizable separation zones occur downstream of the stenosis, providing an ideal environment for the sick artery’s plaque to grow. The stenosis severity increases the OSI-based peak distance and also has an impact on the viscosity models’ oscillatory peak distance. Results present that the OPD decreases as the increases of pulse rate. The oscillatory peak distance indicates that the morphological characteristics affect the areas of possible endothelial dysfunction.
According to simulation data, the Newtonian model’s OPD is greater than that of the rheological models, highlighting the non-Newtonian nature of blood. Ultimately, it is stated that for a pulse rate of 130 bpm, the OPD reduces by 5.66, 9.03, and 12.16% for 110, 90, and 70 bpm, respectively.
|
AR |
area reduction |
|
bpm |
beat per minute |
|
CCA |
common carotid artery |
|
h |
height of stenosis |
|
IFL |
local importance factor |
|
OPD |
oscillatory peak distance |
|
OSI |
oscillatory shear index |
|
PB |
plaque beginning |
|
PE |
plaque ending |
|
R |
radius of artery |
|
(r, z) |
coordinates |
|
SB |
stenosis beginning |
|
SE |
stenosis ending |
|
TAWSS |
time average wall shear stress |
|
TAWSSV |
time average wall shear stress vector |
|
WSS |
wall shear stress |
[1] Davies, M.J., Woolf, N. (1990). Atheroma, atherosclerosis in ischaemic heart disease: The mechanisms. New York: Science Press Limited.
[2] Ahmed, S.A., Giddens, D.P. (1984). Pulsatile post-stenotic flow studies with laser Doppler anemometry. Journal of Biomechanics, 17(9): 695-705. https://doi.org/10.1016/0021-9290(84)90123-4
[3] Kaid, N., Benyamina, L., Menni, Y., Alkhafaji, M.A., Bayram, M., Alshammari, B.M., Kolsi, L. (2024). Unveiling hemodynamic pulsatile flow dynamics in carotid artery stenosis: Insights from computational fluid dynamics. AIP Advances, 14(6): 065128. https://doi.org/10.1063/5.0216867
[4] Deplano, V., Siouffi, M. (1999). Experimental and numerical study of pulsatile flows through stenosis: Wall shear stress analysis. Journal of Biomechanics, 32: 2081. https://doi.org/10.1016/S0021-9290(99)00098-6
[5] Ojha, M., Cobbold, R.S.C., Johnston, K.W., Hummel, R.L. (1989). Pulsatile flow through constricted tubes: An experimental investigation using photochromic tracer methods. Journal of Fluid Mechanics, 203: 173-97. https://doi.org/10.1017/S0022112089001424
[6] Tang, D., Yang, C., Kobayashi, S., Ku, D.N. (2001). Steady flow and wall compression in stenotic arteries: A three-dimensional thick-wall model with fluid-wall interactions. Journal of Biomechanical Engineering, 123(6): 548-557. https://doi.org/10.1115/1.1406036
[7] Hameed, M.S., Shah, A.A., Khan, M.I., Ali, A., Hussain, I., Bukhari, M.D. (2023). Comparison of blood flow analysis in stenosed and stented carotid artery bifurcation models. Cogent Engineering, 10(1): 2158624. https://doi.org/10.1080/23311916.2022.2158624
[8] Buchanan, J.R., Kleinstreuer, C., Truskey, G.A., Lei, M. (1999). Relation between non-uniform hemodynamics and sites of altered permeability and lesion growth at the rabbit aorto-celiac junction. Atherosclerosis, 143: 27-40. https://doi.org/10.1016/S0021-9150(98)00264-0
[9] Long, Q., Xu, X.Y., Ramnarine, K.V., Hoskins, P. (2001). Numerical investigation of physiologically realistic pulsatile flow through arterial stenosis. Journal of Biomechanics, 34: 1229-1242. https://doi.org/10.1016/S0021-9290(01)00100-2
[10] Banerjee, M., Ganguly, R., Datta, A. (2012). Effect of pulsatile flow waveform and Womersley number on the flow in stenosed arterial geometry. International Scholarly Research Notices, 2012(1): 853056. https://doi.org/10.5402/2012/853056
[11] Razavi, A., Shirani, E., Sadeghi, M.R. (2011). Numerical simulation of blood pulsatile flow in a stenosed carotid artery using different rheological models. Journal of Biomechanics, 44: 2021-2030. https://doi.org/10.1016/j.jbiomech.2011.04.023
[12] Karimi, S., Dadvar, M., Dabagh, M., Jalali, P., Modarress, H., Dabir, B. (2013). Simulation of pulsatile blood flow through stenotic artery considering different blood rheologies: Comparison of 3D and 2D axisymmetric models. Biomedical Engineering: Applications, Basis and Communications, 25(2): 1350023. https://doi.org/10.4015/S1016237213500233
[13] Liao, W., Lee, T.S., Low, H.T. (2004). Numerical studies of physiological pulsatile flow through constricted tube. International Journal of Numerical Methods for Heat & Fluid Flow, 14(5): 689-713. https://doi.org/10.1108/09615530410539991
[14] Hasan, A.B.M.T., Das, D.K. (2008). Numerical simulation of sinusoidal fluctuated pulsatile laminar flow through stenotic artery. Journal of Applied Fluid Mechanics, 1(2): 25-35. https://doi.org/10.36884/jafm.1.02.11845
[15] Amoo, T., Oriaifo, O., Ayeni, A. (2024). Computational simulation of the effects of blood flow velocity on atherosclerosis progression in a human carotid artery. F1000 Research, 13: 426. https://doi.org/10.12688/f1000research.144183.1
[16] Tu, C., Deville, M. (1996). Pulsatile flow of non-Newtonian fluids through arterial stenosis. Journal of Biomechanics, 29: 899-908. https://doi.org/10.1016/0021-9290(95)00151-4
[17] Chan, W.Y., Ding, Y., Tu, J.Y. (2007). Modeling of non-Newtonian blood flow through a stenosed artery incorporating fluid-structure interaction. ANZIAM Journal, 47: C507-C523. https://doi.org/10.21914/anziamj.v47i0.1059
[18] Mendiera, J.B., Fontanarosa, D., Wang, J., Paritala, P.K., McGahan, T., Lloyd, T., Li, Z. (2020). The importance of blood rheology in patient-specific computational fluid dynamics simulation of stenotic carotid arteries. Biomechanics and Modeling in Mechanobiology, 19(5): 1477-1490. https://doi.org/10.1007/s10237-019-01282-7
[19] Biglarian, M., Larimi, M.M., Afrouzi, H.H., Moshfegh, A., Toghraie, D., Javadzadegan, A., Rostami, S. (2020). Computational investigation of stenosis in curvature of coronary artery within both dynamic and static models. Computer Methods and Programs in Biomedicine, 185: 105170. https://doi.org/10.1016/j.cmpb.2019.105170
[20] Ali, M.T., Saleh, A.H., Aziz, H.S. (2024). Efficient detection of brain stroke using machine learning and artificial neural networks. Mathematical Modelling of Engineering Problems, 11(12): 3369-3378. https://doi.org/10.18280/mmep.111215
[21] Hosseini, M., Hasani, M., Biglarian, M., Amoei, A.H., Toghraie, D., Sabetvand, R., Rostami, S. (2020). The effect of the second excitation frequency mode under different conditions on the fluid streaming and microparticles acoustophoresis with the aim of separating biological cells. Computer Methods and Programs in Biomedicine, 184: 105300. https://doi.org/10.1016/j.cmpb.2019.105300
[22] Mahdi, H.A., Shujaa, M.I., Zghair, E.M. (2023). Diagnosis of medical images using Fuzzy Convolutional Neural Networks. Mathematical Modelling of Engineering Problems, 10(4): 1345-1351. https://doi.org/10.18280/mmep.100428
[23] Moradicheghamahi, J., Sadeghiseraji, J., Jahangiri, M. (2019). Numerical solution of the Pulsatile, non-Newtonian and turbulent blood flow in a patient specific elastic carotid artery. International Journal of Mechanical Sciences, 150: 393-403. https://doi.org/10.1016/j.ijmecsci.2018.10.046
[24] Wang, F., Shi, W., Zhang, H., Hou, H., Li, N. (2025). Linear surrogate modeling for predicting hemodynamic in carotid artery stenosis during exercise conditions. Chinese Journal of Physics, 94: 262-273. https://doi.org/10.1016/j.cjph.2025.01.006
[25] Alagbe, E.E., Amoo, T.E., Ayeni, A.O., Oyedele, O.S., Ashiekaa, V.D. (2022). Computational simulation of atherosclerosis progression associated with blood pressure in a 2D idealized human carotid artery model. The Open Chemical Engineering Journal, 16(1): E187412312205260. https://doi.org/10.2174/18741231-v16-e2205260
[26] Srinivasan, S., Madathil, D. (2016). 3-dimensional computational study of blood flow in pathophysiologically affected arteries simulated in OpenFOAM. In 2016 8th Cairo International Biomedical Engineering Conference (CIBEC), Cairo, Egypt, pp. 35-38. https://doi.org/10.1109/CIBEC.2016.7836114
[27] Doutel, E., Carneiro, J., Campos, J.B.L.M., Miranda, J.M. (2018). Experimental and numerical methodology to analyze flows in a coronary bifurcation. European Journal of Mechanics-B/Fluids, 67: 341-356. https://doi.org/10.1016/j.euromechflu.2017.09.009
[28] Trigui, A., Chiekh, M.B., Bera, J.C., Gilles, B. (2021). Experimental and numerical investigation of pulsed flows in a severe aortic stenosed model. Medical Engineering & Physics, 90: 33-42. https://doi.org/10.1016/j.medengphy.2021.02.006
[29] Roy, M., Sikarwar, B.S., Bhandwal, M., Ranjan, P. (2017). Modeling of blood flow in stenosed arteries. Procedia Computer Science, 115: 821-830. https://doi.org/10.1016/j.procs.2017.09.164
[30] Udupa, M.C., Saha, S., Natarajan, S. (2025). Study of blood flow patterns in a stenosed artery through the combined effect of body acceleration and generalized womersley solution. Scientific Reports, 15(1): 1845. https://doi.org/10.1038/s41598-025-85566-2
[31] Khan, P.M., Sharma, S.D., Chakraborty, S., Roy, S. (2023). Effect of heart rate on the hemodynamics in healthy and stenosed carotid arteries. Physics of Fluids, 35: 061906. https://doi.org/10.1063/5.0153323
[32] Chen, X., Cao, H., Li, Y., Chen, F., Peng, Y., Zheng, T., Chen, M. (2024). Hemodynamic influence of mild stenosis morphology in different coronary arteries: A computational fluid dynamic modelling study. Frontiers in Bioengineering and Biotechnology, 12: 1439846. https://doi.org/10.3389/fbioe.2024.1439846
[33] Hossain, T., Anan, N., Arafat, M.T. (2021). The effects of plaque morphological characteristics on the post-stenotic flow in left main coronary artery bifurcation. Biomedical Physics & Engineering Express, 7(6): 065001. https://doi.org/10.1088/2057-1976/ac202c
[34] Cho, Y.I., Kensey, K.R. (1991). Effects of non-Newtonian viscosity of blood on flows in a diseased arterial vessel, Part 1: Steady flows. Biorheology, 28: 241-262. https://doi.org/10.3233/bir-1991-283-415
[35] Lee, K.W., Xu, X.Y. (2002). Modeling of flow and wall behaviour in a mildly stenosed tube. Medical Engineering & Physics, 24: 575-586. https://doi.org/10.1016/S1350-4533(02)00048-6
[36] Ballyk, P.D., Steinman, D.A. Ethier, C.R. (1994). Simulation of non-Newtonian blood flow in an end-to-side anastomosis. Biorheology, 31: 565-586. https://doi.org/10.3233/bir-1994-31505