Jamal Abdulkadir Mohamed*![]() | Abdikadir Ahmed Mohamed
| Abdikadir Ahmed Mohamed![]() | Abdikani Yusuf Abdulle
| Abdikani Yusuf Abdulle![]() | Mowlid Mohamed Osman
| Mowlid Mohamed Osman![]()
© 2025 The authors. This article is published by IIETA and is licensed under the CC BY 4.0 license (http://creativecommons.org/licenses/by/4.0/).
OPEN ACCESS
Chatbots, automated conversational agents equipped with artificial intelligence, are increasingly implemented by companies to enhance customer service and engagement. The artificial intelligence (AI) chatbot has grown into an important tool for company-consumer communications, likely improving customer service efficiency while reducing costs. However, limited research has focused on assessing the quality of service these chatbots provide to consumers. Chatbots hold significant potential for customer support in terms of service efficiency, cost savings, and overall Customer experience. In addition to reducing business costs, chatbots improve customer engagement by minimizing the time and effort customers spend on transactions. This study applies e-service quality, guided by the Input-Process-Output (IPO) model and incorporating conversational AI quality to predict users' satisfaction and loyalty to customer service chatbots. Specifically, it investigates the influence of Hormuud's WhatsApp chatbot services on customer experience and loyalty, focusing on key service quality attributes. Using Structural Equation Modeling (SEM) as the analytical approach, we explore the relationship between independent variables—efficiency/service quality, responsiveness, security/privacy, and personalization—and their impact on customer loyalty and satisfaction. Data were gathered from a sample of 174 participants, capturing perceptions of chatbot interactions in a real-world customer service context. Findings reveal that each independent variable significantly affects customer satisfaction and loyalty, emphasizing the significance of AI-driven chatbots in boosting digital relationship with customers. These results improve understanding of the effective use of chatbots in service industries by providing a foundation for further research and development in AI-supported customer relationship management.
chatbot, WhatsApp chatbot, customer experience, customer loyalty, customer services
Many businesses have set up chatbots to improve customer service, considering them as an innovative platform that allows for communications with both future and current customers [1]. Chatbots are computational systems that use natural language processing to interact with humans [2], and they have recently gained popularity due to technological advancements and the rise of texting as a primary method of communication, replacing face-to-face interactions in both personal and professional settings [3]. When traditional marketing falls short, artificial intelligence (AI) chatbots can improve customer interactions by providing a proactive, personable touch in company communications [4, 5]. Integrated with social media platforms, company websites, and messaging apps, chatbots offer businesses a range of benefits, including instantaneous responses to queries, consistent information delivery, and opportunities to collect valuable customer data.
AI chatbots are designed to mimic human interactions, and understanding their human-like characteristics, such as conversational ability, is crucial for assessing their impact on customer perceptions. Customer-chatbot interaction involves inputs, processing, outputs, and overall procedure—posing inquiries, collecting data, and delivering responses—formulate the customer's evaluation of the chatbots Service quality.
Additionally, chatbots add business value by fostering customer loyalty. This study leverages service quality literature, incorporating conversational service quality as a belief-related construct to predict user satisfaction and loyalty to customer service chatbots. From a theoretical perspective based on the Input-Process-Output (IPO) model, which frames chatbot interactions as user inputs, system processing, and customer satisfaction as outputs. The study proposes a new construct of conversational service quality based on the IPO model, identifying key antecedents of chatbot user satisfaction and loyalty. Practically, the findings may assist chatbot service providers in designing more effective customer relationship management (CRM) strategies.
AI-driven chatbots have emerged as a promising solution for delivering economical, round-the-clock customer service. Statistics show that nearly one in four customer service organizations currently employs AI-driven chatbots to support customers [6], with the chatbot market expected to exceed USD 142 billion by 2024 [7]. Chatbots are particularly valuable in retail and e-commerce, where they boost sales, conversion rates, and the overall shopping experience while gathering customer data. Although previous studies have examined aspects like system architecture [8], human-chatbot interaction and satisfaction [9] and chatbot acceptance [10] they have largely overlooked interaction-related Service quality, particularly conversational quality. Information system and marketing literature has empirically confirmed that service quality strongly influences user satisfaction and behavior [11, 12].
Recently, chatbots have attracted substantial interest from researchers exploring their potential impact on customer satisfaction [1] and customer perceptions of companies [3]. With consumers increasingly interacting with AI-driven systems online more frequently than with humans [13], understanding and enhancing chatbot service quality is becoming essential for businesses aiming to improve customer experience and loyalty. Somalia’s telecom sector is characterized by widespread mobile usage, with Hormuud Telecom as a dominant player offering AI-enabled customer services in a mobile-first economy.
To address this gap, this study employs Structural Equation Modeling (SEM) to analyze the relationship between key service quality attributes—efficiency/service quality, responsiveness, security/privacy, and personalization—and their impact on customer loyalty and satisfaction with Hormuud’s WhatsApp chatbot services. By gathering data from a sample of 174 participants, the study aims to provide empirical insights into how specific conversational quality factors shape user satisfaction and Loyalty, contributing to both the academic literature and practical applications in customer relationship management.
2.1 Customer service chatbots
Artificial intelligence chatbots have quickly become important business tools, improving consumer relationships through providing digitized, real-time assistance [12]. The rise of AI chatbots is driven by advancements in natural language processing (NLP), machine learning (ML), and big data analytics, empowering them to answer inquiries promptly and improve service quality [14].
A chatbot is an AI-driven program designed to simulate human communication using text or voice. It's mainly used for customer service, finding information, and even for entertainment [15]. The concept of chatbots dates back to 1966 with early models such as ELIZA [16]. While their functionality was once held back by hardware limitations and limited network access, recent breakthroughs in machine learning and natural language processing have really boosted what chatbots can do. Now, they can engage in much more nuanced conversations and tackle a variety of complex tasks [17].
These days, chatbots have become a common tool in many industries like banking, e-commerce, telecommunications, and healthcare. They're being used to make service operations more efficient and to enhance how businesses connect with their customers [18]. In the world of e-commerce, AI chatbots are essential for things like financial consultations, customer support, and tailored marketing strategies. They help businesses provide 24/7 service while also cutting down on operational costs [14]. Their capabilities extend essential support for customers, including personalized service, recommendation systems, and transaction facilitation, proving them important for digital business transformation [19].
Although they are increasingly adopted, studies suggest that chatbot performance relies on several service quality features such as responsiveness, accuracy, personalization, and privacy guarantee [20]. The factors mentioned significantly impact user satisfaction, trust, and Loyalty, which are vital for long-term customer retention [21].
2.2 Service quality dimensions in AI chatbots
The quality of chatbot services is a pivotal factor influencing customer experience and loyalty [12]. Scholars have classified chatbot service quality into several key dimensions:
2.2.1 Personalization and conversational quality
Personalization is key when it comes to how chatbots interact with users. It really boosts customer engagement and satisfaction [18]. Based on studies, customers such as AI chatbots that provide personalized responds understand the purpose of users, and adapt conversations in response to in addition requests [14].
Hsu and Lin [12] emphasized the significance of conversational quality and the proven fact that chatbots with human-like conversational skills enhance emotional engagement and trust. This is similar to studies regarding chatbots in the banking industry, which shows that consumer perceptions of AI-driven services are significantly influenced through interactive and creative responses [20].
2.2.2 Privacy and security in chatbot adoption
Privacy remains a primary concern for chatbot users, as AI-driven interactions involve collecting and processing sensitive user data [14]. Research indicates that data security assurances, transparent policies, and ethical AI use enhance consumer trust and acceptance [21].
Chatbots that are part of financial services need to follow strict data protection guidelines. If users feel their privacy is at risk, it could result in decreased engagement and a tarnished brand image [20].
2.2.3 Responsiveness and service efficiency
Another important factor influencing customer experience in artificial intelligence chatbots is responsiveness. Research indicates that faster response times and real-time issue resolution increase customer happiness and retention rates [19].
However, chatbot limitations in handling complex inquiries often lead to frustration, requiring seamless human-agent transitions to maintain service quality [12]. The integration of hybrid AI-human support systems is recommended to improve chatbot efficiency while ensuring customer needs are adequately met [18].
2.2.4 Trust and customer loyalty in AI chatbot services
Trust is a fundamental factor influencing chatbot adoption and continued usage [20]. Users develop trust in AI chatbots based on their ability to provide accurate, relevant, and secure interactions [22].
Research in AI marketing suggests that chatbot trust directly correlates with customer loyalty, as users who perceive chatbots as reliable are more likely to continue engagement and recommend services [14].
2.3 AI chatbots in Somalia: The case of Hormuud’s WhatsApp chatbot
While AI chatbots have gained widespread adoption globally, their implementation in emerging markets like Somalia remains underexplored. Hormuud’s WhatsApp Chatbot represents a pioneering effort in AI-driven customer service within the Somali telecommunications sector. According to the study [23], Somalia’s telecommunications sector has expanded rapidly, with approximately 8.84 million mobile cellular subscriptions in 2021, representing 52 per 100 inhabitants [24]. Despite low fixed-line penetration, mobile connectivity is widespread, driven by the affordability of SIM cards and the focus on mobile data services [25]. Hormuud, the largest telecom provider in Somalia, estimates that 9 out of 10 Somalis own a mobile phone, and approximately 70% of the population is connected to a telephone network [26]. This context underscores the relevance of WhatsApp chatbots as a customer service tool, particularly in a mobile-first, low-literacy environment where internet access remains limited outside urban centers.
This study builds on existing chatbot research by examining Hormuud’s WhatsApp chatbot’s impact on customer experience and loyalty. It extends previous frameworks by integrating personalization, privacy, responsiveness, and service quality to analyze their influence on Somali customers’ engagement with AI chatbots.
2.4 Research gap and contribution
Despite the growing body of chatbot literature, limited studies have explored AI chatbot adoption in Somalia and other emerging markets. Most prior research focuses on banking, e-commerce, and retail, with insufficient attention to the telecommunications sector [19].
This study addresses this gap by providing empirical insights into how AI chatbots shape customer relationships in a developing market context. It contributes to the AI marketing and service quality literature by offering a localized perspective on chatbot-driven customer engagement in Somalia.
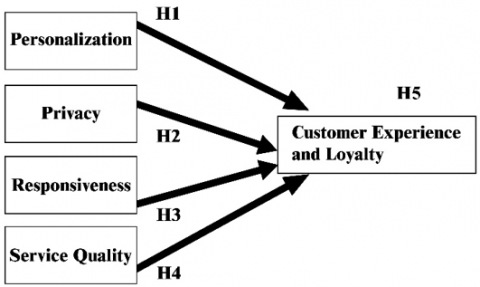
To conclude the literature review, the study proposes the following hypotheses for the research objectives:
Figure 1 shows the conceptual framework of the study.
Figure 1. Conceptual framework
The study explores the impact of Hormuud's WhatsApp chatbot services on customer experience and loyalty using quantitative research and SEM. It analyzes the relationships between key constructs like personalization, privacy, responsiveness, and service quality, ensuring reliability and validity.
4.1 Population and sampling
The target group of the study focuses on Hormuud Telecom customers who active with the WhatsApp chatbot services of the business. Random sampling system was used to ensure a representative sample. Customers were selected based on their interaction history with the chatbot, therefore ensuring demographic diversity in age, gender, and geographic area.
Supported by other research in customer experience and loyalty, the last sample of 174 respondents was deemed adequate for SEM analysis. Variations across the consumer demographics were addressed using a sampling approach, therefore guaranteeing the display of several points of view. The sample size (N=174) aligns with SEM literature [27] which supports 150–200 observations for models with 4–6 constructs.
An online survey indicated to assess the constructs of personalized service, privacy, responsiveness, and service quality as well as their impact on customer experience and loyalty assisted in collecting data. Google forms were used to distribute the survey, therefore enabling simple access and involvement. Participants were recruited via Hormuud’s WhatsApp broadcast lists. No incentives were given. The survey received a 74% response rate. The study used a standardized questionnaire split into sections matching the four constructs—personalization, privacy, responsiveness, and service quality—and their impact on customer experience and loyalty. Each element had several five-point Likert scale measured items ranging from 1 (strongly disagree) to 5 (strongly agree).
4.2 Data analysis
The study applied advanced statistical methods, particularly Partial Least Squares Structural Equation Modelling (PLS-SEM), for data analysis. Smart PLS program provided predictions for path coefficients, standard deviations, T statistics, and P values. The SEM analysis showed significant correlations between independent variables (personalization, privacy, responsiveness, and service quality) and dependent variables (customer experience and loyalty), delivering an extensive understanding of the factors that affect customer satisfaction and loyalty.
4.3 Measurement of the constructs
Available literature was used to measure the research constructs with minimal modifications for both the measures and scales. Customer satisfaction, engagement, and loyalty, as modified from chatbot and AI service quality studies, were used to measure the dependent variable, customer experience and loyalty [12, 20].
Table 1 summarizes the independent variables, personalization defined as the ability of chatbots to tailor responses, recognize user preferences, and provide customized interactions, personalization was evaluated by five items taken from previous studies on service quality and chatbot interaction models [14]. The study evaluated privacy, user trust in data security, and confidentiality using four items from AI service trust and consumer data security literature [28].
Responsiveness, the chatbot’s ability to deliver quick replies and resolve customer queries in real-time, was measured using four items adapted from studies on service efficiency and chatbot adoption [14, 19]. Service quality was assessed using five items focusing on efficiency, functionality, and accuracy of the chatbot interactions, adapted from prior literature on AI-enabled Service quality [20].
The study employed a seven-point Likert scale (1 = Strongly Disagree to 7 = Strongly Agree) to gauge respondents’ agreement or disagreement with the constructs.
Table 1 consolidates the operationalization of the constructs’ indicators and references to the literature.
Table 1. Variables, definitions, and indicators
|
Variable |
Definition |
Indicators |
Authors |
|
Personalization |
The ability of chatbots to provide tailored and customized services to users. |
User recognition, tailored responses, custom interactions. |
[12, 18] |
|
Privacy |
Assurance of secure data handling and confidentiality during user interactions. |
Trust in security, confidentiality, data control. |
[14, 20] |
|
Responsiveness |
Real-time and efficient handling of customer queries. |
Reply speed, issue resolution time, availability. |
[29] |
|
Service quality |
Efficiency, accuracy, and reliability in chatbot interactions. |
Accurate responses, error-free interactions, reliability. |
[29] |
|
Customer experience and loyalty |
User satisfaction and engagement during chatbot interactions. |
Satisfaction, usability, emotional engagement and Retention, recommendation likelihood, preference. |
[30] |
5.1 Demographic analysis
Table 2 indicates the demographics respondents, and generally the study's participants were having 56 female users and 118 male participants, mostly around the age of 25. The participants had various educational qualifications: 11.5% completed secondary education, 58.6% had a bachelor's degree, 28.2% earned a master's degree, and 1.7% obtained a PhD. The frequency of application of the Hormuud WhatsApp chatbot services were below: 36.2% used it once or twice daily, 24.7% once or twice weekly, 16.1% once or twice monthly, 10.9% three times monthly, 6.3% three times daily, and 5.7% three times weekly. The average time spent on chatbot usage was 30.5% for less 5 minutes, 36.2% for 50–10 minutes, 23.0% for 10–20 minutes, and 10.3% for in addition to 20 minutes.
Table 2. Demographics respondents
|
Questions |
Frequency |
Percent |
|
Gender |
|
|
|
Female |
56 |
32.2 |
|
Male |
118 |
67.8 |
|
Age |
|
|
|
Between 26 and 35 years |
78 |
44.8 |
|
Less than 25 years |
65 |
37.4 |
|
Between 36 and 45 years |
19 |
10.9 |
|
Above 55 years |
11 |
6.3 |
|
Between 46 and 55 years |
1 |
0.6 |
|
Educational Qualification |
|
|
|
Bachelor’s degree |
102 |
58.6 |
|
Master’s degree |
49 |
28.2 |
|
PhD |
3 |
1.7 |
|
Secondary level |
20 |
11.5 |
|
Once a day and twice a day |
63 |
36.2 |
|
Once a month or twice a month |
28 |
16.1 |
|
Once a week or twice a week |
43 |
24.7 |
|
Three times a day |
11 |
6.3 |
|
three times a week |
10 |
5.7 |
|
Thrice a month |
19 |
10.9 |
|
Between 10 and 20 min |
40 |
23.0 |
|
Between 5 and 10 min |
63 |
36.2 |
|
Less than 5 min |
53 |
30.5 |
|
More than 20 min |
18 |
10.3 |
5.2 Outer model evaluation (Model measurement)
To ensure rigorous data analysis and a thorough understanding of the relationships between variables, this study employed advanced statistical methodologies. SEM techniques, particularly PLS-SEM, were utilized with the Smart PLS software platform. These methods facilitated an evaluation of the measurement model through key indicators such as Cronbach's alpha, factor loadings, composite reliability (CR), and average variance extracted (AVE).
Table 3. Reliability and assessment
|
Latent Variables |
|
Factor Loading |
α |
CR |
AVE |
|
Service quality 1 |
SQ1 |
0.887 |
0.928 |
0.946 |
0.778 |
|
Service quality 2 |
SQ2 |
0.834 |
|
|
|
|
Service quality 3 |
SQ3 |
0.887 |
|
|
|
|
Service quality 4 |
SQ4 |
0.908 |
|
|
|
|
Service quality 5 |
SQ5 |
0.891 |
|
|
|
|
Personalization 1 |
PER1 |
0.915 |
0.900 |
0.930 |
0.770 |
|
Personalization 2 |
PER2 |
0.899 |
|
|
|
|
Personalization 3 |
PER3 |
0.870 |
|
|
|
|
Personalization 4 |
PER4 |
0.824 |
|
|
|
|
Privacy 1 |
PRI1 |
0.835 |
0.904 |
0.929 |
0.722 |
|
Privacy 2 |
PRI2 |
0.880 |
|
|
|
|
Privacy 3 |
PRI3 |
0.826 |
|
|
|
|
Privacy 4 |
PRI4 |
0.848 |
|
|
|
|
Privacy 5 |
PRI5 |
0.858 |
|
|
|
|
Responsiveness 1 |
RES1 |
0.840 |
0.901 |
0.927 |
0.716 |
|
Responsiveness 2 |
RES2 |
0.843 |
|
|
|
|
Responsiveness 3 |
RES3 |
0.876 |
|
|
|
|
Responsiveness 4 |
RES4 |
0.886 |
|
|
|
|
Responsiveness 5 |
RES5 |
0.784 |
|
|
|
|
Customer experience 1 |
CE1 |
0.891 |
0.917 |
0.938 |
0.753 |
|
Customer experience 2 |
CE2 |
0.847 |
|
|
|
|
Customer experience 3 |
CE3 |
0.918 |
|
|
|
|
Customer experience 4 |
CE4 |
0.851 |
|
|
|
|
Customer experience 5 |
CE5 |
0.827 |
|
|
|
Table 4. HTMT matrix
|
Constructs |
CE |
PR |
PR |
RES |
SQ |
|
Customer experience and loyalty |
|||||
|
Personalization |
0.923 |
||||
|
Privacy |
0.934 |
0.987 |
|||
|
Responsiveness |
0.839 |
0.823 |
0.868 |
||
|
Service quality |
0.810 |
0.841 |
0.904 |
0.794 |
The reliability and validity of a study were assessed using established thresholds as shown in Table 3. Factor loadings above 0.60 were considered acceptable, while values below 0.40 were considered inadequate. Cronbach's alpha values above 0.90 indicated excellent reliability, while values between 0.60 and 0.70 raised concerns. AVE scores and composite reliability (CR) values must be higher than 0.50 and 0.70, respectively.
The study determined the validity and reliability of Hormuud's WhatsApp chatbot services. Factor loadings exceeding 0.60 were recorded by all constructs, indicating high internal consistency. Cronbach's alpha and composite reliability attained a minimum threshold of 0.70, while AVE scores recorded above the threshold value of 0.50. Service quality, personalization, privacy, responsiveness, and customer experience demonstrated high reliability and validity. The measurement model met reliability and validity standards, providing an adequate foundation for structural analysis. This method has successfully tested Hormuud's WhatsApp chatbot services' influence on customer experience and loyalty, providing an effective basis for further structural analysis.
These findings confirm that the measurement model satisfies the criteria for reliability and validity. The high factor loadings, strong Cronbach's alpha values, and sufficient AVE scores across all constructs provide a solid foundation for subsequent structural analysis. This robust measurement model effectively supports the investigation into how Hormuud’s WhatsApp chatbot services influence customer experience and loyalty.
The Heterotrait-Monotrait (HTMT) ratio, as shown in Table 4, is a critical criterion for evaluating discriminant validity in SEM. It measures the degree to which constructs are distinct from each other. Generally, HTMT values below 0.90 are considered acceptable, with stricter contexts recommending a cutoff of 0.85.
The results in Table 4 show significant relationships between customer experience and loyalty, personalization, privacy, responsiveness, and service quality. Customer experience and loyalty are significantly correlated with personalization and privacy, indicating they are distinct concepts. The strong relationship with privacy needs further examination for discriminant validity. Personalization shows a strong relationship with privacy, above the suggested threshold, indicating significant overlap. The correlation between service quality and privacy is significant, a bit in addition to the threshold, indicating possible redundant in the measurement items. Responsiveness has acceptable relationships with other variables, with values below the 0.90 threshold, confirming its uniqueness. The HTMT results indicate discriminant validity for the majority of categories; however, elevated values between personalization and privacy, as well as service quality and privacy, underscore areas requiring further study. The HTMT value between personalization and privacy exceeds the ideal threshold (0.987), suggesting conceptual overlap. Future refinements may include revalidating construct boundaries or applying exploratory factor analysis. Following studies should improve measuring items and utilize qualitative factor analysis to improve clarity and validity.
The Fornell-Larcker criterion, as presented in Table 5, is a key method for assessing discriminant validity in SEM. This approach evaluates whether the square root of the AVE for each construct is greater than its correlations with other constructs. For discriminant validity to be established, the AVE square root for a construct must surpass its correlations with all other constructs.
The results in Table 5 demonstrate that customer experience and loyalty have a square root of AVE of 0.868, which is higher than its correlations with other constructs such as personalization (0.845), privacy (0.852), responsiveness (0.767), and service quality (0.749). This indicates strong discriminant validity for this construct. Similarly, personalization exhibits a square root of AVE of 0.877, exceeding its correlations with customer experience and loyalty (0.845), privacy (0.894), responsiveness (0.747), and service quality (0.771), confirming its distinctiveness.
Privacy meets the criteria with a square root of AVE of 0.894, surpassing other constructs like customer experience and loyalty, personalization, responsiveness, and service quality. Responsiveness has a square root of AVE of 0.846, surpassing other constructs like customer experience and loyalty, personalization, privacy, and service quality. Service quality achieves a square root of AVE of 0.882, surpassing other constructs like customer experience and loyalty, personalization, privacy, and responsiveness.
Generally, the results in Table 5 confirm that all constructs satisfy the Fornell-Larcker criterion, indicating strong discriminant validity. Each construct is distinct and effectively measures its respective dimension within the study model. These findings enhance the validity of the measurement model and establish a reliable foundation for subsequent structural analyses.
Table 5. Fornell-Larcker criterion
|
Constructs |
CE |
PER |
PRI |
RES |
SQ |
|
Customer experience and loyalty |
0.868 |
||||
|
Personalization |
0.845 |
0.877 |
|||
|
Privacy |
0.852 |
0.894 |
0.850 |
||
|
Responsiveness |
0.767 |
0.747 |
0.785 |
0.846 |
|
|
Service quality |
0.749 |
0.771 |
0.828 |
0.726 |
0.882 |
The inner model's Variance Inflation Factors (VIFs) are 5 and below or equal to 5, indicating minimal multicollinearity and safe regression analysis. All VIF values for all constructs are below the key threshold, indicating no multicollinearity problems. Personalization has the highest VIF at 3.541, followed by service quality at 3.162 and customer experience and loyalty at 3.140. Privacy and responsiveness have low VIF values, indicating no collinearity problems among predictor variables.
The R-square value for customer experience and loyalty is 0.778, as shown in Table 6, which indicates that 77.8% of the variance in this construct is explained by the independent variables in the model. The adjusted R-square value, accounting for the number of predictors and sample size, is slightly lower at 0.773. These high values reflect the model’s strong explanatory power in predicting customer experience and loyalty, surpassing the general benchmark of 0.50 for predictive accuracy.
Table 6. Collinearity statistics (VIF) and R-square
|
Constructs |
VIF |
R-Square |
R-Square Adjusted |
|
Customer experience and loyalty |
3.140 |
0.778 |
0.773 |
|
Personalization |
3.541 |
|
|
|
Privacy |
2.473 |
|
|
|
Responsiveness |
2.565 |
|
|
|
Service quality |
3.162 |
|
|
In summary, Table 6 demonstrates that the model is robust, with low VIF values confirming the absence of multicollinearity and high R-square values indicating excellent predictive ability. The independent variables, including personalization, privacy, responsiveness, and service quality, collectively contribute significantly to explaining the variance in customer experience and loyalty, validating the reliability and strength of the structural equation model.
The fit indices of the model, as reported in Table 7, offer essential information regarding the capacity of the structural model to account for the data measured. The Standardized Root Mean Square Residual (SRMR) of both the estimated and saturated models is 0.058, far below the advised cut-off value of 0.08, thereby suggesting a good model fit. This low SRMR value shows that observed and predicted correlations vary little, verifying the model's reliability. The d_ULS and d_G, which represent measures of differences between observed and model-implied covariance matrices, are 1.009 and 0.955, respectively. Both values are close for both types of models, again verifying the fit of the structural model. The Chi-square value of the saturated and estimated models is 862.141 and can serve as a baseline to check the model's appropriateness. Though the Chi-square value is typically affected by sample size and usually indicates significance with large data, it reaffirms that the model has correctly identified the inherent structure.
Table 7. Model fit
|
Constructs |
Saturated Model |
Estimated Model |
|
SRMR |
0.058 |
0.058 |
|
d_ULS |
1.009 |
1.009 |
|
d_G |
0.955 |
0.955 |
|
Chi-square |
862.141 |
862.141 |
|
NFI |
0.802 |
0.802 |
The Normed Fit Index (NFI) is 0.802, a level that, although slightly under the desired level of 0.90, indicates a reasonable level of fit, particularly when taken in conjunction with the favorable Standardized RMR figure. Together, these statistics indicate the model is sufficient to explain the relationships among the constructs with little room for improvement in fit. In general, the statistics provided in Table 7 confirm the reliability of the structural model, illustrating its adequacy in describing the effect of the independent variables on the dependent constructs. Future research can emphasize enhancing particular fit indices, like the enhancement of the NFI, in order to enhance the predictive precision and general fit of the model.
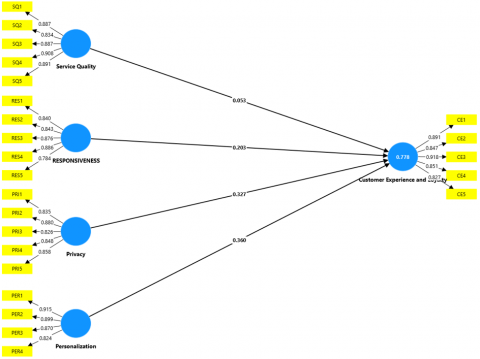
The structural model in Figure 2 depicts the relationships between the independent constructs (service quality, responsiveness, privacy, and personalization) and the dependent construct (customer experience and loyalty). The standardized path coefficients indicate the strength of these relationships, while the factor loadings confirm the reliability of the indicators measuring each construct. Notably, the R-square value for customer experience and loyalty is 0.778, indicating that 77.8% of the variance in this construct is explained by the independent variables, which demonstrates the model’s strong explanatory power. Among all the constructs, Personalization has the strongest link with customer experience and loyalty (path coefficient = 0.360), indicating the significance of personalized services in maximizing customer satisfaction and Loyalty. Second, privacy is significantly important, as a path coefficient of 0.327 indicates the prominent role of data protection to facilitate trust. The responsiveness construct, with a path coefficient of 0.203, has a moderate degree of influence, highlighting the importance of timely and effectual responses to customers' needs. Service quality, on the other hand, has an insignificant effect on the Customer experience, as indicated by its relatively low path coefficient of 0.053.
In short, Figure 2 illustrates that personalization and privacy are the most significant determinants of customer experience and loyalty, followed by responsiveness, with service quality having an insignificant effect in this model. All indicator loadings exceed 0.70 and thereby confirm that they are reliable. These results highlight the essential effect of personalized interactions and strong privacy controls to achieve optimum customer satisfaction, and responsiveness is still a moderately important but critical factor. Organizations that seek to enhance customer experience through chatbot services should focus on these strategic priorities. The high R-square value of the model justifies its ability to adequately explain the interrelationships, thus offering a valuable framework for future research that investigates customer behavior.
Figure 2. Structural model
Table 8. Direct effect
|
Constructs |
β |
Standard Deviation |
T Statistic |
P Value |
Decision |
|
Personalization → Customer experience and loyalty |
0.360 |
1.000 |
1.462 |
0.000 |
Supported |
|
Privacy → Customer experience and loyalty |
0.327 |
1.000 |
1.089 |
0.000 |
Supported |
|
Responsiveness → Customer experience and loyalty |
0.203 |
1.000 |
1.591 |
0.000 |
Supported |
|
Service quality → Customer experience and loyalty |
0.053 |
1.000 |
0.995 |
0.000 |
Supported |
Table 8 presents a quantitative examination of customer experience and loyalty, specifically targeting dimensions such as personalization, privacy, responsiveness, and service quality. The examination employs path coefficients, standard deviation, T statistics, and P values to test each construct and thereby assess data variability, hypothesis testing, and inferential statistical significance. The results offer a comprehensive insight into the dynamics of customer experience and loyalty. The concept 'personalization → customer experience and loyalty' has a path coefficient of 0.360, which suggests a moderately strong positive association, according to the first analysis. A substantial departure from the null hypothesis is shown by the T statistic of 1.462, which is greater than the standard standards of statistical significance that are frequently used in many social scientific investigations. Furthermore, the statistical significance of this discovery is further supported by the P value of 0.000, which is significantly lower than the conventional alpha threshold of 0.05. The decision to support the hypothesis is in line with quantifiable evidence of a strong positive correlation between consumer loyalty, experience, and personalizing it.
This finding aligns with previous research emphasizing the importance of tailoring customer interactions to enhance satisfaction and retention.
Conversely, the 'service quality → customer experience and loyalty' construct exhibits the weakest relationship among the constructs analyzed. The path coefficient of 0.053 indicates a very weak positive effect. The T statistic of 0.995 falls below the typical threshold for strong statistical significance, yet the P value of 0.000 confirms that the relationship is still statistically significant. While the hypothesis is supported, the minimal impact suggests that service quality alone may not substantially drive customer experience and loyalty. These finding challenges specific service-centric models, suggesting that other constructs, such as personalization and privacy, may play a more dominant role in shaping customer perceptions.
These findings collectively highlight the importance of personalization, privacy, and responsiveness as critical drivers of customer experience and loyalty, while service quality, though significant, plays a less influential role in this context.
The findings of this study align with or diverge from prior research on the relationship between constructs such as personalization, privacy, responsiveness, and service quality with customer experience and loyalty. This discussion contextualizes the results by comparing them with relevant studies, emphasizing how these constructs contribute to overall customer outcomes.
Firstly, the findings on personalization are consistent with previous research. This study demonstrates that personalization has a significant positive effect on customer experience and loyalty (path coefficient = 0.360, T statistic = 1.462, P value = 0.000). Similarly, studies [12, 18] emphasized the pivotal role of personalized chatbot interactions in enhancing customer satisfaction and Loyalty. Hsu and Lin [12] highlighted that conversational quality, a key aspect of personalization, significantly improves user satisfaction, while Li et al. [30] underlined the importance of tailored services in raising the perceived value of interactions, particularly in the banking sector. Furthermore, Chakraborty et al. [14] supported this finding by demonstrating how generative AI chatbots in online grocery shopping enhance user experiences through personalized recommendations. These converging results underscore the importance of tailoring customer interactions to meet individual preferences as a primary driver of Loyalty and satisfaction.
Regarding Privacy, the findings of this study highlight a moderate but significant positive relationship with customer experience and loyalty (path coefficient = 0.327, T statistic = 1.089, P value = 0.000). This aligns with prior studies emphasizing the critical role of data security in fostering trust. Li and Wang [18] emphasized the necessity of balancing data-driven personalization with robust privacy measures to maintain user trust. Urbani et al. [19] similarly discussed the importance of data protection, highlighting that privacy concerns can undermine trust in chatbots if not adequately addressed. Mehrolia et al. [31] also stressed the apprehension surrounding data misuse, particularly in sensitive domains like banking. These findings collectively reinforce the argument that safeguarding privacy is essential for building trust, a key component of customer loyalty.
The results concerning responsiveness indicate a weaker yet significant positive effect on customer experience and loyalty (path coefficient = 0.203, T statistic = 1.591, P value = 0.000). This finding aligns with studies that highlight responsiveness as a critical factor in chatbot effectiveness. Hsu and Lin [12] described responsiveness as a crucial element of conversational quality that directly impacts user satisfaction. Heo et al. [32] similarly identified responsiveness as pivotal in fostering initial trust and encouraging engagement with chatbots. Urbani et al. [19] noted that timely responses from chatbots significantly enhance customer service efficiency, supporting the positive relationship observed in this study.
Conversely, the findings on Service quality reveal the weakest relationship among the constructs analyzed (path coefficient = 0.053, T statistic = 0.995, P value = 0.000). Despite its statistical significance, the impact of Service quality on customer experience and loyalty is minimal, suggesting that it may not be a primary driver. This finding contrasts with traditional service-centric models but aligns with studies that position Service quality as a supporting factor rather than a standalone driver. Hsu and Lin [12] proposed that while core service quality is essential, its impact is amplified when integrated with conversational quality. Li and Wang [18] also framed service quality within the broader context of value co-creation, emphasizing its dependence on other constructs like personalization and responsiveness. These results suggest that while Service quality is important, its influence is secondary to other constructs in shaping customer perceptions.
The weak direct effect of Service quality on Loyalty (β = 0.053) may stem from users’ low expectations in a fragile telecom environment. In Somalia, the functional presence of any working chatbot service may satisfy users regardless of technical depth. This may explain the marginal role of perceived service quality compared to personalization or privacy.
This study highlights the importance of personalization, privacy, and responsiveness in driving customer experience and loyalty. However, it calls for a move away from traditional service-driven models to more dynamic, interaction-based approaches. This call highlights the complexity in engaging with customers and the need to tailor approaches to specific contexts. The findings provide practical guidelines for organizations optimizing their chatbot implementations and add to a deeper understanding of customer experiences.
7.1 Conclusion
This study investigates the impact of Hormuud's WhatsApp chatbot services on customer experience and loyalty, highlighting key aspects of Service quality: personalization, privacy, responsiveness, and overall service quality. This study involves a sample of 174 respondents and utilizes SPSS for descriptive statistics and SEM for regression data analysis.
The evidence highlights that personalization and privacy are the key drivers in impacting customer experience and loyalty, hence underlining tailored interactions along with strong data security practices. Moreover, Responsiveness also plays a significant, albeit comparatively moderate, role in attaining customer satisfaction, whereas Service quality has a comparatively lower effect. The findings advance the IPO model by embedding Personalization and Privacy as core elements of chatbot 'processing' in emerging markets.
The article is a pioneering effort in Somalia that offers empirical evidence of the success of AI-driven chatbot services. The article identifies the role of artificial intelligence in enhancing business efficiency and customer relations, allowing organizations to optimize their strategies and improve customer loyalty.
7.2 Recommendations
The following recommendations are set up across by businesses strive to increase their chatbot services in light of findings:
(1). Give priority to personalization: Companies should concentrate on offering highly customized chatbot interactions by using customer information to provide recommendations and responses that are based strategies to each individual.
(2). Enhance privacy measures: It's critical to establish trust by implementing strong data protection measures. Chatbot operations should be based on secure data-handling methodologies and transparent Privacy policies.
(3). Strengthen responsiveness: Sustaining customer satisfaction requires prompt and accurate responses. The chatbot's comprehension and response to consumer requests for information can be improved by utilizing sophisticated natural language processing models.
(4). Improve service quality: Although this study found that Service quality had the minimum effect, maintaining overall customer trust still depends on a chatbot that operates consistently and accurately.
(5). Adapt to mobile-first context: Optimize chatbot interfaces for mobile devices and include Somali language or audio prompts to support users with limited literacy.
(6). Simplify data policies: Ensure privacy messages are clearly worded to be understandable across education levels.
7.3 Limitations and future research
Despite its contributions, this study has certain limitations that should be addressed in future research:
(1). Geographical Scope: The study is limited to Hormuud's WhatsApp chatbot services within Somalia. Expanding the research to include other regions or countries could provide more generalizable insights.
(2). Cross-Sectional Design: The study adopts a cross-sectional approach, which may not capture changes in customer perceptions over time. Longitudinal studies are recommended to understand the evolving impact of chatbot services.
(3). Limited Constructs: While this research focuses on four key constructs, additional factors such as customer attitudes, cultural influences, or chatbot aesthetics could be explored to provide a more comprehensive understanding.
(4). Sample Size: Although sufficient for SEM analysis, a larger sample size could enhance the robustness and generalizability of the findings.
(5). Comparative Analysis: Future studies could compare the effectiveness of chatbot services across different industries to identify sector-specific best practices.
(6). A mixed-methods approach would provide qualitative insights into users' trust and expectations. Additionally, future research should compare chatbot adoption across industries (e.g., banking vs. telecom) to assess contextual influences.
This study was reviewed and approved by the Jamhuriya University Research Ethics Committee (JUREC) under approval reference number JUREC0101/CAIT315/052024 on January 5, 2024. The research adheres to the ethical standards and guidelines established by Jamhuriya University of Science and Technology and complies with national and international ethical regulations. All participants provided informed consent before taking part in the study, and their responses were anonymized to ensure confidentiality and data protection.
Participants provided written informed consent before taking part in the study. They were fully informed about the study's purpose, their voluntary participation, and their right to withdraw at any time without consequences. The study ensured that all participant data remained anonymous and confidential, following ethical research guidelines.
I acknowledge the contributions of individuals whose study data and conclusions have informed this research, particularly Jamal Abdulkadir Mohamed, and take full accountability for all aspects of this work.
The datasets developed and reviewed in the present study can be requested by the corresponding author upon reasonable request. The study used SmartPLS 4 software (commercially licensed) for data analysis.
The authors declare no conflict of interest in the publication of this paper. The study was conducted as independent research, uninfluenced from any financial, personal, or organizational impact on its design, data collection, analysis, interpretation, or reporting.
Although Hormuud Telecom was the focus of the study, the firm did not provide any financing, data, or influence regarding the study's outcomes. The writers collected all the data solely for academic purposes.
[1] Chung, M., Ko, E., Joung, H., Kim, S.J. (2020). Chatbot e-service and customer satisfaction regarding luxury brands. Journal of Business Research, 117: 587-595. https://doi.org/10.1016/j.jbusres.2018.10.004
[2] Shawar, B.A., Atwell, E. (2007). Chatbots: Are they really useful? Journal for Language Technology and Computational Linguistics, 22(1): 29-49. http://doi.org/10.21248/jlcl.22.2007.88
[3] Araujo, T. (2018). Living up to the chatbot hype: The influence of anthropomorphic design cues and communicative agency framing on conversational agent and company perceptions. Computers in Human Behavior, 85: 183-189. https://doi.org/10.1016/j.chb.2018.03.051
[4] Yau, K.L.A., Saad, N.M., Chong, Y.W. (2021). Artificial intelligence marketing (AIM) for enhancing customer relationships. Applied Sciences, 11(18): 8562. https://doi.org/10.3390/app11188562
[5] Jenneboer, L., Herrando, C., Constantinides, E. (2022). The impact of chatbots on customer loyalty: A systematic literature review. Journal of Theoretical and Applied Electronic Commerce Research, 17(1): 212-229. https://doi.org/10.3390/jtaer17010011
[6] Cīrule, D., Bērziša, S. (2019). Use of chatbots in project management. In Information and Software Technologies: 25th International Conference (ICIST 2019), Vilnius, Lithuania, pp. 33-43. https://doi.org/10.1007/978-3-030-30275-7_4
[7] Yuen, T.H.J., Cheung, H.H. (2022). Using clinical history taking chatbot mobile app for clinical bedside teachings–A prospective case control study. Heliyon, 8(6): e09751. https://doi.org/10.1016/j.heliyon.2022.e09751
[8] Ngai, E.W., Lee, M.C., Luo, M., Chan, P.S., Liang, T. (2021). An intelligent knowledge-based chatbot for customer service. Electronic Commerce Research and Applications, 50: 101098. https://doi.org/10.1016/j.elerap.2021.101098
[9] Eren, B.A. (2021). Determinants of customer satisfaction in chatbot use: Evidence from a banking application in Turkey. International Journal of Bank Marketing, 39(2): 294-311. https://doi.org/10.1108/IJBM-02-2020-0056
[10] Rese, A., Ganster, L., Baier, D. (2020). Chatbots in retailers’ customer communication: How to measure their acceptance? Journal of Retailing and Consumer Services, 56: 102176. https://doi.org/10.1016/j.jretconser.2020.102176
[11] Phan, Q.N., Tseng, C.C., Le, T.T.H., Nguyen, T.B.N. (2023). The application of chatbot on Vietnamese migrant workers’ right protection in the implementation of new generation free trade agreements (FTAs). AI & Society, 38(4): 1771-1783. https://doi.org/10.1007/s00146-022-01416-z
[12] Hsu, C.L., Lin, J.C.C. (2023). Understanding the user satisfaction and Loyalty of customer service chatbots. Journal of Retailing and Consumer Services, 71: 103211. https://doi.org/10.1016/j.jretconser.2022.103211
[13] Sundar, S.S. (2020). Rise of machine agency: A framework for studying the psychology of human–AI interaction (HAII). Journal of Computer-Mediated Communication, 25(1): 74-88. https://doi.org/10.1093/jcmc/zmz026
[14] Chakraborty, D., Kar, A.K., Patre, S., Gupta, S. (2024). Enhancing trust in online grocery shopping through generative AI chatbots. Journal of Business Research, 180: 114737. https://doi.org/10.1016/j.jbusres.2024.114737
[15] Dahiya, M. (2017). A tool of conversation: Chatbot. International Journal of Computer Sciences and Engineering, 5(5): 158-161.
[16] Güzeldere, G., Franchi, S. (1995). Dialogues with colorful "personalities" of early AI. Stanford Humanities Review, 4(2): 161-169. https://doi.org/10.5555/212154.212175
[17] Heo, J., Lee, H.B., Kim, S., Lee, J., Kim, K.J., Yang, E., Hwang, S.J. (2018). Uncertainty-aware attention for reliable interpretation and prediction. Advances in Neural Information Processing Systems, 31.
[18] Li, M., Wang, R. (2023). Chatbots in e-commerce: The effect of chatbot language style on customers’ continuance usage intention and attitude toward brand. Journal of Retailing and Consumer Services, 71: 103209. https://doi.org/10.1016/j.jretconser.2022.103209
[19] Urbani, R., Ferreira, C., Lam, J. (2024). Managerial framework for evaluating AI chatbot integration: Bridging organizational readiness and technological challenges. Business Horizons, 67(5): 595-606. https://doi.org/10.1016/j.bushor.2024.05.004
[20] Alagarsamy, S., Mehrolia, S. (2023). Exploring chatbot trust: antecedents and behavioural outcomes. Heliyon, 9(5): e16074. https://doi.org/10.1016/j.heliyon.2023.e16074
[21] Singh, P., Singh, V. (2024). The power of AI: Enhancing customer loyalty through satisfaction and efficiency. Cogent Business & Management, 11(1): 2326107. https://doi.org/10.1080/23311975.2024.2326107
[22] Basharat, I., Shahid, S. (2024). AI-enabled chatbots healthcare systems: An ethical perspective on trust and reliability. Journal of Health Organization and Management. https://doi.org/10.1108/JHOM-10-2023-0302
[23] Immigration and Refugee Board of Canada. (2023). Somalia: Prevalence of mobile phone usage and internet connectivity, including through mobile data and the ability to use cell phones for financial transfers (2021–March 2023) [SOM201370.E]. https://www.ecoi.net/en/document/2090389.html.
[24] Mohamed, A.A. (2023). The influence of the mobile money payment on the performance of small and medium enterprises in Somalia. Technological Forecasting and Social Change, 196: 122821. https://doi.org/10.1016/j.techfore.2023.122821
[25] World Bank Group. (2017). Strategy and PPP options for supporting the ICT sector and broadband connectivity in Somalia. https://ppp.worldbank.org/sites/default/files/2022-06/Strategy_and_PPP_Options_ICT_Broadband_Somalia__Final_3_Feb_.pdf.
[26] Hormuud Telecom. (2022). Leading Somalia's digital evolution. https://www.hormuud.com/Blog/Hormuud:-Leading-Somalia%E2%80%99s-digital-evolution.
[27] Hair Jr, J.F., Matthews, L.M., Matthews, R.L., Sarstedt, M. (2017). PLS-SEM or CB-SEM: Updated guidelines on which method to use. International Journal of Multivariate Data Analysis, 1(2): 107-123. https://doi.org/10.1504/IJMDA.2017.10008574
[28] Kinney, M., Anastasiadou, M., Naranjo-Zolotov, M., Santos, V. (2024). Expectation management in AI: A framework for understanding stakeholder trust and acceptance of artificial intelligence systems. Heliyon, 10(7). https://doi.org/10.1016/j.heliyon.2024.e28562
[29] El Bakkouri, B., Raki, S., Belgnaoui, T. (2022). The role of chatbots in enhancing customer experience: Literature review. Procedia Computer Science, 203: 432-437. https://doi.org/10.1016/j.procs.2022.07.057
[30] Li, L., Lee, K.Y., Emokpae, E., Yang, S.B. (2021). What makes you continuously use chatbot services? Evidence from Chinese online travel agencies. Electronic Markets, 31(3): 575-599. https://doi.org/10.1007/s12525-020-00454-z
[31] Mehrolia, S., Alagarsamy, S., Moorthy, V., Jeevananda, S. (2023). Will users continue using banking chatbots? The moderating role of perceived risk. FIIB Business Review. https://doi.org/10.1177/23197145231169900
[32] Heo, J., Lee, H.B., Kim, S., Lee, J., Kim, K.J., Yang, E., Hwang, S.J. (2024). Intention to use determinants of AI chatbots to improve customer relationship management efficiency. Cogent Business & Management, 11(1): 2411445. https://doi.org/10.1080/23311975.2024.2411445