Mohammed Nedjar*![]() | Zohra Ait-Saadi
| Zohra Ait-Saadi![]()
© 2025 The authors. This article is published by IIETA and is licensed under the CC BY 4.0 license (http://creativecommons.org/licenses/by/4.0/).
OPEN ACCESS
This paper reports the AC dielectric strength of polyethylene terephthalate subjected to thermal aging. The aging was conducted for 8500, 6000, 4000 and 3000 hours at 130, 140, 150 and 160℃, respectively. The insulation, of 200 µm thickness, was shaped by a film sandwiched between two sheets. Square specimens, with a side length of 7.5 cm, were prepared. Virgin and aged specimens were subjected to AC dielectric breakdown. The material was analyzed using Fourier Transform Infrared (FTIR) and Thermogravimetric Analysis (TGA). The investigation reveals changes of dielectric strength versus aging time. The lessening is attributed to the increase in mean free path, which leads to the increase of charge carrier mobility. While, its increase is attributed to the reduction of charge carrier mobility. The dielectric strength is linked to the presence of defects. FTIR analysis indicates a decrease in the peak intensities of the infrared absorbance bands after aging. Furthermore, some absorbance bands disappeared after aging. The TGA thermograms exhibit an alteration of onset temperature and residues. A colour change and increased brittleness were noticed. The thermal degradation is accompanied by the formation of non-volatile residue consisting of interconnected aromatic rings. To determine the thermal lifetime of the dielectric material, additional tests over longer durations must be conducted.
polyethylene terephthalate, thermal aging, breakdown, dielectric strength, Fournier Transform Infrared (FTIR), Thermogravimetric Analysis (TGA)
Polyethylene terephtalate (PET) is widely employed in industry [1] because of its good mechanical properties, low water absorption and resistance to inorganic chemicals [2]. Yang et al. [3] presented the properties of PET: glass transition temperature Tg=80℃, melting point Tm=258℃, density r=1.40 g/cm3, relative permittivity at 50 Hz er=3.1 and hygroscopicity h=0.4% Despite of its advantages, PET degrades under thermal aging.
Panowicz et al. [2] examined the properties of PET after thermo-oxidative aging. Sheets of the material were aged in oven heated at 140℃ in such a way that air could freely flow around the samples. Specimens were withdrawn from the oven after 21, 35 and 56 days. The study shows that the quantity of the crystalline phase raises by about 8%. The glass transition and melt temperatures heighten with aging time. The tests point a raise of Young’s modulus and a shortening of elongation at rupture for the temperature range between 25 and 75℃. A change in fracture character of the insulation from ductile to brittle was noticed.
Samperi et al. [4] considered thermal aging of PET at the temperature between 270 and 370℃. The authors reported that cyclic oligomers are formed but decompose at higher temperature. Whereas the formation of anhydride containing-oligomers is well apparent. Acetaldehyde was detected in aged specimens.
McNeill and Bounekhel [5] conducted thermal stabilities of PET by thermogravimetry and thermal volatilisation analysis. The authors exhibited that the initial scission happens at the ester linkage to give terminal carboxyl and vinyl structures in the chains. For all the temperatures at which volatile products are released, carbone monoxide and carbone dioxide are formed.
Bárány et al. [6] viewed the influence of thermal aging on sheets of PET with about 0.3 mm thickness. The aging was realized, at just above the glass transition temperature, until 264 h. The researchers displayed that the aging causes an increase of Yield stress and an embrittlement of the samples.
Chipara et al. [7] reported the thermooxidative degradation of PET at 125 and 150℃. The authors pointed a decrease of elongation at break and tensile strength versus aging time. At 150℃, a transition from crosslinking to chain scissions was noted after 500 h. It was noticed that the glass transition temperature varies in function of aging time at 125℃. The researchers closed that the thermooxidative decomposition is governed by a first - order process.
For the use of an insulating material in a device, it is necessary to study the effect of thermal aging on its properties. It is useful to determine the temperature index which is the temperature corresponding to a lifetime of 20000 h. The goal of the present work is to investigate the evolution of dielectric strength of PET under thermal aging. The PET was characterised by Fourier Transform Infrared (FTIR) and Thermogravimetric Analysis (TGA).
2.1 Sample preparation
PET was supplied in the form of rollers with 200 mm thickness. The insulation is extensively used in electrical machines. The material is shaped by a film stuck between two sheets. The last protect the film inside the machine slots. For the experiments, square samples, of 7.5 cm in side, were carried out. To avert the presence of defects, the specimens were verified with a microscope. The presence of defects can generate partial discharges when the dielectric is subjected to electric stress.
2.2 Thermal aging
The prepared samples were placed in ventilated ovens regulated at 130, 140, 150 and 160℃ up to 8500, 6000, 4000 and 3000 h, respectively. After each interval of 500 h, 3 samples were deducted from the ovens.
2.3 Dielectric testing
Before dielectric testing, the samples were put in desiccators, during at least 24 h. This step allows eliminating the presence of moisture (drying).
For the breakdown tests, we employed a cell containing two circular plane electrodes made by stainless steel. One electrode has (25 ± 1) mm diameter and approximately 15 mm high. The other electrode has (75 ± 1) mm diameter and approximately 15 mm high [8].
To avoid bypasses, the tank was filled by a mineral oil: "BORAK 22". Firstly, the tested specimen was sandwiched between the electrodes. Then, AC voltage ramp of 0.5 kV/s, provided by high voltage transformer, was applied to the sample until the failure happened. The experiments were achieved at ambient temperature. After rupture, the breakdown voltage was registered and the thickness of the insulation, at the failure point, was measured. The dielectric strength was calculated as the ratio of the breakdown voltage to the thickness. When black particles due to the electrical breakdown were observed, the oil was filtered.
2.4 Fournier transform infrared (FTIR)
For the achievement of the infrared spectra, a dust of the insulating material was blended with a potassium bromide quantity (KBr). The mixture was pressed, and then the pellets were elaborated. The measurements of the spectra were archieved with JASCO FT/IR equipment in wavenumber range 4000 - 400 cm-1. The device was linked to a computer.
2.5 Thermogravimetric analysis
TGA was accomplished with NETZSCH STA 409 PC/PG at temperatures varying between 25 and 800℃ under nitrogen atmosphere. A small amount of the polymer was withdrawn and put in the crucible of the apparatus micro-balance. The warming rate is 10℃/min and programmed with a computer. The mean mass of the taken amount is about 5 mg. The equipment was connected to a computer.
3.1 Change of dielectric strength against aging time
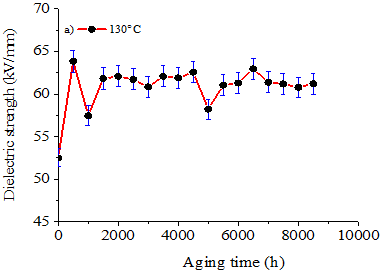
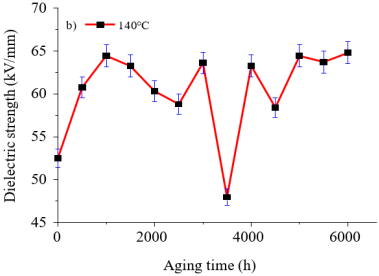
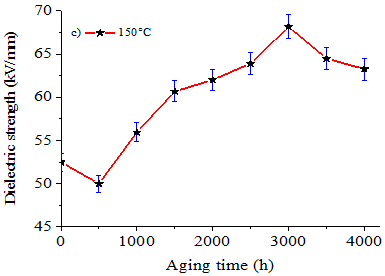
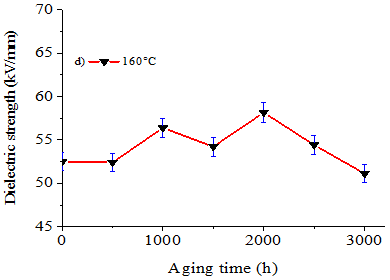
Figure 1 illustrates the change of dielectric strength (Eb) with respect to aging time at different temperatures. The change can be depicted as below:
Figure 1. Dielectric strength versus aging time a) at 130℃; b) at 140℃; c) at 150℃; d) at 160℃
Table 1(a). Mean and error bars of Eb before and after aging at 130℃
|
Aging Time (h) |
Mean (kV/mm) |
Error Bars (kV/mm) |
|
0 |
52.500 |
1.050 |
|
500 |
63.830 |
1.276 |
|
1000 |
57.460 |
1.149 |
|
1500 |
61.818 |
1.236 |
|
2000 |
62.063 |
1.241 |
|
2500 |
61.702 |
1.234 |
|
3000 |
60.842 |
1.216 |
|
3500 |
62.063 |
1.241 |
|
4000 |
61.895 |
1.237 |
|
4500 |
62.553 |
1.251 |
|
5000 |
58.228 |
1.164 |
|
5500 |
61.047 |
1.220 |
|
6000 |
61.283 |
1.225 |
|
6500 |
62.947 |
1.258 |
|
7000 |
62.368 |
1.227 |
|
7500 |
61.179 |
1.223 |
|
8000 |
60.773 |
1.215 |
|
8500 |
61.211 |
1.224 |
Table 1(b). Mean and error bars of Eb after aging at 140℃
|
Aging Time (h) |
Mean (kV/mm) |
Error Bars (kV/mm) |
|
500 |
60.749 |
1.214 |
|
1000 |
64.444 |
1.288 |
|
1500 |
63.243 |
1.264 |
|
2000 |
60.317 |
1.206 |
|
2500 |
58.794 |
1.175 |
|
3000 |
63.602 |
1.272 |
|
3500 |
47.967 |
0.959 |
|
4000 |
63.262 |
1.265 |
|
4500 |
58.407 |
1.168 |
|
5000 |
64.420 |
1.288 |
|
5500 |
63.710 |
1.274 |
|
6000 |
64.778 |
1.295 |
Table 1(c). Mean and error bars of Eb after aging at 150℃
|
Aging Time (h) |
Mean (kV/mm) |
Error Bars (kV/mm) |
|
500 |
50.000 |
1.000 |
|
1000 |
55.959 |
1.119 |
|
1500 |
60.684 |
1.213 |
|
2000 |
62.021 |
1.240 |
|
2500 |
63.913 |
1.278 |
|
3000 |
68.161 |
1.363 |
|
3500 |
64.486 |
1.289 |
|
4000 |
63.262 |
1.265 |
Table 1(d). Mean and error bars of Eb after aging at 160℃
|
Aging Time (h) |
Mean (kV/mm) |
Error Bars (kV/mm) |
|
500 |
52.410 |
1.048 |
|
1000 |
56.410 |
1.128 |
|
1500 |
54.233 |
1.084 |
|
2000 |
58.173 |
1.163 |
|
2500 |
54.430 |
1.088 |
|
3000 |
51.126 |
1.022 |
Table 2(a). Standard deviation of Eb before and after aging at 130℃
|
Aging Time (h) |
Standard Deviation (kV/mm) |
|
0 |
3.88 |
|
500 |
4.94 |
|
1000 |
5.41 |
|
1500 |
2.65 |
|
2000 |
1.46 |
|
2500 |
2.84 |
|
3000 |
3.00 |
|
3500 |
2.19 |
|
4000 |
4.03 |
|
4500 |
2.91 |
|
5000 |
4.49 |
|
5500 |
3.29 |
|
6000 |
7.23 |
|
6500 |
1.26 |
|
7000 |
6.49 |
|
7500 |
4.74 |
|
8000 |
4.21 |
|
8500 |
1.22 |
Table 2(b). Standard deviation of Eb after aging at 140℃
|
Aging Time (h) |
Standard Deviation (kV/mm) |
|
500 |
4.61 |
|
1000 |
2.63 |
|
1500 |
7.44 |
|
2000 |
3.33 |
|
2500 |
2.01 |
|
3000 |
2.62 |
|
3500 |
2.01 |
|
4000 |
8.22 |
|
4500 |
4.95 |
|
5000 |
1.79 |
|
5500 |
1.81 |
|
6000 |
4.51 |
Table 2(c). Standard deviation of Eb after aging at 150℃
|
Aging Time (h) |
Standard Deviation (kV/mm) |
|
500 |
2.20 |
|
1000 |
3.22 |
|
1500 |
4.76 |
|
2000 |
3.84 |
|
2500 |
6.22 |
|
3000 |
1.25 |
|
3500 |
4.23 |
|
4000 |
3.13 |
Table 2(d). Standard deviation of Eb after aging at 160℃
|
Aging Time (h) |
Standard Deviation (kV/mm) |
|
500 |
3.52 |
|
1000 |
3.05 |
|
1500 |
6.66 |
|
2000 |
4.77 |
|
2500 |
3.48 |
|
3000 |
4.41 |
3.2 Modification in sample colour
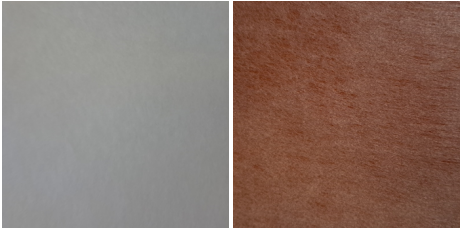
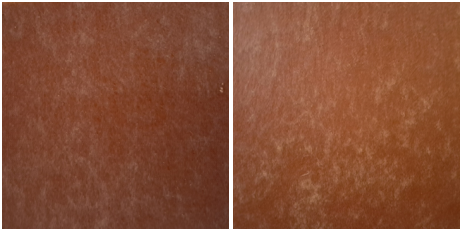
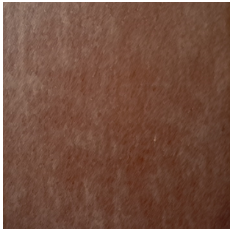
Figure 2 shows the insulation before and after aging. As it can be seen, the PET color changed after aging.
(a) (b)
(c) (d)
(e)
Figure 2. Photographs of the polymer: a) Before aging; b) After 8500 h at 130℃; c) After 6000 h at 140℃; d) After 4000 h at 150℃; e) After 3000 h at 160℃
3.3 FTIR analysis
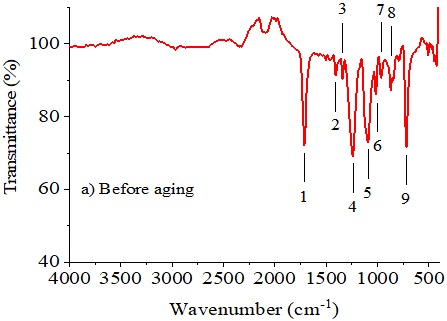
3.3.1 Before aging
Table 3 presents the significant infrared (IR) absorbance bands of PET ascribed to the vibrations as yielded by Chércoles Asensio et al. [9].
Table 3. Infrared absorbance bands
|
Absorbance Band Number |
Wavenumber (cm-1) |
|
1 |
1710 |
|
2 |
1408 |
|
3 |
1344 |
|
4 |
1238 |
|
5 |
1097 |
|
6 |
1017 |
|
7 |
962 |
|
8 |
872 |
|
9 |
717 |
Figure 3(a) shows the IR spectrum before aging. This spectrum can be summarized as follows:
- It was detected an absorbance band at 1710 cm-1 ascribed to stretching vibration of C=O, characteristic of ester.
- The absorbance bands, noticed at 1408 and 1344 cm-1, are related to symmetric and asymmetric bending vibration in-plane C−H and rocking bending of C – H − CH2−.
- The absorbance band, shown at 1238 cm-1, is allocated to the stretching vibration of C− C (O) − O.
- The absorbance band, arising at 1097 cm-1, is due to the stretching vibration of – O – C −.
- Two absorbance bands are identified at 1017 and 962 cm-1 corresponding to the bending vibration in-plane of =C − H.
- The bending vibration out-of-plane of =C − H occurs at 872 cm-1.
- The absorbance band, emerging at 717 cm-1, matches to the wagging bending vibration of =C − H.
Figure 3(a). IR spectrum before aging
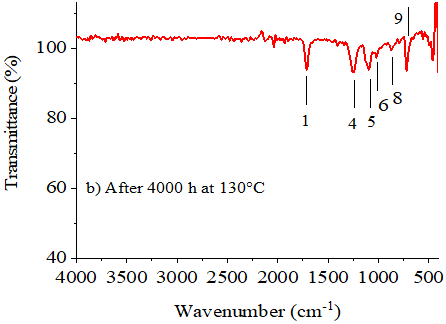
Figure 3(b). IR spectrum after 4000 h at 130℃
Figure 3(c). IR spectrum after 8500 h at 130℃
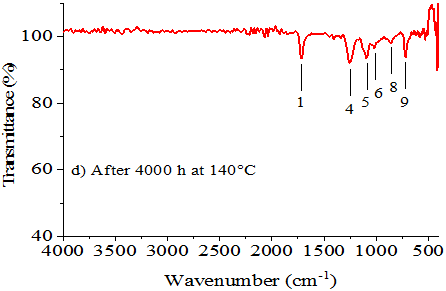
Figure 3(d). IR spectrum after 4000 h at 140℃
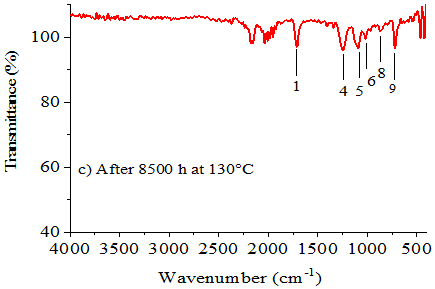
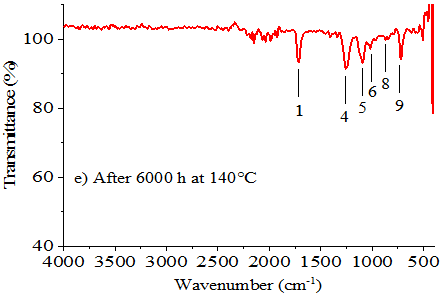
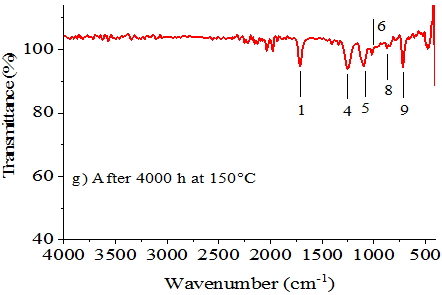
Figure 3(e). IR spectrum after 6000 h at 140℃
Figure 3(f). IR spectrum after 2000 h at 150℃
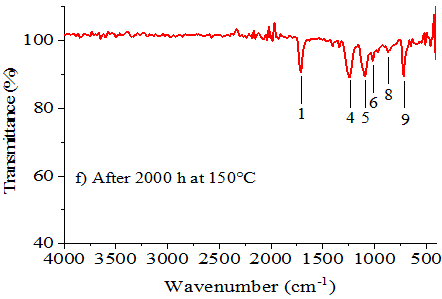
Figure 3(g). IR spectrum after 4000 h at 150℃
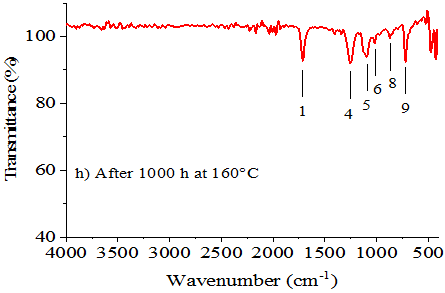
Figure 3(h). IR spectrum after 1000 h at 160℃
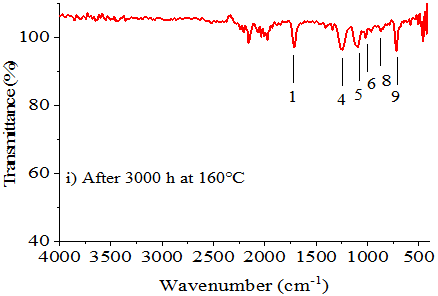
Figure 3(i). IR spectrum after 3000 h at 160℃
3.3.2 After aging
Figures 3(b)-(i) represent the IR spectra after aging. As one can notice, the peak intensities of absorbance bands at 1710, 1238, 1097, 1017, 872 and 717 cm-1, decreased. Furthermore, we remark that the absorbance bands at 1408, 1344 and 962 cm-1 vanished.
3.4 TGA thermograms
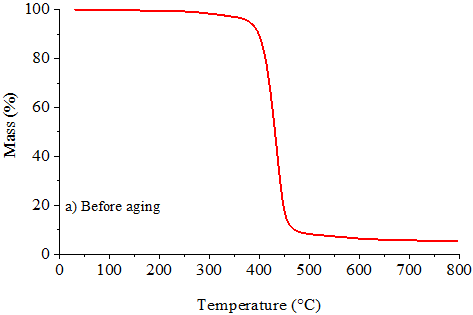
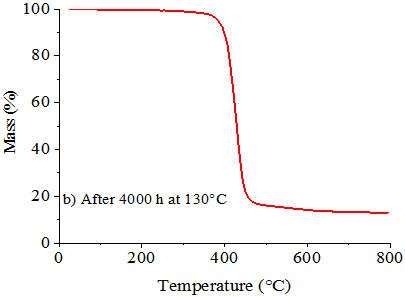
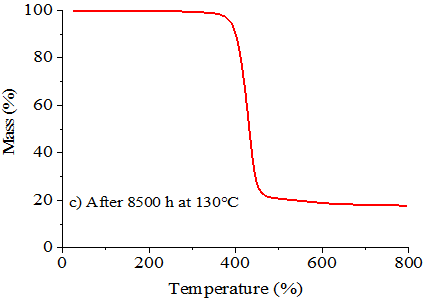
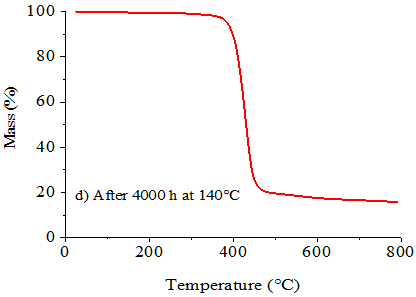
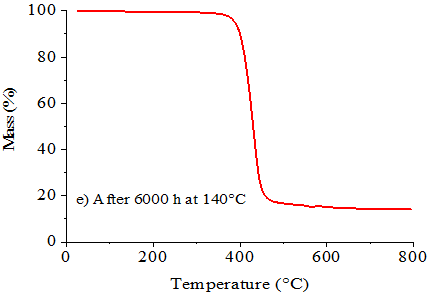
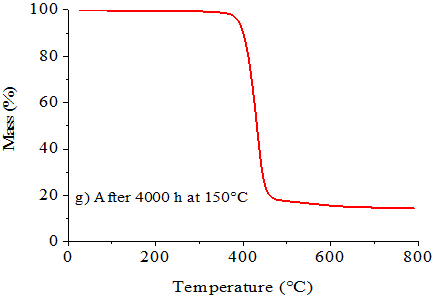
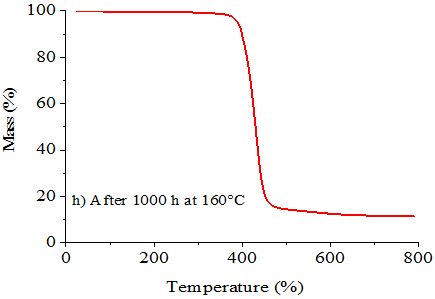
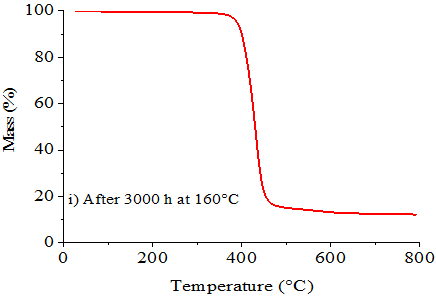
As one can observe, the TGA thermograms have the same form. Between 25℃ and 300℃, a mass loss of about 1% was remarked before and after aging. This mass loss is assigned to the evaporation of water and volatile solvents.
3.4.1 Before aging
Figure 4(a) shows the thermogravimetric curve before aging. At the beginning, the mass loss begins at around 402℃, expedites and reaches 94% at 457℃. Next, the mass slackens and it remains a residue of 5.3% at 797℃. The temperature matching to 50% mass loss is 432℃.
Figure 4(a). TGA thermogram before aging
Figure 4(b). TGA thermogram after 4000 h at 130℃
Figure 4(c). TGA thermogram after 8500 h at 130℃
Figure 4(d). TGA thermogram after 4000 h at 140℃
Figure 4(e). TGA thermogram after 6000 h at 140℃
Figure 4(f). TGA thermogram after 2000 h at 150℃
Figure 4(g). TGA thermogram after 4000 h at 150℃
Figure 4(h). TGA thermogram after 1000 h at 160℃
Figure 4(i). TGA thermogram after 3000 h at 160℃
3.4.2 After aging
Figures 4(b)-(i) give the TGA thermograms after aging.
3.5 Discussion
$r=\frac{\partial \propto}{\partial t}=A \exp \left(-\frac{E}{R T}\right)(1-\alpha)^n$ (1)
$\alpha=\frac{\omega_0-\omega}{\omega_0-\omega_f}$ (2)
where, a is a conversion, t is the time, A is the pre-exponential factor, E is the activation energy, R is universal gas constant, T is temperature, and w0, w, wf are the weight of the sample at initial time (t=0), time t and at the end of the TGA experiment, respectively, and n is the reaction order.
The dielectric strength depends on the molar mass and the chain scission. Thence it is linked to the thermal degradation kinetics.
This investigation allows deducing the following points:
[1] Planes, E., Yrieix, B., Bas, C., Flandin, L. (2014). Chemical degradation of the encapsulation system in flexible PV panel as revealed by infrared and Raman microscopies. Solar Energy Materials and Solar Cells, 122: 15-23. https://doi.org/10.1016/j.solmat.2013.10.033
[2] Panowicz, R., Konarzewski, M., Durejko, T., Szala, M., Lazińska, M., Czerwińska, M., Prasula, P. (2021), Properties of polyethylene terephtalate (PET) after thermo-oxidative aging, Materials, 14(14): 3833. https://doi.org/10.3390/ma14143833
[3] Yang, P., Tian, F., Ohki, Y. (2014). Dielectric properties of poly (ethylene terephthalate) and poly (ethylene 2, 6-naphthalate). IEEE Transactions on Dielectrics and Electrical Insulation, 21(5): 2310-2317. https://doi.org/10.1109/TDEI.2014.004416
[4] Samperi, F., Puglisi, C., Alicata, R., Montaudo, G. (2004). Thermal degradation of poly (ethylene terephthalate) at the processing temperature. Polymer Degradation and Stability, 83(1): 3-10. https://doi.org/10.1016/S0141-3910(03)00166-6
[5] McNeill, I.C., Bounekhel, M. (1991). Thermal degradation studies of terephthalate polyesters: 1. Poly (alkylene terephthalates). Polymer Degradation and Stability, 34(1-3): 187-204. https://doi.org/10.1016/0141-3910(91)90119-C
[6] Bárány, T., Földes, E., Czigány, T. (2007). Effect of thermal and hygrothermal aging on the plane stress fracture toughness of poly (ethylene terephthalate) sheets. Express Polymer Letters, 1(3): 180-187. http://doi.org/10.3144/expresspolymlett.2007.28
[7] Chipara, M.D., Notingher, P.V., Reyes, J.R., Chipara, M.I. (1998), On the thermooxidative degradation of polyethylene terephthalate. In Proceedings on the 1998 IEEE 6th International Conference on Conduction and Breakdown in Solid Dielectrics, Vasteras, Sweden, pp. 283-285. https://doi.org/10.1109/ICSD.1998.709280
[8] IEC 60243-1. (2013). International Standard: Electric strength of insulating materials-Tests methods, Part 1: Tests at Power Frequencies. International Electrotechnical Commission. https://cdn.standards.iteh.ai/samples/19861/a06c44e60b0d428a9ba07834bcc92fe5/IEC-60243-1-2013.pdf.
[9] Chércoles Asensio, R., San Andrés Moya, M., De la Roja, J.M., Gómez, M. (2009). Analytical characterization of polymers used in conservation and restoration by ATR-FTIR spectroscopy. Analytical and Bioanalytical Chemistry, 395(7): 2081-2096. https://doi.org/10.1007/s00216-009-3201-2
[10] Mohammed, N. (2022). Breakdown behaviour of polyesterimide enamelled wire subjected to thermal aging. Annales de Chimie - Science des Matériaux, 46(3): 163-168. https://doi.org/10.18280/acsm.460308
[11] Xing, Z., Gu, Z., Zhang, C., Guo, S., Cui, H., Lei, Q., Li, G. (2022). Influence of space charge on dielectric property and breakdown strength of polypropylene dielectrics under strong electric field. Energies, 15(12): 4412. https://doi.org/10.3390/en15124412
[12] Katsuta, G., Toya, A., Katakai, S., Kanaoka, M., Sekii, Y. (1991). Influence of defects on insulating properties of XLPE cable. In Proceedings of the 3rd International Conference on Properties and Applications of Dielectric Materials, Tokyo, Japan, pp. 485-489. https://doi.org/10.1109/ICPADM.1991.172103
[13] Hagen, S.T., Ildstad, E. (1993). Reduction of AC-breakdown strength due to particle inclusions in XLPE cable insulation. In 1993 Third International Conference on Power Cables and Accessories 10kV-500kV, London, UK, pp. 165-168.
[14] Chen, G., Davies, A.E. (2002). The influence of defects on the short-term breakdown characteristics and long-term dc performance of LDPE insulation. IEEE Transactions on Dielectrics and Electrical Insulation, 7(3): 401-407. https://doi.org/10.1109/94.848925
[15] Ait-Saadi, Z., Nedjar, M. (2023). Electrical properties of polyethylene terephthalate under hydrothermal aging. Mathematical Modelling of Engineering Problems, 10(1): 63-70. https://doi.org/10.18280/mmep.100108
[16] Djebara, M., Stoquert, J.P., Abdesselam, M., Muller, D., Chami, A.C. (2012). FTIR analysis of polyethylene terephthalate irradiated by MeV He+. Nuclear Instruments and Methods in Physics Research Section B: Beam Interactions with Materials and Atoms, 274: 70-77. https://doi.org/10.1016/j.nimb.2011.11.022
[17] Aljoumaa, K., Abboudi, M. (2016). Physical ageing of polyethylene terephthalate under natural sunlight: Correlation study between crystallinity and mechanical properties. Applied Physics A, 122(1): 6. https://link.springer.com/article/10.1007/s00339-015-9518-0
[18] Dubelly, F., Planes, E., Bas, C., Pons, E., Yrieix, B, Flandin, L. (2017), The hydrothermal degradation of PET in laminated multilayer, European Polymer Journal, 87: 1-13. http://doi.org/10.1016/j.eurpolymj.2016.12.004
[19] Oreski, G., Ottersboeck, B., Barretta, C., Christoefl, P., Radl, S., Pinter, G. (2023). Degradation of PET–quantitative estimation of changes in molar mass using mechanical and thermal characterization methods. Polymer Testing, 125: 108130. https://doi.org/10.1016/j.polymertesting.2023.108130
[20] Chan, J.H., Balke, S.T. (1997). The thermal degradation kinetics of polypropylene: Part III. Thermogravimetric analyses. Polymer Degradation and Stability, 57(2): 135-149. https://doi.org/10.1016/S0141-3910(96)00160-7
[21] Jenekhe, S.A., Lin, J.W., Sun, B. (1983). Kinetics of the thermal degradation of polyethylene terephthalate. Thermochimica Acta, 61(3): 287-299. https://doi.org/10.1016/0040-6031(83)80283-4
[22] Holland, B.J., Hay, J.N. (2002). The thermal degradation of PET and analogous polyesters measured by thermal analysis–Fourier transform infrared spectroscopy. Polymer, 43(6): 1835-1847. https://doi.org/10.1016/S0032-3861(01)00775-3