Marsya Aulia Rizkita*![]() | Hadi Suwono
| Hadi Suwono![]() | Singgih Dwi Prasetyo
| Singgih Dwi Prasetyo![]()
© 2025 The authors. This article is published by IIETA and is licensed under the CC BY 4.0 license (http://creativecommons.org/licenses/by/4.0/).
OPEN ACCESS
This study aims to evaluate the technical and economic performance of the hybrid solar panel and biogas power generation system to support the operation of the electric vehicle charging station in Malang City. The system is designed in two network scenarios, namely grid and off-grid, and analyzed using PVsyst software and HOMER Pro. The simulation results show that the off-grid configuration produces 1,054,693 kWh/year of energy, while the on-grid scenario achieves 985,216 kWh/year. The Performance Ratio value of the photovoltaic system is 0.83, reflecting relatively high reliability in humid tropical climate conditions. Economically, the off-grid system has a Levelized Cost of Energy (LCOE) of IDR 1,825.07/kWh with a payback period of 4.13 years, while the on-grid scenario shows an LCOE of IDR 3,610.73/kWh with a payback period of 2.64 years. This study shows that integrating hybrid systems is feasible as a clean and efficient energy solution to support the electric vehicle ecosystem, especially in urban areas with high renewable energy potential.
hybrid PV-Biogas, economic feasibility, management HOMER, PVsyst, electric vehicle charging station, tropical climate, renewable energy integration
Global energy needs increase as population growth, urbanization, and the electrification of various sectors, including transportation, increase. Dependence on non-renewable fossil fuels has had a variety of negative impacts, such as increased greenhouse gas emissions, environmental damage, and energy price volatility [1-3]. To answer this challenge, the use of renewable energy sources such as solar power and biomass is getting more attention to create a clean and sustainable energy system [4, 5]. Integrating the two energy sources in the system, hybrid energy is considered to increase the reliability of energy supply, with solar panels as the primary source, primarily during the day, and biogas generators as a complement at night or in bad weather conditions. This combination provides greater flexibility and efficiency than using a single technology [6-8].
Various previous studies have explored the system's potential, hybrid PV-biogas, in the context of remote and urban electricity. Table 1 summarizes a simulation approach using the HOMER Pro software, which is widely used to examine the technical and economic aspects of renewable energy combinations, both off-grid and on-grid scenarios. These studies show that Hybcan lowers the Levelized Cost of Energy (LCOE), significantly reduces carbon emissions, and offers financially viable, sustainable energy solutions. However, most previous studies have been limited to the general energy supply aspect and have not been specifically directed to applications in electric vehicle charging stations (EV charging stations). The electric transportation sector is one of the main focuses in global energy decarbonization.
Electric vehicle charging stations (EVCS) have relatively large power requirements and are volatile, depending on the time and intensity of use. For this reason, the energy generation system used must not only be able to meet energy needs sustainably, but also be stable in anticipating load spikes [9, 10]. About Us, hybrid PV-biogas has the potential to answer this challenge because it can take advantage of the advantages of photovoltaic technology and biogas plants synergistically [11-13]. In addition, integrating renewable energy systems in EVCS also encourages the transformation of transportation infrastructure towards zero emissions (net-zero emissions with national and global clean energy policies. However, the practical implementation of this system needs to be studied more deeply through a modeling and simulation approach based on actual location data and real operational conditions [14-16].
This research focused on Malang City as a case study location with high solar energy potential and a relatively abundant source of biomass. Using annual weather data and technical parameters of system components, system performance simulations are carried out for a hybrid PV-biogas system using Vsyst and HOMER [17, 18]. This analysis includes technical evaluation in energy generation performance and performance ratio photovoltaic systems, and economic assessments that include net present cost (NPC) calculations and LCOE [19]. In addition, this study also considers environmental aspects in the form of estimating exhaust emissions and system capacity in supporting electric vehicle charging stations with fast charging technology (quick charging). With this approach, it is hoped that a comprehensive picture of the technical and financial feasibility of the system will be obtained, in the context of a real application [20, 21].
Table 1. Research related to PV-Biogas
|
Source |
Approach |
Findings |
|
[20] |
HOMER Pro simulation for PV, biogas, and electrolyzer hybrid systems (off-grid and on-grid). |
Off-grid system with PV 200 kW, biogas 100 kW, COE: \$0.2094/kWh, NPC: \$1.92 million, CO₂ emission reduction: 95.78%. |
|
[22] |
HOMER Pro simulation on a combination of PV, wind, biogas, biomass, fuel cell, and battery. |
The PV-Wind-Biogas-Biomass-Fuel Cell-Battery configuration has the lowest COE of $0.214/kWh, suitable for off-grid villages. |
|
[23] |
PV-biogas hybrid models for EV charging, irrigation, and livestock, with sensitivity analysis to gasification ratios. |
The 110 kW mini-grid produces 395 MWh/year, LCOE $0.06/kWh, reduces 137 tons of CO₂, and produces 156 tons of biofertilizer. |
|
[24] |
Comparison of HOMER configurations for backup systems. |
The Grid-PV-Diesel system has a COE of \$0.280/kWh, an NPC of \$115,355 – more expensive and less environmentally friendly than PV-biogas. |
|
[25] |
Techno-economic modeling using HOMER Pro and life cycle analysis (LCA) of biochar. |
A 100 kW PV system + 30 kW biogas engine + 280 kWh battery yields a $0.15/kWh COE. Harmful emissions were achieved thanks to 180 tons of biochar/year with a potential carbon credit of €31.14/MWh. |
Recent studies have investigated the integration of renewable sources for EV charging infrastructure with various configurations and application contexts. Himabindu et al. [24] conducted a techno-economic assessment of PV-powered EV charging stations across four Indian cities with different solar irradiance profiles, emphasizing the importance of regional solar potential and local grid conditions in determining feasibility. Their study also recognized the utility of microgrids in supporting rooftop PV-based EV charging systems, similar to those of Irfan et al. [25] simulated hybrid systems using HOMER Pro for decentralized EV loads demonstrated that combinations such as PV–wind–biomass–battery can reduce emissions and improve reliability in peri-urban and rural zones. In another contribution, Zhang et al. [26] focused on PV-biogas hybrid systems applied to agricultural and transport sectors, presenting the benefits of dual-use systems that produce biofertilizer while supplying energy for EV charging stations.
These studies highlight the potential of hybrid renewable energy systems, but tend to focus on rural applications, generalized mini-grids, or isolated system performance. Few have assessed the performance of hybrid PV-biogas systems tailored to EV charging applications in tropical urban contexts with actual charging station load profiles. Moreover, comparative evaluations between off-grid and on-grid network scenarios under such conditions remain scarce. Therefore, this study addresses those gaps by integrating renewable energy modeling focusing on the dynamic energy needs of EV charging infrastructures under tropical climate conditions.
The novelty of this research lies in integrating the hybrid PV-biogas and electric vehicle charging applications studied simultaneously in two network scenarios: off-grid and on-grid. In addition, the modeling approach is carried out in detail by taking into account the technical data of the components, the typical load of electric vehicles, and the operational fluctuations of the charging station [27, 28]. This differs from previous studies on the generation system, which did not consider specific aspects of EV load or adaptive biogas utilization. Thus, this study makes a new contribution to the development of relevant renewable-based integrated energy system designs to support the adoption of electric vehicles, particularly in tropical regions such as Indonesia. These findings are expected to serve as a reference for policymakers, investors, and energy industry players in developing more efficient and sustainable low-emission transportation infrastructure.
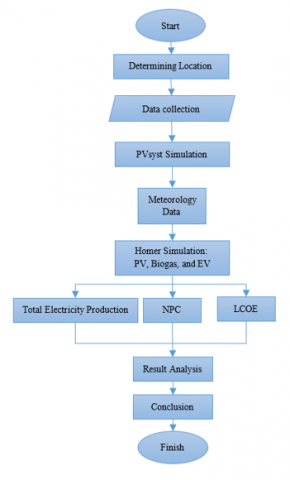
This research follows a series of structured steps to ensure that the data collected can be analyzed comprehensively and in a targeted manner. Each stage is designed to provide a smooth running of the research process and achieve the predetermined objectives. This systematic stage is the key to maintaining the accuracy and consistency of the results obtained. With a precise process flow, research results can be scientifically accounted for. A flow diagram depicting the stages in the research of PV-Biogas hybrid generation systems for electric vehicle charging stations can be seen in Figure 1. This flow picture helps visualize how each step in this study is interrelated and supportive of the others.
Figure 1. Research methodology flow diagram
2.1 Location details
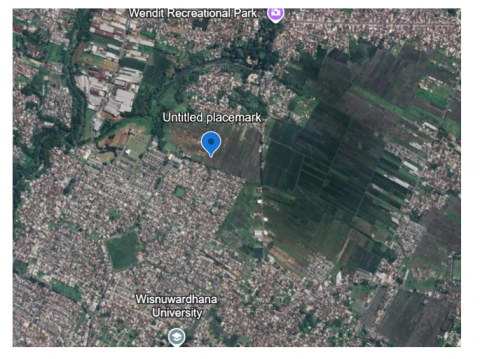
Selecting a location with adequate solar and biomass energy potential is a strategic step in designing a reliable and sustainable renewable energy system. Malang City was chosen as the research location in this study because of its cool and humid tropical climate characteristics and its position in the highlands. The city is located at the coordinates of -7.9797° South Latitude and 112.6304° East Longitude with an altitude of 440 meters above sea level, as shown in Figure 2. Based on climate data in 2024 obtained from PVsyst software version 8.1 concerning Meteonorm, Malang City shows good solar radiation potential with a global average of horizontal irradiation of 5.57 kWh/m²/day and a clearness index of 0.562 as listed in Table 2. The annual average air temperature reaches 25.8℃, the wind speed is 1.8 m/s, and the yearly relative humidity is 75.9%. At the same time, the Linke turbidity value of 4.586 indicates a fairly straightforward atmospheric condition for using solar energy. These meteorological parameters are an essential basis for the feasibility analysis and technical simulation of PV-biogas hybrid systems for electric vehicle charging stations, which are modeled using HOMER software to achieve optimal system efficiency and reliability.
Figure 2. Location coordinate point
Table 2. Malang weather data in 2024
|
Month |
Global Horizontal Irradiation (kWh/m²/day) |
Clearness Index |
Temperature (℃) |
Wind Velocity (m/s) |
Linke Turbidity [-] |
Relative Humidity (%) |
|
Jan |
5.41 |
0.500 |
25.4 |
1.8 |
4.599 |
80.8 |
|
Feb |
5.51 |
0.509 |
25.3 |
1.9 |
4.57 |
81.6 |
|
Mar |
5.34 |
0.509 |
25.7 |
1.3 |
4.484 |
80.9 |
|
Apr |
5.59 |
0.574 |
26 |
1.3 |
4.504 |
80.2 |
|
May |
5.21 |
0.599 |
26.4 |
1.6 |
4.361 |
76.2 |
|
Jun |
5.09 |
0.608 |
25.4 |
1.8 |
4.187 |
76.3 |
|
Jul |
5.31 |
0.623 |
25.3 |
2.2 |
3.992 |
72.2 |
|
Aug |
5.67 |
0.613 |
25.4 |
2.3 |
4.146 |
70 |
|
Sep |
6.03 |
0.597 |
25.7 |
2.2 |
4.354 |
69.6 |
|
Oct |
6.32 |
0.594 |
25.9 |
1.9 |
5.175 |
69.5 |
|
Nov |
5.75 |
0.533 |
25.6 |
1.4 |
5.628 |
75.5 |
|
Dec |
5.67 |
0.527 |
26 |
1.29 |
5.033 |
78.6 |
|
Year |
5.57 |
0.562 |
25.8 |
1.8 |
4.586 |
75.9 |
2.2 Schematics of solar and biogas panel hybrid systems
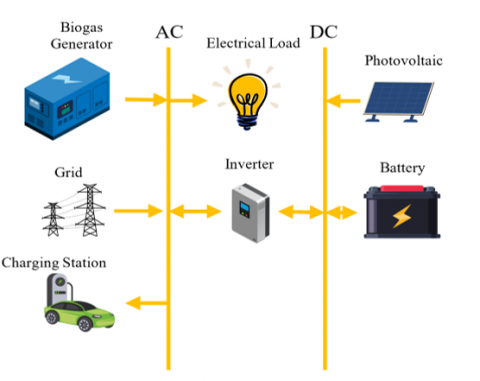
The PV-biogas hybrid system model in this study is designed to support the operation of EV charging stations with Level 3 fast charging technology, with simulations using HOMER. This study takes the example of a Hyundai Ioniq 5 car, which has a battery capacity of 58 kWh and charges using a Level 3 electric vehicle charging station with an output capacity of 150 kW and 4 operating charger units. The power for charging electric vehicles is calculated based on the average charging time of 0-80 percent within 20 minutes. The electricity tariff per kWh in Indonesia is estimated at Rp 2,466, affecting the system's total operating and maintenance costs. On the other hand, Figure 3 illustrates the configuration of a hybrid PV and biogas system, which shows how these systems can meet the energy needs of electric charging stations by utilizing a combination of renewable energy and existing natural resources.
Figure 3. PV and biogas hybrid system configuration
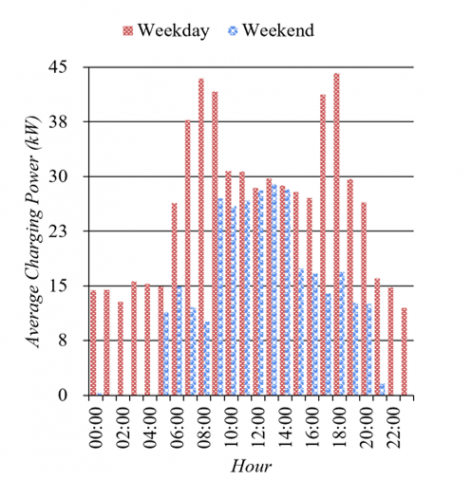
To dig deeper, Figure 4 shows the energy consumption patterns at electric vehicle charging stations, which compares energy use between weekdays and weekends. This energy consumption pattern is significant in planning capacity and investment needs for electric vehicle charging infrastructure, especially in optimizing the use of renewable energy and reducing dependence on fossil energy. In addition, Table 3 provides a detailed overview of the estimated initial investment costs, replacement costs, operational and maintenance costs, and service life for the main components in a PV-Biogas hybrid system. This information will help with long-term planning, where cost factors and component lifespan are essential considerations in decision-making for developing and operating efficient and environmentally friendly electric vehicle charging stations.
Figure 4. Energy consumption patterns at level 3 electric vehicle charging stations
Table 3. Estimated investment and lifetime of PV-biogas system components
|
Parameter |
LONGi Solar LR6-72 |
EnerStore 50 Agile Flow Battery |
Leonics MTP-4117H 300kW |
CAT-C13 Prime |
|
Initial Investment Costs |
IDR 1,500,000 |
IDR 50,000,000 |
IDR 15,000,000 |
IDR 200,000,000 |
|
Replacement Costs |
IDR 1,500,000 |
IDR 50,000,000 |
IDR 15,000,000 |
IDR 200,000,000 |
|
Operation and Maintenance Costs |
IDR 100,000 |
IDR 4,000,000 |
IDR 1,000,000 |
IDR 20,000 |
|
Lifetime |
25 Years |
30 years |
10 Years |
90,000 Hours |
2.3 Solar and biogas energy system planning and modeling
The selection of specific component models—LONGi Solar LR6-72 panels, EnerStore 50 Agile Flow batteries, Leonics MTP-4117H inverters, and CAT-C13 Prime generators—was based on a combination of market availability, proven field performance, and cost-effectiveness in the Indonesian context. These components are widely available in local and regional markets, ensuring practical applicability and future scalability. The economic analysis assumed an inflation rate of 6.6% and a discount rate of 2.54%, derived from Bank Indonesia and previous techno-economic studies relevant to renewable energy infrastructure [29, 30]. Standard photovoltaic and biogas system operational life projections selected a 25-year project lifetime.
2.3.1 Solar panels
Solar energy can be converted into electricity using solar panels that work on the principle of photovoltaics, where semiconductor materials respond to solar radiation by generating an electric current. The estimate of the electrical power that can be generated from this system can be formulated by a mathematical approach that does not take into account the effect of the temperature of the module, as explained by the following equation [31, 32]:
$P_{P V}=F_{P V} \times Y_{P V} \times \frac{G_T}{G_{T, S T C}}$ (1)
The functional dimensions of each variable in the formula are as follows:
$P_{P V}$: Power output of the solar panel system (kW)
$F_{P V}$: Performance degradation coefficient representing system loss
$Y_{P V}$: Solar panel capacity based on standard test conditions (kW)
$G_T$: Actual solar radiation intensity received by PV modules (kW/m²)
$G_{T, S T C}$: Radiation amount based on Standard Test Conditions (1 kW/m²)
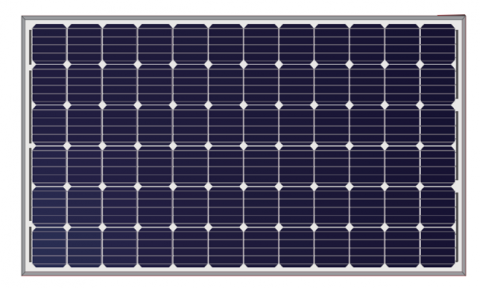
In this simulation, the photovoltaic module used is the LONGi Solar LR6-72 type, a product from Canada. The visual representation of the panel is shown in Figure 5, while the complete technical information is listed in Table 4.
Figure 5. Visual LONGi Solar LR6-72 [33]
Table 4. Technical characteristics of components
|
LONGi Solar LR6-72 |
|
|
Technical Specifications |
Technical Data |
|
Maximum Power (Pmax) |
350 |
|
Temperature Coefficient |
-0,410 |
|
Voltage at Maximum Power (Vmpp, 60℃) |
32.2 Volt |
|
Open Circuit Voltage (Voc, -10℃) |
52.2 Volt |
|
Short Circuit Current (Isc, 20℃) |
11.29 Amps |
|
Efficiency |
18.1% |
|
Leonics MTP-4117H 300kW |
|
|
Output Power Capacity |
300 kW |
|
Maximum Output Power |
300 kW |
|
DC Side Input Voltage |
480 Volt |
|
Electrical Output Frequency |
50/60 Hz |
|
Inverter Conversion Efficiency |
96% |
|
EnerStore 50 Agile Flow Battery |
|
|
Standard Operating Voltage (V) |
100 Volts |
|
Stored Energy Capacity (kWh) |
50 kWh |
|
Electrical Capacity (Ah) |
500 Ah |
|
Roundtrip Efficiency |
72% |
|
Maximum Current at Charge (A) |
150 A |
|
Maximum Current at Discharge (A) |
300 A |
|
CAT-C13 Prime |
|
|
Installed Power |
320 kW |
|
Fuel Consumption |
6.37 L/h |
|
Operating to Load Ratio |
25 % |
2.3.2 Inverter
Inverters play a key role in photovoltaic systems, with the primary function of converting the direct current (DC) generated by solar panels into alternating current (AC) compatible with household electrical and distribution network standards. In addition, the inverter is also equipped with a control mechanism to adjust the power output to be efficient and stable according to the load needs. The output power of the inverter can be calculated using the formula [34, 35]:
$P_{i n v}=V_{i n v} \times I_{i n v}$ (2)
The explanation of the variables in the formula is as follows:
$P_{i n v}$: Active power generated by the inverter (kW units)
$V_{i n v}$: Output voltage of the inverter (Volt)
$I_{i n v}$: The magnitude of the current output of the inverter (Ampere)
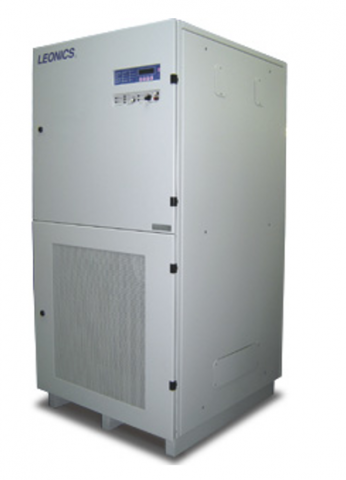
In the design of this system, a Leonics MTP-4117H inverter type with a capacity of 300 kW is used, which has been specially optimized to support solar energy applications. A physical illustration of this device can be seen in Figure 6, while the full technical details are listed in Table 4.
Figure 6. Visual Leonics MTP-4117H 300kW [36]
2.3.3 Battery
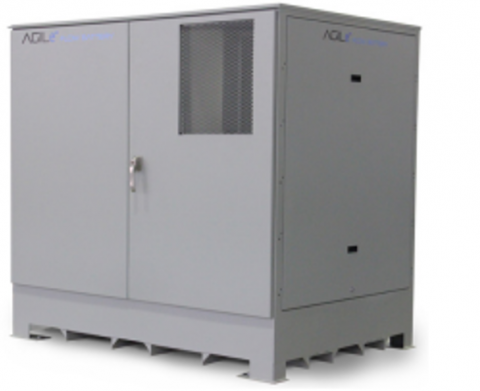
Batteries function as an energy storage medium by converting electricity into chemical energy, which can be released back as electrical energy when needed [37]. In photovoltaic systems, batteries are vital as a power buffer, mainly when solar panels do not produce electricity optimally, such as at night or in cloudy conditions. Battery capacity is generally expressed in kilowatt-hours (kWh), which indicates the amount of energy that can be stored and released. In addition, the amount of storage can also be calculated by multiplying the current and the available voltage. In this system configuration, six battery-type units are used. The EnerStore 50 Agile Flow Battery is designed to support medium- to large-scale energy loads. A visual representation of this storage system is presented in Figure 7, while details of the technical specifications of each unit can be seen in Table 4.
Figure 7. Visual EnerStore 50 Agile Flow Battery [38]
2.3.4 Generator
A generator is a device that converts mechanical energy, usually from the combustion of fuel, into electrical energy. Different types of generators can be modeled in a simulation platform like HOMER, including thermoacoustics-based systems, fuel cells, photovoltaic panels, micro-turbines, and Stirling machines. To estimate the amount of fuel consumed during the power generation process, the following mathematical equation is used, which relates output power to fuel consumption rate [13, 39]:
$F=F_0+F_1 \times P_{g e n}$ (3)
With the following explanation:
$P_{g e n}$: Power generated by the generator (in kW)
$F$: Fuel consumption rate (L/h)
$F_0$: Initial coefficient of fuel consumption (L/hour/kW)
$F_1$: Fuel consumption curve gradient (L/hour/kW)
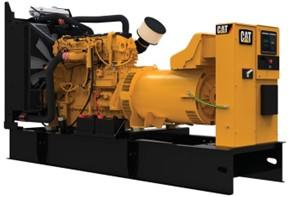
In this system model, a CAT-C13 Prime type generator is used, which is known to be reliable in high-load applications. Technical drawings of the device are presented in Figure 8, while detailed information on its operational specifications is given in Table 4.
Figure 8. Visual generator CAT-C13 prime [39]
2.4 Theoretical basis in economic analysis
The economic aspect plays a crucial role in the planning process of the energy generation system. Some key parameters to consider include the project's duration, the type of currency used, the annual inflation rate, and the discounted interest rate. Considering this project is being implemented in Indonesian territory, the rupiah is the central monetary unit in all financial analyses. Based on the latest data from Bank Indonesia and the results of previous studies, the inflation rate is assumed to be 6.6%, while the discount rate is set at 2.54%. The project is designed to have an operational life of 25 years [29, 40]. The economic value of the assets involved in this project will change over time due to inflation and discount factors. However, if the influence of these two factors can be managed effectively, then the impact on the decline in asset value can be minimized.
2.4.1 Net Present Cost (NPC)
NPC represents the project's overall cost, which has been converted to its current value through the discount process. This value considers the accumulation of various expenses over the project's life, including initial investments, annual operating costs, maintenance, and other related expenses, all of which are adjusted for the value of money over time. NPCs assess how much of the total financial burden will be incurred over the project's life, making it useful in technical and economic decision-making processes. To calculate NPCs, the following formula is used [41, 42]:
$N P C=I_0+\sum_{t=1}^n \frac{C_t}{(1+r)^t}$ (4)
Description of variables:
$I_0$: Total initial investment cost (in currency units)
$C_t$: Costs incurred in the year $t$ (e.g. annual operating or maintenance costs)
$r$: Annual discount rate (in decimals)
$n$: Project duration in years
2.4.2 Levelized Cost of Energy (LCOE)
LCOE is an economic indicator that shows the average cost of producing one unit of energy, usually in kWh units during the operating life of an energy generation system. This parameter is essential for comparing the cost efficiency of different generation technologies, both conventional and renewable, considering all the costs involved and the energy generated over the project's life. LCOE combines all cost components, including initial investment, operational, maintenance, and replacement of value-adjusted components, to the present using a specific discount rate. After discounting, this total cost is divided by the energy produced in the same project period to get an average cost per kWh. The calculation formula is formulated as follows [43, 44].
$L C O E=\frac{\sum_{t=1}^n \frac{C_t}{(1+r)^t}}{\sum_{t=1}^n \frac{E_t}{(1+r)^t}}$ (5)
Description of variables:
$C_t$: Costs incurred in the year $t$ (e.g. annual operating or maintenance costs)
$E_t$: Energy produced in the year $t$ (in kWh or other units of energy)
$r$: Annual discount rate (in decimals)
$n$: Project duration in years
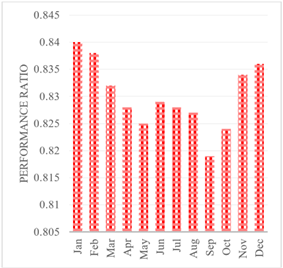
3.1 Performance ratio performance in solar power generation systems
Evaluating the performance of solar power generation systems is an essential indicator in assessing the effectiveness of converting solar energy into electricity. One of the main parameters used is the Performance Ratio (PR), which represents the efficiency of the photovoltaic system against its ideal conditions, considering factors such as temperature, radiation, and system losses. This study conducted a PR analysis to determine the variation in the monthly performance of solar panel systems operated in Malang City during 2024. The simulation results are shown in Figure 9, which shows fluctuations in the performance ratio from January to December. The highest PR value was recorded in January at 0.840, while the lowest was in September at 0.819. These fluctuations indicate the influence of seasonal climatic conditions on the solar system's output, which is the basis for designing system optimization and maintenance strategies to keep annual performance optimal.
The annual average PR of 0.83 is notably higher than many comparable systems in humid tropical settings, which typically range from 0.75 to 0.82 according to recent studies [45, 46]. This suggests that the selected PV modules and system configuration are well-suited for the local climate of Malang, benefiting from stable solar irradiation and efficient component integration. Seasonal variation, while present, remains within manageable limits and indicates consistent year-round performance. This strengthens the case for using similar hybrid systems in other tropical urban contexts.
Figure 9. Solar panel system performance ratio
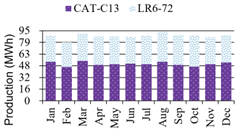
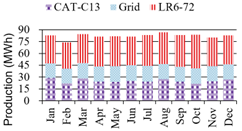
3.2 System performance evaluation through HOMER simulation
Simulations using HOMER software were used in this study to evaluate the performance of PV-biogas hybrid systems in two operational scenarios, namely off-grid and on-grid. This analysis aims to determine the contribution of each component to the total annual electrical energy production and the distribution of its consumption at renewable energy-based electric vehicle charging stations. Table 5 and Figure 10 present the results of the energy output simulation for both configurations. In the off-grid scenario, the contribution of biogas generators (CAT-C13 Prime) reached 57.1% of the total production of 1,054,693 kWh/year, while solar panels (LONGi Solar LR6-72) accounted for 42.9%. In contrast, in on-grid systems, the proportion of production from solar panels increased slightly to 45.9%, with biogas generators at 30.7%, and the remaining 23.4% coming from grid purchases, indicating a lower reliance on fossil fuels in this scheme.
In terms of energy consumption, the off-grid system recorded a total usage of 1,094,321 kWh/year, with the primary load (AC primary load) of 76.4% and the remaining 23.6% used for electric vehicle charging (EV charger served), as shown in Table 6. In the on-grid configuration, the distribution of energy consumption is relatively similar to the total consumption of 1,097,661 kWh/year. However, a small surplus of 0.3% is sold back to the grid (grid sales). The efficiency of electric vehicle charging station services is analyzed through operational indicators summarized in Table 7, showing that the system can serve 8,562 charging sessions per year with a total energy of 209.469 kWh. The average energy consumption per session reached 28.6 kWh with a daily frequency of around 20.9 sessions, indicating that the system has sufficient capacity to support the operation of medium-scale electric vehicle charging stations.
From an environmental perspective, this simulation also evaluates the potential impact of annual exhaust emissions generated by hybrid systems during 2024, as detailed in Table 8. Total carbon dioxide (CO₂) emissions reached 443,869 kg/year, the dominant component contributing to greenhouse gases. In addition, other emissions such as carbon monoxide (35.7 kg/year), non-flammable hydrocarbons (1.02 kg/year), particulate matter (33.36 kg/year), sulfur dioxide (1,813 kg/year), and nitrogen oxides (1,384 kg/year) are also of concern in environmental impact evaluation. This data shows the importance of emission reduction strategies and optimization of renewable resource-based energy systems. Thus, the integration of PV-biogas systems addresses energy needs and offers significant emission reduction potential compared to fossil-based systems in full.
In terms of environmental impact, the annual CO₂ emission of 443,869 kg/year is considerably lower than emissions from conventional diesel-based charging stations, which can exceed 750,000 kg/year for similar energy output [47, 48]. Additionally, reductions in other pollutants such as sulfur dioxide and nitrogen oxides further emphasize the ecological advantage of hybrid renewable energy systems. These findings underscore the emissions reduction potential of integrating biogas and PV in EVCS infrastructure, aligning with national and global net-zero emission targets. Such integration contributes meaningfully to decarbonizing the transportation sector.
Table 5. Electrical energy production results system
|
Off-Grid |
Component |
Production (kWh/yr) |
Percent (%) |
|
LONGi Solar LR6-72 |
452,022 |
42.9 |
|
|
CAT-C13 Prime |
602,670 |
57.1 |
|
|
Total |
1,054,693 |
100 |
|
|
On-Grid |
LONGi Solar LR6-72 |
452,022 |
45.9 |
|
CAT-C13 Prime |
302,301 |
30.7 |
|
|
Grid Purchases |
230,892 |
23.4 |
|
|
Total |
985,216 |
100 |
Table 6. Energy consumption distribution
|
Off-Grid |
Component |
Consumption (kWh/yr) |
Percent (%) |
|
AC Primary Load |
884,852 |
76.4 |
|
|
EV Charger Served |
209,469 |
23.6 |
|
|
Total |
1,094,321 |
100 |
|
|
On-Grid |
AC Primary Load |
884,852 |
74.6 |
|
Grid Sales |
3,340 |
0.3 |
|
|
EV Charger Served |
209,469 |
23.3 |
|
|
Total |
1,097,661 |
100 |
(a) Off-Grid
(b) On-Grid
Figure 10. Annual distribution of electrical energy output
Table 7. Performance recapitulation of level 3 electric vehicle (EV) charging stations
|
Performance Indicators |
Measurement Results |
|
Number of Charging Sessions per Year |
8,562 sessions |
|
Total Energy Distributed per Year |
209,469 kWh |
|
Average Energy per Charge Session |
28.6 kWh |
|
Average Daily Charge Frequency |
20.9 session for Hari |
Table 8. Annual estimated exhaust gas emissions in 2024
|
Types of Emissions |
Total Annual Emissions |
|
Carbon Dioxide |
443,869 kg/year |
|
Carbon Monoxide |
35.7 kg/year |
|
Unburned Hydrocarbons |
1.02 kg/year |
|
Particular Matter |
33.36 kg/year |
|
Sulfur Dioxide |
1.813 kg/year |
|
Nitrogen Oxides |
1.384 kg/year |
3.3 System economic analysis
Evaluation of economic aspects is a key component in assessing the feasibility of implementing renewable energy systems, especially for hybrid PV-biogas configurations used in electric vehicle charging stations. This study conducted economic analysis for off-grid and on-grid scenarios, considering several main cost components such as start-up capital, operational costs, reprocurement costs, residual value, and energy supply costs. Details of the full cost estimate are shown in Table 9, which includes various system units such as the CAT-C13 Prime biogas generator, EnerStore 50 Agile Flow battery, Leonics MTP-4117H inverter, LONGi Solar LR6-72 solar panel, and Highway Charger Level 3. The results show that the system's total cost reaches Rp 25.29 billion in the off-grid scenario. In contrast, in the on-grid scenario, the total is lower, namely Rp 10.24 billion, due to the support of the power grid, which reduces dependence on generators.
Further investment feasibility analysis was carried out by calculating financial indicators such as NPC, LCOE, simple payback period, discounted payback period, return on investment (ROI), and internal rate of return (IRR), which are summarized in Table 10. In the off-grid scenario, even though the NPC value is higher, which is IDR 25.29 billion, the system shows quite a promising financial performance with an LCOE of IDR 1,825.07/kWh, a simple payback in 4.13 years, and an IRR of 24.6%. Meanwhile, in the on-grid configuration, although the LCOE is higher by IDR 3,610.73/kWh, the main advantage lies in the faster return on capital, which is only 2.64 years in simple terms and 2.85 years in discount. In addition, the ROI on the on-grid system reaches 29%, and the IRR is even higher, at 36.4%.
The difference in LCOE and payback periods between off-grid and on-grid configurations is primarily driven by system dependency on grid electricity and component usage intensity. The off-grid system, while more capital-intensive due to higher storage and generator capacity, results in a lower LCOE over time due to reduced energy purchase costs. On the other hand, the on-grid setup benefits from immediate cost savings by leveraging existing grid infrastructure but incurs higher LCOE because of energy purchase and peak-time rates. These trade-offs highlight the importance of location-specific planning and investment strategy alignment.
Table 9. Estimated investment in PV-Biogas and EV charging integrated energy systems
|
Off-Grid |
||||||
|
Unit |
Initial Capital |
Operating Expenses |
Reprocurement Costs |
Residual Value |
Energy Supply Costs |
Overall Cost Amount |
|
CAT-C13 Prime |
IDR 200 Million |
IDR 1,22 Billion |
IDR 110 Million |
- IDR 28,3Million |
IDR 12.0 Billion |
IDR 11,6 Billion |
|
EnerStore 50 Agile Flow Battery |
IDR 400 Million |
IDR 502 Million |
IDR 0,00 |
- IDR 25.3 Million |
IDR 0,00 |
IDR 877 Million |
|
Leonics MTP-4117H 300kW |
IDR 4.50 Billion |
IDR 4.71 Billion |
IDR 5.12 Billion |
- IDR 852 Million |
IDR 0,00 |
IDR 13.5 Billion |
|
LONGi Solar LR6-72 |
IDR 1.29 Billion |
IDR 2.69 Billion |
IDR 0.00 |
IDR 0.00 |
IDR 0.00 |
IDR 3.98 Billion |
|
Highway Charger (Level 3, On-Demand) |
IDR 0,00 |
- IDR 6.55 Billion |
IDR 0,00 |
IDR 0,00 |
IDR 0,00 |
- IDR 6.55 Billion |
|
System Accumulation |
IDR 6.39 Billion |
IDR 2.57 Billion |
IDR 5.23 Billion |
-Rp. 905.6 Million |
IDR 12.0 Billion |
IDR 25.29 Billion |
|
On-Grid |
||||||
|
Unit |
Initial Capital |
Operating Expenses |
Reprocurement Costs |
Residual Value |
Energy Supply Costs |
Overall Cost Amount |
|
CAT-C13 Prime |
IDR 200 Million |
IDR 2.75 Billion |
IDR 361 Million |
- IDR 26.5 Million |
IDR 26.5 Billion |
IDR 26.7 Billion |
|
EnerStore 50 Agile Flow Battery |
IDR 50.0 Million |
IDR 62.8 Million |
IDR0.00 |
- IDR 3.16 Million |
IDR0.00 |
IDR 110 Million |
|
Grid |
IDR0.00 |
-Rp. 27.5 Billion |
IDR0.00 |
IDR0.00 |
IDR0.00 |
- IDR 27.5 Billion |
|
Leonics MTP-4117H 300kW |
IDR 4.50 Billion |
IDR 4.71 Billion |
IDR 5.12 Billion |
- IDR 852 Million |
IDR 0.00 |
IDR 13.5 Billion |
|
LONGi Solar LR6-72 |
IDR 1.29 Billion |
IDR 2.69 Billion |
IDR 0,00 |
IDR 0,00 |
IDR 0,00 |
IDR 3.98 Billion |
|
Highway Charger (Level 3, On-Demand) |
IDR 0,00 |
- IDR 6.55 Billion |
IDR 0.00 |
IDR 0.00 |
IDR 0.00 |
- IDR 6.55 Billion |
|
System Accumulation |
IDR 6.04 Billion |
- IDR 24.78 Billion |
IDR 5.48 Billion |
- IDR 881.66 Million |
IDR 26.7 Billion |
IDR 10.24 Billion |
Table 10. Total system economic evaluation
|
Off-Grid |
Net Present Cost |
IDR 25.29 Billion |
|
Levelized Cost of Energy (Rp/kWh) |
IDR 1,825.07 |
|
|
Simple payback |
4.13 Years |
|
|
Discount payback |
4.60 Years |
|
|
Return on Investment |
21 % |
|
|
Internal Rate of Return |
24.6% |
|
|
On-Grid |
Net Present Cost |
Rp. 10.24 Billion |
|
Levelized Cost of Energy (Rp/kWh) |
IDR 3,610.73 |
|
|
Simple payback |
2.64 Years |
|
|
Discount payback |
2.85 Years |
|
|
Return on Investment |
29 % |
|
|
Internal Rate of Return |
36.4% |
This analysis shows that both configurations have viable economic potential, depending on the investment objectives and operational context. Off-grid systems are superior in energy production cost efficiency per kWh, making them suitable for remote locations without power grid access. In contrast, on-grid systems offer faster returns on capital and a lighter cost structure overall, making them a rational choice in urban or semi-urban areas with the electrical infrastructure already in place. Therefore, the best configuration should be tailored to the stakeholders' location conditions, long-term goals, and financial readiness.
To strengthen the credibility and robustness of the economic assessment, a sensitivity analysis was performed by altering several key input parameters that significantly affect system feasibility. These parameters include component costs (with a variation of ±20%), biogas fuel prices (±15%), and electric vehicle (EV) penetration rates (±30%). These values were selected based on plausible fluctuations observed in local market trends and national policy adjustments. This analysis aims to evaluate how changes in these parameters influence the financial performance metrics such as LCOE and payback period for both off-grid and on-grid scenarios.
The simulation results show that the LCOE for the off-grid system ranged from IDR 1,550/kWh in the most favourable conditions to IDR 2,130/kWh in more challenging economic scenarios. Meanwhile, the on-grid configuration exhibited LCOE values between IDR 3,120/kWh and IDR 4,090/kWh. The simple payback period for the off-grid system fluctuated between 3.4 and 5.2 years, while it varied from 2.2 to 3.1 years for the on-grid scenario. These findings suggest that the proposed hybrid system retains economic viability within a reasonable range of uncertainty, reinforcing its potential scalability and applicability across different contexts. Moreover, this sensitivity assessment underlines the importance of adaptive planning and policy support in mitigating investment risks.
3.4 Research limitations
This study has several limitations that need to be considered when interpreting the results and implications of the analysis. First, the meteorological data used is sourced from PVsyst software with Meteonorm reference, which is generalized and does not include daily or seasonal microclimate dynamics locally in Malang City. This can potentially affect the accuracy of solar energy production simulation results. Second, the system simulation was carried out using HOMER software, which, although comprehensive in technical and economic calculations, has limitations in modeling component degradation, energy price variability, and electric vehicle demand dynamics in the long term. In addition, this study assumes that the energy consumption pattern of electric vehicle charging stations is fixed and linear. In contrast, in operational reality, energy demand can fluctuate highly depending on the day, season, and growth of electric vehicle users.
Furthermore, the cost and return on investment analysis are based on macroeconomic projections such as inflation, discounts, and unit prices of energy and system components that are assumed to be constant during the study period. Uncertainty over exchange rate fluctuations, energy policies, and government incentives can significantly alter the system's economic viability in real implementation. In addition, the exhaust emissions analyzed in this study only include direct emissions from biogas generators and do not consider indirect emissions from the production process and distribution of system components, so the overall environmental potential has not been fully described.
Considering these limitations, the results of this study should be positioned as a preliminary study that provides an overview of the technical and economic potential of a hybrid PV-biogas system integrated with electric vehicle charging stations. To obtain more accurate and applicable results, follow-up studies are needed with a field data-based approach, life cycle assessment, and national and regional energy policy integration. A deeper evaluation of grid stability, electric vehicle user behavior, and system response to peak load scenarios will also enhance the validity and relevance of the results of this study in the context of real implementation.
This study successfully evaluated the technical and economic potential of the hybrid PV-biogas integrated power generation system to support the operation of electric vehicle charging stations (EV charging stations) in Malang City. Based on the results of simulations using PVsyst and HOMER software, it was obtained that this system can generate annual electrical energy of up to 1,054,693 kWh in the off-grid configuration and 985,216 kWh in the on-grid scheme. Solar panels and biogas generators significantly contribute to the energy supply, with the annual average performance ratio (PR) of photovoltaic systems reaching 0.83, indicating a relatively high efficiency of the system in humid tropical climate conditions. From the economic side, the off-grid system shows an LCOE value of IDR 1,825.07/kWh with an NPC of IDR 25.29 billion and a payback period of 4.13 years. Meanwhile, the on-grid configuration has a lower NPC, IDR 10.24 billion, but with a higher LCOE, IDR 3,610.73/kWh, and a faster capital return period of 2.64 years. This indicates that both systems are financially feasible, but the selection of schemes must be tailored to the objectives of implementation and the availability of power grid access. Overall, PV-biogas hybrid systems are proving to be a reliable and sustainable solution in supporting the clean energy transition in the electric transportation sector, especially for areas with sound solar radiation and biomass potential. However, this study has limitations regarding the accuracy of input data and static economic assumptions. Therefore, advanced studies based on field data, dynamic modeling, and lifecycle analysis are needed to strengthen the validity and applicability of the system on a broader implementation scale. Future research is recommended to explore the integration of artificial intelligence for real-time energy management and the socio-economic impacts of renewable-based EV infrastructure on local communities. These aspects could provide deeper insights into system optimization and sustainable policy development.
This work was supported by the State University of Malang (Contract No.: 24.2.1201/UN32.14.1/LT/2025).
[1] Falama, R.Z., Sun, Y. (2025). Profitability analysis of renewable energy technologies for electrification and cooking in rural areas. Bioresource Technology Reports, 30: 102122. https://doi.org/10.1016/j.biteb.2025.102122
[2] Loboichenko, V., Iranzo, A., Casado-Manzano, M., Navas, S.J., Pino, F.J., Rosa, F. (2024). Study of the use of biogas as an energy vector for microgrids. Renewable and Sustainable Energy Reviews, 200: 114574. https://doi.org/10.1016/j.rser.2024.114574
[3] Rizkita, M.A., Winarno, A., Suwono, H. (2025). Harnessing sustainability and innovation in Micro, Small, and Medium Enterprises: Strategies and challenges for competitive advantage. International Journal of Sustainable Development and Planning, 20(6): 2627-2638. https://doi.org/10.18280/ijsdp.200630
[4] AbdElrazek, A.S., Soliman, M., Khalid, M. (2025). Evaluating the techno-economic viability of a solar pv-wind turbine hybrid system with battery storage for an electric vehicle charging station in Khobar, Saudi Arabia. arXiv preprint arXiv:2502.05654. https://doi.org/10.48550/arXiv.2502.05654
[5] Dodo, U.A., Ashigwuike, E.C., Emechebe, J.N. (2022). Techno-economic evaluation of municipal solid waste–fueled biogas generator as a backup in a decentralized hybrid power system. Process Integration and Optimization for Sustainability, 6(2): 431-446. https://doi.org/10.1007/s41660-022-00223-9
[6] Rouzbahani, F., Rad, M.A.V., Yousefi, H. (2025). Evaluation of hybrid renewable systems based on optimal location and bio-potential of constructed wetlands: A case study. Sustainable Energy Technologies and Assessments, 75: 104223. https://doi.org/10.1016/j.seta.2025.104223
[7] Fan, W., Huang, L., Tan, Z., Xue, F., De, G., Song, X., Cong, B. (2021). Multi-objective optimal model of rural multi-energy complementary system with biogas cogeneration and electric vehicle considering carbon emission and satisfaction. Sustainable Cities and Society, 74: 103225. https://doi.org/10.1016/j.scs.2021.103225
[8] Prasetyo, S.D., Harsito, C., Sutanto, Suyitno. (2019). Energy consumption of spray dryer machine for producing red natural powder dye and its stability. AIP Conference Proceedings, 2097(1): 030076. https://doi.org/10.1063/1.5098251
[9] Das, T.K. (2024). Assessment of grid-integrated electric vehicle charging station based on solar-wind hybrid: A case study of coastal cities. Alexandria Engineering Journal, 103: 288-312. https://doi.org/10.1016/j.aej.2024.05.103
[10] Choi, Y., Bhakta, S. (2025). Evaluating the economic and performance viability of grid-photovoltaic-powered level-2 electric vehicle charging station with battery backup. Korean Journal of Chemical Engineering, 1-7. https://doi.org/10.1007/s11814-024-00375-z
[11] Heidari, R., Jirdehi, M.A., Shaterabadi, M. (2024). Hybrid energy-based electric vehicles charging station integrated with INVELOX wind turbine: A case study of Kermanshah. Energy, 308: 132833. https://doi.org/10.1016/j.energy.2024.132833
[12] Khan, F.A., Mekhilef, S., Ramachandaramurthy, V.K., Ab Aziz, N.F., Pal, N., Yaseen, A., Alshammari, O. (2024). Design and development of grid independent integrated energy system for electric vehicle charging stations at different locations in Malaysia. Energy, 302: 131686. https://doi.org/10.1016/j.energy.2024.131686
[13] Assaffat, L., Maulidin, M.S., Trisnoaji, Y., Prasetyo, S.D., Rizkita, M.A., Arifin, Z., Choifin, M. (2025). Improving grid stability with hybrid renewable energy and green hydrogen storage: A study of Karimunjawa Island. Mathematical Modelling of Engineering Problems, 12(5): 1524-1534. https://doi.org/10.18280/mmep.120506
[14] Praveenkumar, S., Agyekum, E.B., Ampah, J.D., Afrane, S., Velkin, V.I., Mehmood, U., Awosusi, A.A. (2022). Techno-economic optimization of PV system for hydrogen production and electric vehicle charging stations under five different climatic conditions in India. International Journal of Hydrogen Energy, 47(90): 38087-38105. https://doi.org/10.1016/j.ijhydene.2022.09.015
[15] Zaid, S.A., Bakeer, A., Albalawi, H., Alatwi, A.M., AbdelMeguid, H., Kassem, A.M. (2023). Optimal fractional-order controller for the voltage stability of a DC microgrid feeding an electric vehicle charging station. Fractal and Fractional, 7(9): 677. https://doi.org/10.3390/fractalfract7090677
[16] Tjahjana, D.D.D.P., Suyitno, Rachmanto, R.A., Juwana, W.E., Prasojo, Y.J., Prasetyo, S.D., Arifin, Z. (2023). Economic feasibility of a PV-wind hybrid microgrid system for off-grid electrification in Papua, Indonesia. International Journal of Design & Nature and Ecodynamics, 18(4): 811-818. https://doi.org/10.18280/ijdne.180407
[17] Kader, K.A., Rahman, F., Nahid, N.I., Abedin, Z., Mannan, M.A. (2021). Design and analysis of an on-grid solar system using PVsyst software for commercial application. International Journal of Scientific & Engineering Research, 12(9): 316-322.
[18] Baqir, M., Channi, H.K. (2022). Analysis and design of solar PV system using Pvsyst software. Materials Today: Proceedings, 48: 1332-1338. https://doi.org/10.1016/j.matpr.2021.09.029
[19] Shrivastava, A., Sharma, R., Saxena, M.K., Shanmugasundaram, V., Rinawa, M.L. (2023). Solar energy capacity assessment and performance evaluation of a standalone PV system using PVSYST. Materials Today: Proceedings, 80: 3385-3392. https://doi.org/10.1016/j.matpr.2021.07.258
[20] Hüner, B. (2025). Feasibility and environmental analysis of biogas-based hybrid energy system using HOMER pro software: A case study for Hatay. Energy Conversion and Management, 326: 119480. https://doi.org/10.1016/j.enconman.2025.119480
[21] Vendoti, S., Muralidhar, M., Kiranmayi, R. (2021). Techno-economic analysis of off-grid solar/wind/biogas/biomass/fuel cell/battery system for electrification in a cluster of villages by HOMER software. Environment, Development and Sustainability, 23: 351-372. https://doi.org/10.1007/s10668-019-00583-2
[22] Saha, S., Kowsar, A., Debnath, S.C., Ahmed, K., Alam, F. (2025). Techno-economic analysis of integrated PV/Biogas/Wind/Hydrogen polygeneration energy systems for green transportation in Bangladesh context. Renewable Energy Focus, 54: 100707. https://doi.org/10.1016/j.ref.2025.100707
[23] Sanni, S.O., Oricha, J.Y., Oyewole, T.O., Bawonda, F.I. (2021). Analysis of backup power supply for unreliable grid using hybrid solar PV/diesel/biogas system. Energy, 227: 120506. https://doi.org/10.1016/j.energy.2021.120506
[24] Himabindu, N., Hampannavar, S., Deepa, B., Swapna, M. (2021). Analysis of microgrid integrated Photovoltaic (PV) Powered Electric Vehicle Charging Stations (EVCS) under different solar irradiation conditions in India: A way towards sustainable development and growth. Energy Reports, 7: 8534-8547. https://doi.org/10.1016/j.egyr.2021.10.103
[25] Irfan, M., Deilami, S., Huang, S., Veettil, B.P. (2023). Rooftop solar and electric vehicle integration for smart, sustainable homes: A comprehensive review. Energies, 16(21): 7248. https://doi.org/10.3390/en16217248
[26] Zhang, Y., Yan, S., Yin, W., Wu, C., Ye, J., Wu, Y., Liu, L. (2023). HOMER-based multi-scenario collaborative planning for grid-connected PV-storage microgrids with electric vehicles. Processes, 11(8): 2408. https://doi.org/10.3390/pr11082408
[27] Dhanabalan, S., Ponnusamy, T. (2025). Multi-objective tuna swarm optimization for coordinated allocation of electric vehicle charging stations and photovoltaic distributed generators in radial distribution systems. Journal of Electrical Engineering & Technology, 20(3): 1747-1760. https://doi.org/10.1007/s42835-024-02066-5
[28] Güven, A.F., Hassan, M.H., Kamel, S. (2025). Optimization of a hybrid microgrid for a small hotel using renewable energy and EV charging with a quadratic interpolation beluga whale algorithm. Neural Computing and Applications, 37(5): 3973-4008. https://doi.org/10.1007/s00521-024-10865-0
[29] Prasetyo, S.D., Trisnoaji, Y., Arifin, Z., Mahadi, A.A. (2025). Harnessing unconventional resources for large-scale green hydrogen production: An economic and technological analysis in Indonesia. Unconventional Resources, 6: 100174. https://doi.org/10.1016/j.uncres.2025.100174
[30] Apribowo, C.H.B., Nizam, M., Anwar, M., Arifin, Z., et al. (2021). An optimum design and economic analysis of renewable PV-standalone power plant for electric vehicle charging station in Indonesia. IOP Conference Series: Materials Science and Engineering, 1096(1): 012084. https://doi.org/10.1088/1757-899x/1096/1/012084
[31] Johari, N.H., Alaloul, W.S., Musarat, M.A. (2025). Recent advancements of life cycle cost analysis of photovoltaic systems: A systematic review. The International Journal of Life Cycle Assessment, 1-41. https://doi.org/10.1007/s11367-025-02474-3
[32] Prasetyo, S.D., Arifin, Z., Prabowo, A.R., Budiana, E.P. (2025). The impact of cavity in finned thermal collector on PVT performance using Al2O3 nanofluid. International Journal of Thermofluids, 27: 101284. https://doi.org/10.1016/j.ijft.2025.101284
[33] Riayatsyah, T.M.I., Geumpana, T.A., Fattah, I.M.R., Rizal, S., Mahlia, T.M.I. (2022). Techno-economic analysis and optimisation of campus grid-connected hybrid renewable energy system using HOMER grid. Sustainability, 14(13): 7735. https://doi.org/10.3390/su14137735
[34] Polat, S., Biyik, E., Öztura, H.Ş. (2025). Optimal active and reactive power scheduling for inverter-integrated PV and BESS under inverter current constraints. Electric Power Systems Research, 245: 111629. https://doi.org/10.1016/j.epsr.2025.111629
[35] Mauludin, M.S., Khairudin, M., Asnawi, R., Trisnoaji, Y., et al. (2025) In-depth evaluation and enhancement of a PV-wind combined system: A case study at the Engineering Faculty of Wahid Hasyim University. International Journal of Power Electronics and Drive Systems, 16(2): 1274-1283. https://doi.org/10.11591/ijpeds.v16.i2.pp1274-1283
[36] Tiar, B., Fadlallah, S.O., Serradj, D.E.B., Graham, P., Aagela, H. (2024). Navigating Algeria towards a sustainable green hydrogen future to empower North Africa and Europe's clean hydrogen transition. International Journal of Hydrogen Energy, 61: 783-802. https://doi.org/10.1016/j.ijhydene.2024.02.328
[37] Omar, M.A. (2025). Techno-economic analysis of PV/diesel/battery hybrid system for rural community electrification: A case study in the Northern West Bank. Energy, 317: 134770. https://doi.org/10.1016/j.energy.2025.134770
[38] Hasan, S.M.N., Bijoy, H.M., Shameem, A., Rifat, H.M., Mahadi, H.M. (2024). Feasibility and techno-economic analysis of hybrid renewable energy-based microgrid system for Kutubdia island in Bangladesh. BIO Web of Conferences, 144: 02002. https://doi.org/10.1051/bioconf/202414402002
[39] Mojumder, M.F.H., Islam, T., Rafi, M.M.R., Asef, I.H., Hasan, M., Chowdhury, N.U.R. (2025). Enhanced hybrid energy generation solutions for sustainable rural electrifications in Bangladesh: A system optimization and performance evaluation approach using HOMER Pro and MATLAB/Simulink. Journal of Energy Storage, 115: 115971. https://doi.org/10.1016/j.est.2025.115971
[40] Nasri, S., Mansouri, N., Mnassri, A., Lashab, A., Vasquez, J., Rezk, H. (2025). Global analysis of electric vehicle charging infrastructure and sustainable energy sources solutions. World Electric Vehicle Journal, 16(4): 194. https://doi.org/10.3390/wevj16040194
[41] Riayatsyah, T.M.I., Geumpana, T.A., Fattah, I.M.R., Mahlia, T.M.I. (2022). Techno-economic analysis of hybrid diesel generators and renewable energy for a remote island in the indian ocean using HOMER pro. Sustainability, 14(16): 9846. https://doi.org/10.3390/su14169846
[42] Mauludin, M.S., Khairudin, M., Asnawi, R., Trisnoaji, Y., Prasetyo, S.D., Azizah, S.R., Wiraguna, R.T. (2025). Assessing the technological and financial feasibility of PV-Wind hybrid systems for EV charging stations on Indonesian toll roads. International Journal of Sustainable Development and Planning, 20(1): 291-304. https://doi.org/10.18280/ijsdp.200127
[43] Kassem, M.A., Moscariello, A., Hollmuller, P. (2025). Reducing LCOE in geothermal energy production in Switzerland: A comprehensive review of technological, economic, and policy strategies. Energy Reports, 13: 4403-4416. https://doi.org/10.1016/j.egyr.2025.04.024
[44] Park, S., Langat, A., Lee, K., Yoon, Y. (2021). Measuring the impact of risk on LCOE (levelized cost of energy) in geothermal technology. Geothermal Energy, 9(1): 27. https://doi.org/10.1186/s40517-021-00209-9
[45] Gopi, A., Sudhakar, K., Keng, N.W., Krishnan, A.R. (2021). Comparison of normal and weather corrected performance ratio of photovoltaic solar plants in hot and cold climates. Energy for Sustainable Development, 65: 53-62. https://doi.org/10.1016/j.esd.2021.09.005
[46] Sudhakar, K., Ngui, W.K., Kirpichnikova, I.M. (2021). Energy analysis of utility-scale PV plant in the rain-dominated tropical monsoon climates. Case Studies in Thermal Engineering, 26: 101123. https://doi.org/10.1016/j.csite.2021.101123
[47] Khan, A.A., Minai, A.F., Siddiqui, M.A. (2024). Feasibility and techno-economic assessment of a 128kWp grid-tied SPV system using HOMER Pro. Journal of Physics: Conference Series, 2777(1): 012008. https://doi.org/10.1088/1742-6596/2777/1/012008
[48] Alam, M.A., Hossain, M.K., Islam, M.A., Al Mansur, A. (2024). Renewable energy mixed optimal hybrid micro-grid design for the southern part of Bangladesh. In 2024 6th International Conference on Sustainable Technologies for Industry 5.0 (STI), Narayanganj, Bangladesh, pp. 1-6. https://doi.org/10.1109/STI64222.2024.10951068