Samir Ali Amin![]() | Ismail Ibrahim Marhoon
| Ismail Ibrahim Marhoon![]() | Diana Abd Alkareem Noori Kattab
| Diana Abd Alkareem Noori Kattab![]() | Muhammad Asmail Eleiwi
| Muhammad Asmail Eleiwi![]() | Hasan Shakir Majdi
| Hasan Shakir Majdi![]() | Laith Jaafer Habeeb*
| Laith Jaafer Habeeb*![]()
© 2025 The authors. This article is published by IIETA and is licensed under the CC BY 4.0 license (http://creativecommons.org/licenses/by/4.0/).
OPEN ACCESS
In this research, authors compare alloy steel microstructure and mechanical properties when welded using gas metal arc welding (GMAW) and shielded metal arc welding (SMAW) processes. The welds were assessed through experimental testing and finite element modeling (FEM) simulation. The experimental investigation was conducted to analyze the microstructure of welded specimens, hardness and tensile strength and on the other hand, while FEM analysis was used to investigate the heat distribution and stress concentration of the welded samples. The outcomes revealed that the indicated approaches result in different changes of weld quality. The higher energy input of GMAW resulted in a larger heat affected zone (HAZ) size and consequently, a more significant decrease in tensile strength compared to that of SMAW. However, the heat affected zone in SMAW was much more homogeneous and exhibited smaller fluctuations in mechanical properties in the weld. Computational modeling was performed to complement these results. It revealed the effects of heat input on the microstructure and mechanical properties of the welds produced. These findings help define the comparison of GMAW with SMAW according to the heat input and weld quality. The study focuses on the accessibility and critically on the determination of the right type of welding technique for a given application by comparing the weld strength and heat distribution for optimum weld performance in industrial uses.
welding input heat, ANSYS, heat affected zone, low alloy steel, tensile fracture, gas metal arc welding (GMAW), shielded metal arc welding (SMAW)
Low-alloy steels primarily developed as low carbon steel alternatives in oil, power, and vehicle industries. Their objective to optimize strength-to-weight ratio and meet construction materials' needs to increase strength support its selection in many applications. Alloy steel welding causes irregular temperature alterations in both weld and base metal, resulting in the creation of a harder heat-affected zone (HAZ), higher vulnerability to cold cracking, and the existence of residual stress in the welded joints. Alloy steels have unique attributes, remarkable strength, excellent ductility and advantageous weldability. In addition, they display exceptional low temperature toughness exceeds high strength steel toughness. Alloy steel provides improved weldability when compared to high strength steel [1]. Micro alloyed or high strength low alloy (HSLA) steels are now indispensable in several industries, including shipbuilding, oil and gas transmission, offshore oil drilling, pressure vessel manufacturing, building construction, bridge construction, and storage tank fabrication.
In comparison to other varieties commonly employed by navy, high strength steel is excellent choice, including the construction of warships. Alloy steel requires weld metal that possesses exceptional qualities, specifically combination of high strength and toughness that aligns with its properties. The material is composed of alloying elements, namely V and Ti, which make up a weight proportion ranging from 0.001% to 0.1%. The acicular ferrite is the main structure observed in weld metals and wrought steels due to its remarkable strength and hardness [2-5]. Therefore, this steel is deliberately designed to possess this specific structure.
The ferrite microstructure has a modest volume fraction of pearlite, which is less than 10% [2, 3]. Within these particular grades of steel, heat-affected zone (HAZ) prone to failure because of potential hydrogen-induced cracking. The sole method of welding such steels is by utilizing a low hydrogen steel filler wire [6]. The intercritical heat treatment improved HSLA steel Charpy impact fracture by enhancing microstructure. This was achieved through production of ferritic microstructure with different morphology and returned martensite with 75% high angle grains boundaries microstructure [7]. Coarse grain presence in heat affected zone contains both martensite and austenite, enhancement hydrogen induced and stress corrosion cracking resistance. This highlights the significance of reducing the carbon percentage in this steel [8]. Friction stirs welding (FSW) an innovative method of combining solid materials that is currently gaining considerable interest for welding strong metals like steel and titanium [9-11]. FSW has emerged as straightforward, environmentally friendly, and highly effective welding technique minimizes material waste and eliminates release of radiation and toxic gases typically associated with fusion welding methods. The microstructure of base material has been altered coarse into fine grains through rapid cooling and plastic deformation, caused by the mechanical action of frictional stirring [12-14]. Steel welding process influences both temperature and composition, these two factors significantly influence welding zone and HAZ microstructure development. Fusion welding allows for the manipulation of various variables, resulting in the creation of joints with exceptional strength [1]. The primary cause of welding defects in high strength materials welding is the high temperature, which can reach approximately 2500℃, and subsequent stress that occurs as a result. However, the development of welding materials that consumed less energy has significantly helped the welding process and made it easier to use this technique for building strong steel structures [15, 16]. This study aims to assess feasibility of employing fusion welding for HSLA steel. Furthermore, it seeks to analyze and contrast the mechanical properties and metallurgical traits of fusion-welded joints in comparison between gas metal arc welding (GMAW) and shielded metal arc welding (SMAW) welded joints.
Welding is an important operation in manufacturing and construction technology especially for joining alloy steels applied in structural and mechanical purposes. Gas metal arc welding and shielded metal arc welding have been widely used. Each has their own strengths and weaknesses depending on the welding parameters for instance the heat input which plays central role in determining the microstructure and mechanical characteristics of the joining material. However, there is comparatively very little published research done comparatively on how different levels of heat input can affect the weld quality and strength, hardness and uniformity of the microstructure. This study will seek to fill this gap by performing a comprehensive comparison of GMAW and SMAW on alloy steel with emphasis on heat input effects on welded joints. The objectives of this research are first, to assess the effect of change in heat inputs on microstructure and mechanical properties of welds by conducting an experimental work; and second, to develop an FEM model for the prediction of thermal and stress fields developed during welding process. This research contributes fresh findings concerning the heat input effects and the choice between the two modes of welding using both experimental and numerical approaches. Thus, this work expands the existing knowledge of the effect of heat input on weld quality and provides guidelines on choosing the proper welding technique depending on the expected performance levels. The results presented in the paper contain practical relevance for enhancement of weld quality in industrial utilizing both the strength of weld as well as the process efficiency.
HSLA steel plate, manufactured for oil applications, were rolled and had a thickness of 4 mm. They were cut using abrasive cutting techniques to reach the specific dimensions of 100 mm × 150 mm. The cut plates were subsequently utilized to form joint configurations, depicted in Figure 1. Base metal composition presented in Table 1. Parent metal microstructure (Figure 2) predominantly ferrite with small percentage of pearlite. ESAB Company supplied the electrodes for the SMAW process and the filler wire for the GMAW process. The SMAW procedure was employed to weld the experimental steel grade, utilizing an E7018 electrode with a nominal composition of 0.03% carbon and 0.77% manganese. The GMAW technique employs the ER70S-6 electrode filler for welding applications. Table 2 presents the chemical analysis of both electrodes. The welding conditions and parameters required to produce perfect welds are specified in Table 3. The fabrication of the tensile test specimens following the requirements specified in ASTM E8M-04. The tensile qualities were evaluated using a UNITEK-94100 type electromechanical controlled universal testing equipment, produced by FIE Bluestar in India, with a maximum load capacity of 100 kilonewtons. Three specimens tested for each condition, and average value obtained recorded. Charpy impact test samples prepared to evaluate welding joint toughness. To accomplish this, a groove was precisely carved in the middle of the welded material. Smaller specimens were created since the plate was quite thin. The impact testing conducted utilizing pendulum impact test apparatus (Enkay, India) under standard temperature settings. Energy that was taken during process of fracturing was quantified. Absorbed energy quantifies material toughness.
Vicker's microhardness machine (Shimadzu Japan model HMV-2T) used in recorded microhardness profiles across welding joint zones. 0.5 N force applied during measurement, microstructure examination specimen precisely selected from welding joint, encompassing welding metal, heat affected zone (HAZ) and base metal regions. Subsequently, it underwent a polishing process utilizing many grades of emery sheets. The diamond compound, consisting of particles of 1 mm in size, was utilized for the ultimate polishing process on polishing machine. In order to reveal microstructural features of joints, specimen underwent treatment using 2% Nital solution. The microstructural investigation performed utilizing an optical microscope (MEJI Japan model MIL-7100) that coupled with image analysis software (Metal Vision). Weld metal microstructure analyzed using field emission scanning electron microscopy (FESEM) from ZEISS.
Figure 1. Prepared welding sample schematic drawing
Figure 2. Parent metal optical micrograph
Table 1. Base metal chemical composition
|
Elements |
Wt. % |
|
C |
0.06 |
|
Mn |
1.77 |
|
Cr |
0.08 |
|
Ni |
0.26 |
|
Cu |
0.27 |
|
Al |
0.04 |
|
Mo |
0.02 |
|
Si |
0.14 |
|
P |
0.01 |
|
Nb |
0.03 |
|
Ti |
0.01 |
|
Fe |
balance |
Table 2. E7018 and ER70S-6 chemical composition
|
Electrode |
E7018 |
ER70S-6 |
|
C |
0.03 |
0.09 |
|
Mn |
0.77 |
<1.6 |
|
Cr |
0.04 |
0.05 |
|
Ni |
0.02 |
0.05 |
|
Cu |
- |
0.2 |
|
S |
0.01 |
0.007 |
|
Mo |
0.52 |
0.05 |
|
Si |
0.42 |
0.9 |
|
P |
0.01 |
0.007 |
|
V |
0.03 |
0.05 |
|
Ti |
- |
- |
|
Fe |
balance |
balance |
Table 3. SMAW and GMAW experimental conditions
|
Parameters |
SMAW |
GMAW |
|
Dia. (mm) |
3.2 |
1.2 |
|
Current (A) |
150 |
200 |
|
Voltage (V) |
40 |
30 |
|
Speed (mm/min) |
100 |
250 |
|
Gas flow rate (L/min) |
- |
12 |
To examine the bead profiles, the welded plates were sliced at a right angle to their length. This was achieved by performing standard metallurgical polishing procedures, followed by etching with a 5% initial solution. The dimensions of the weld bead, including its width (W), height (h), reinforcing area (Ar), and penetration area (Ap), as shown in Figure 3, were determined using a profile projector and digital planimeter. The measurement was performed after the weld was cut and polished in a transverse direction. It is crucial to calculate the dilution percentage to comprehend the welding process impact on weld bead dimensions and penetration depth in welding joint. Furthermore, this value plays a role in new phases regulating creation within welding joint. Algorithm shown can be utilized to calculate the dilution percentage [17].
$D \%=P A / P A+P R$ (1)
where, PA is penetration area, and PR is reinforcement area.
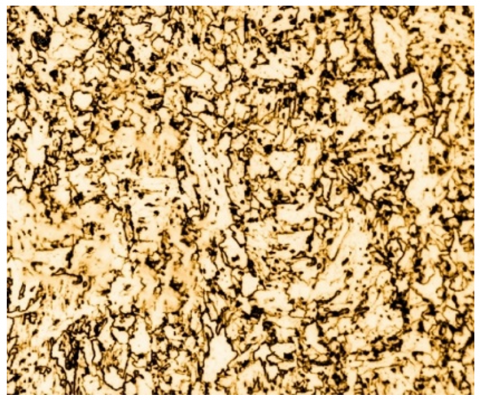
Figure 3. Optical micrograph of parent metal
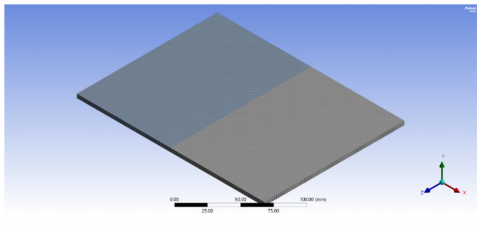
ANSYS and SOLIDWORKS software were utilized to develop a verified numerical model for this study. This model was employed to assess the dispersion of thermal energy, deformations, and remaining tensions in the process of welding. The simulation employed ANSYS ACT to simulate heat source moving. Technique analyzed series of successive steps. Thermo-analysis served as the initial foundation for establishing the domain of transient temperature. Afterward, a mechanical study was performed using nonlinear elastic plastic analysis to determine deflections and residual stress. This analysis considered transient temperature distribution as thermal burden. Welding joint finite element model is shown in Figure 4. Mesh elements contain 120,000 with 577,018 nodes. Weld zone fitted with tiny mesh that had 1 mm minimum dimension. Multi-zone meshing technique implementation in this model is most effective approach to achieve uniform geometry generation.
Figure 4. Meshing process elements of the simulation model
4.1 Heat source thermal analysis
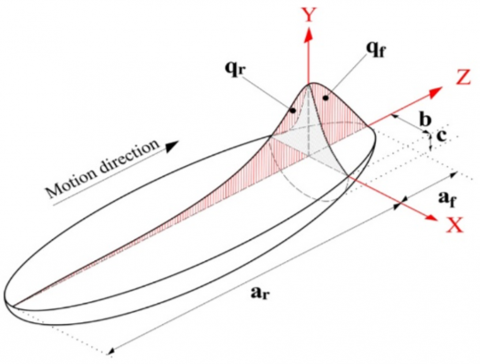
The heat input analysis by FEM was determined by combining Goldak’s double ellipsoidal heat source model (as described in reference [18]) with a conical heat source model (as described in reference [19]). These two models together create a moving volumetric heat flux. The Goldak heat source model, seen in Figure 5, demonstrates the use of coordinate transformation in thermal analysis for the cruciform welded junction. Eqs. (2) and (3) describe the power density distributions of heat flow for welded connection, specifically for the front and rear regions.
Figure 5. Goldak’s double ellipsoidal heat source application
$q_f(x, y, z)=\frac{6 \sqrt{3} f_f \eta Q}{a_f b c \pi \sqrt{\pi}} \exp \left(-\frac{3 x^2}{a_f^2}-\frac{3 y^2}{b^2}-\frac{3 z^2}{c^2}\right)$ (2)
$q_r(x, y, z)=\frac{6 \sqrt{3} f_r \eta Q}{a_r b c \pi \sqrt{\pi}} \exp \left(-\frac{3 x^2}{a_r^2}-\frac{3 y^2}{b^2}-\frac{3 z^2}{c^2}\right)$ (3)
The variables X, Y, and Z are defined as follows: X = (x – x0 – vt), Y = (y – y0) cosθ + (z – z0) sinθ, and Z = - (y – y0) sinθ + (z – z0) cosθ. The coordinates (x0, y0, z0) represent the place where the torch is directed in the (x, y, z) coordinate system. The symbols η, Q, v, and t represent welding efficiency, power input, welding velocity, and transient duration. In this context, the value of η is established as 0.8 [20]. The parameters af, ar, b, and c represent the geometry of the heat source for the modeled welding process, as seen in Figure 5. To provide a continuous heat source, it is possible to divide the heat flow between the front and back heat partitions, as described in references [21, 22].
$f_f=\frac{2 a_f}{2 a_f+a_r}$ (4)
$f_{f r}=\frac{2 a_r}{2 a_f+a_r}$ (5)
For the examination of welding operations, it is recommended to utilize a conical source model [23-25]. Volumetric heat flow density into medium mathematical definition stated below:
$Q(x, y, z)=Q_0 \exp \left(-\frac{x^2+y^2}{r_0^2(z)}\right)$ (6)
$r_0(z)=r_e+\frac{r_i-r_e}{z_i-z_e}\left(z-z_e\right)$ (7)
Volumetric heat flux density at greatest level denoted by Q0. The coordinates x, y, and z represent the point’s position in 3D system. Upper and lower cone radii dimensions are represented by re and ri correspondingly. The cone length parameters are assigned as ze and zi. The heat dissipation from all specimen exposed surfaces to surrounding environment was considered by taking into account the inherent convection (qc) and radiation (qr) using Newton’s and Stefan-Boltzmann’s laws, represented in Eqs. (8) and (9) respectively.
$q_c=-h\left(T-T_0\right)$ (8)
$q_{r=-e \sigma}\left[(T+273.15)^4-\left(T_0+273.15\right)^4\right]$ (9)
The symbol T represents temperature at surface, T0 is ambient temperature (25℃), h is heating transfer coefficient, e is emissivity, and σ represents Stefan Boltzmann constant. (Moving heat source) ANSYS ACT required the calculation of welding process power intensity and welding beam diameter. Following equation [26] can calculate the power intensity of arc welding:
$p_i=\frac{\eta \times v \times I}{\left(\pi \times(D / 2)^2\right) \times S}$ (10)
where, Pi: welding power intensity in (W/mm2), η: process efficiency, V: welding voltage in (volt), I: welding current in Amp, D: welding electrode diameter in mm, and S: welding speed in mm/sec.
4.2 Mechanical analysis
Mechanical analysis incorporated alloy steel characteristics and mechanical boundary conditions, along with temperature fields obtained from thermal analysis. The mechanical analysis utilized finite element meshes that were similar to those used for the stress element. The fixturing requirements were implemented to restrict the movement of sample’s body during welding process. The fixtures are positioned at the furthest margins of the two weldments. When doing mechanical analysis, it imperative to evaluate materials temperature dependent characteristics, including young’s modulus, thermal expansion coefficient, and yield stress. Alloy steel grades temperature dependent characteristics were obtained from reference [27]. The material model exhibits non-linear elasticity and plasticity, characterized by an isotropic strain hardening law. A constant value of 0.3 was assigned to Poisson ratio. Latent heat 256,400 J/kg, solidus and melting temperatures assumed 1463℃ and 1510℃, respectively. The strain caused by phase change in alloy steel has little impact on deformation and residual stress [28]. Furthermore, Vickers hardness test outcomes have substantiated the existence of notable disparities in hardness levels of HAZ, fusion zone, and penetration when comparing the two welding techniques. Therefore, it is imperative to take into account both strain caused by volume change and strain resulting from transformation plasticity of this investigation. Overall strain increment, denoted as dε, can precisely determine by three components specified in Eq. (11):
$d \varepsilon=d \varepsilon^{e l}+d \varepsilon^{p l}+d \varepsilon^{t h}$ (11)
where, $d \varepsilon^{e l}$: elastic strain increments, $d \varepsilon^{p l}$ and $d \varepsilon^{t h}$: defined plastic and thermal strain increments.
Weld joint fusion zone cooling rate and HAZ extent determined by welding process, which includes energy input, ensuing thermal distribution, and thickness of parent metal. Microstructure and residual stress of weldment determined by rate at which it cools. Both microstructure and residual stress serve as indicators anticipated weld metal hardness.
GMAW joint exhibits a greater level of uniformity, with a HAZ that maintains a consistent width throughout. This is contrast to SMAW method, which produces distinct and less consistent passes. HAZ increased size in SMAW is result of wider arc column produced by welding process. Both welds exhibit certain level of roughness, but the GMAW weld joint is characterized by a more prominent columnar structure. The development of columnar structure more evident during subsequent passes, demonstrating that heat transport more efficient over surface. Columnar structure development can lead to anisotropy in the mechanical characteristics of welded joints, which can affect the distribution of alloys, segregation, and particularly micro-segregation. This, in turn, can influence crack propagation during service.
5.1 Welding zone and HAZ microstructural analysis
Filler metal chemical composition and the process heat input have significant impact on weld metal microstructure in fusion welded joints. Typically, an increase in heat input causes decrease in the zone at which weld metal cools, and large grains formation [29]. Nevertheless, decrease in heat input causes rapid cooling rate, leading to fine microstructure formation. While it is true that lower heat input can result in the production of finer grains compared to higher heat input, it is important to note that inherent process characteristics also have significant impact on welded metal microstructure refinement. Between the two methods employed in this experiment, GMAW process delivers a greater heat amount to weld region compared to SMAW process. This is because the GMAW process runs with reverse polarity, with the wire electrode being positive, resulting in the generation of more heat. The rapid rate of cooling, achieved by reducing the amount of heat input, is combined with mechanical action to refine the microstructure during the refining process.
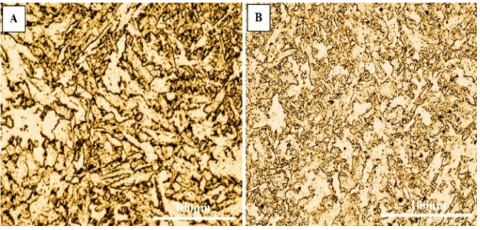
The parent plate of the alloy steel is composed of microconstituents, including bainite and acicular ferrite, along with some polygonal ferrite, as depicted in Figure 2. As expected, the alloy steel with a carbon concentration of 0.06% contains a small quantity of pearlite. An in-depth analysis was conducted to examine morphology of microstructure in weld metal and weld interface. The objective was emphasized distinctions observed in HAZ and welding metal different parts. Figure 6 (A) illustrates SMAW root zone microstructure, showing various ferrite morphologies existence, including Widmanstatten ferrite, acicular ferrite, and polygonal ferrite. Figure 6 (B) displays GMAW microstructure, weld metal main component’s structure mostly consists Widmanstatten ferrite, acicular ferritic, and bainite. Observation provides evidence that accelerated cooling rate in GMAW has impacted prior austenite grains size, leading to grains formation have higher number of sites for phases creation that tend to nucleate at these grains boundaries, such as bainite and Widmanstatten ferrite [30]. When comparing GMAW with SMAW, it is clear that SMAW shows coarsened ferrites and pearlite presence. These characteristics indicate a slower cooling rate in SMAW, which enables the formation of pearlite. This trait is not present in GMAW. Due to increased heat input, phase change took place in GMAW weld metals. Parent metal microstructure, consisting primarily ferrite and a tiny pearlite amount, transformed due to heat input and chemical composition. This transformation resulted in acicular ferrite formation, small retained austenite amount, and martensite. Differences in filler metal and parent metal chemical composition resulted changes in temperature in both welding and base metal, and investigated welding metal solidification behavior. Welding joint and HAZ cooling rate decreases can lead to a reduction in interfacial energy between austenite and ferrite, resulting in acicular ferrite development. Acicular ferrite microstructure can achieve both high strength and high toughness [31]. Acicular ferrite exhibits greater microstructural stability than bainite at elevated temperatures [32]. GMAW process’s rather sluggish cooling rate resulted in martensite and acicular ferrite creation along with some remaining austenite in weld metal area. In addition, filler metal inclusion also plays crucial function in weld metal microstructure. It impossible to achieve uniform weld metal with fusion welding methods.
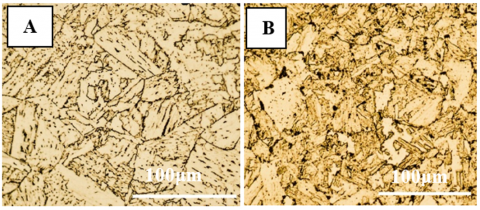
Figure 6. (A) SMAW welding zone morphology; (B) GMAW welding zone morphology
Figure 7. (A) SMAW HAZ morphology; (B) GMAW HAZ morphology
In this research, Figure 7 presents examined typical HAZ microstructures. HAZ can classified into two distinct regions with contrasting microstructures: coarse grain (CG) and fine grain (FG). Nevertheless, size of grains increases as approach fusion zone boundary. The microstructure undergoes a transition from mostly needle-like ferrite in the parent metal to a combination of polygonal ferrite and bainitic ferrite as fusion zone is approached. An important distinction between the two processes lies in GMAW’s superior grain structure. SMAW thermal distribution causes from previously deposited passes reheating which result in bigger welding arc column. Impact of tampering becomes apparent when using a larger grain size for SMAW, as shown in Figure 7. GMAW (HAZ) grain size was 25 µm which is larger than SMAW (HAZ) grain size with 15 µm. Higher heat input in the HAZ region results in coarser grain structure in the same region which may have an adverse effect on weld strength in the GMAW method. SMAW causes finer grains hence weld mechanical properties of the weld are higher.
5.2 Microhardness profile
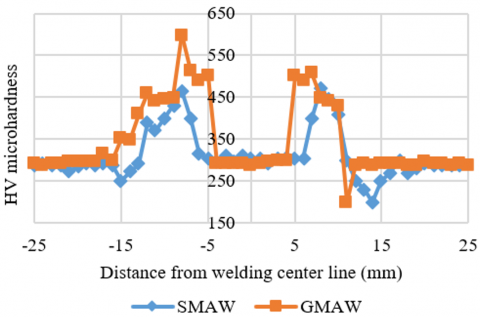
The microhardness variations across the weld illustrated in Figure 8. Received parent metal hardness was approximately 290 HV. Welding zone hardness recorded min. value 320 HV and max. value 410 HV, this alteration depends on test spot grain size and microstructure phases in this spot. SMAW and GMAW joint's welding metal regions microhardness starting from 330 HV to 370 HV, based on testing location grain size and phases. SMAW and GMAW joints HAZ recorded very high hardness profile compared with welding zone and base metal.
Microhardness results in Figure 8 illustrate that lower hardness of GMAW and SMAW joints rising towards fine grains HAZ (FGHAZ) and lower when moving towards the coarse grains HAZ (CGHAZ) due to microstructure lattice distortion in weld metal compared to fine and coarse grain heat affected zone. hardness profiles analysis of welded joints concerning the resulting strength characteristics at highest and intermediate strength levels. Greater hardness observed in regions where initial austenite grain size less than that closer to fusion line [33]. There is also increased hardness resulting from the micro segregation of key alloying elements in certain areas [34, 35]. Hardness as defined the measure of its strength and its resistance against deformation. The higher the hardness the better the welded joints. GMAW base metal hardness was 220 HV, while the HAZ recorded 180 HV which is lower than the base metal, the weld metal hardness value was 200 HV which consider intermediate value comparing with base metal. SMAW base metal hardness was 220 HV while the HAZ recorded 190 HV which higher than GMAW’s HAZ hardness. Weld metal hardness was 210 HV which is above GMAW weld metal. GMAW results in a lower hardness in HAZ due to high heat input. SMAW has higher hardness in HAZ and weld metal though and its tool indicates that at somebody region is stronger relief. Due to the less refined grain structure in HAZ during GMAW, it bears lower hardness because coarser grains have short neighborhood boundaries for offering resistance to deformation. This leads to formation of lighter, less strong weld zone especially in the HAZ. SMAW introduced lower heat Input and finer grain’s structure and as known grain boundary strengthening mechanism, therefore it has higher hardness than other welds. This also improves weld metal and HAZ strength in plastic deformation terms.
Figure 8. Microhardness profile of SMAW and GMAW weldments
5.3 Welding process effects on tensile results
Parent metal and welded joints tensile strength presented in Table 4. Base metal yield and tensile strength were 442 MPa and 617 MPa. SMAW joint yield and tensile strength were 477 MPa and 581 MPa, which 5.2% lower than base metal. However, GMAW joint yield and tensile strength were 491 and 583 MPa, respectively, which 5.1% lower than parent metal. Parent metal elongation percentage is 26%, whereas GMAW joint elongation percentage is 20%.
Table 4. Base metal and welded joints mechanical properties
|
Joint |
BM |
SMAW |
GMAW |
|
Yield strength |
442 MPa |
477 MPa |
491 MPa |
|
Tensile strength |
617 MPa |
581 MPa |
583 MPa |
|
Elongation % |
26 |
17 |
20 |
|
Fracture location |
center |
BM |
BM |
This indicates 21% reduction in ductility caused by GMAW technique. Furthermore, SMAW joints elongation percentage is 17%, which is 35% lower than parent metal. Joints manufactured using GMAW showed greater ductility values than SMAW joints. Metal welded together relatively more robust, and characteristics of joint regulated by chemical composition and microstructure of welding metal. Elements such Nb, Ti, V, etc., form strong carbides/nitrides, had very low solubility in ferrite and austenite. Typically, precipitates occur as finely dispersed carbides, nitrides, and/or carbonitrides, which contribute to material strength by precipitation hardening, which explanation yield strengths rises in all joints compared to parent metal yield strength.
Interaction between solute atoms and sliding dislocations responsible for yield point elongation [36]. By introducing filler metal and subjecting material to high heat, slight increase in molybdenum and nickel content can lead to ferrite with martensite and preserved austenite development. These findings suggest that fusion weld joints strength values decrease by 5% compared with parent metal when austenite grain size increases during heating and isothermally maintained specimens [37]. Ductility variation with microstructure and chemical composition more intricate, any parameters except grain size, that enhance strength would reduce ductility. In addition, steel ductility significantly influenced by MnS inclusion and varies depending on size, shape, and volume percentage. Inclusions function as stress inducers and fractures readily begin at inclusions, either as inclusions cracking result or inclusions separation from matrix [38]. In both instances, acicular ferrite nucleation formation due to Mn depletion zone around inclusions caused by MnS precipitations on Ti2O3 may result decrease in welding joint ductility compared with parent metal.
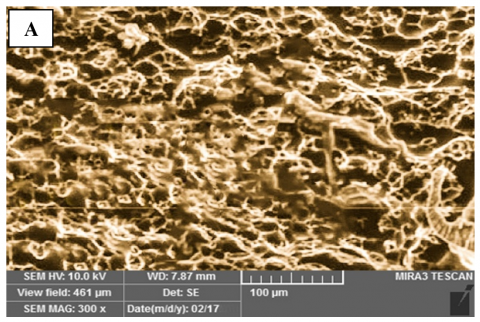
Figure 9. Tensile specimens SEM fractography (A) SMAW (B) GMAW
Analyzed utilizing scanning electron microscope were shattered surfaces of specimens from tensile tested welding joints. Figure 9 exhibits tensile specimens fractography. Welding joints failure modes subjected to tensile testing are predominantly ductile, and characterized by acceptable plastic deformation. This may be observed from fracture location and fractured surface appearance, as depicted in Figures 9(A) and (B). There were no instances of brittle cleavage fracture observed in the fractography of the tensile tests shown in Figure 9 at high magnification. Nevertheless, a noticeable disparity in the fracture pattern was discovered. The existence of voids and variations in the size of the dimples (as shown in Figure 9(A)) indicate that the ductile fracture of the SMAW joint resulted in significant decrease in tensile strength.
Micro-pores significant number were detected, which could explain the decreased tensile strength seen in GMAW joints. Figure 9(B) displays surface that exhibits a rough and elongated dimple fracture, might potentially cause by ductile shear. Elongated voids and coarse dimples presence indicates the occurrence of localized slip, which therefore leads to increased ductility without compromising tensile strength of GMAW joint. The lower tensile strength observed in GMAW welds has been attributed to the coarse grain size development and brittle phase existence such as martensite in heat affected zone. These factors give rise to an ability in the welds to resist tensile (pulling) stresses that is lesser than the base material. Because of grains refinement as well as stable microstructures formation such as pearlite or ferrite in HAZ, SMAW welds are comparatively stronger in tensile. Increase in grain size refinement is on the other hand improves weld strength by increasing the dislocation movement resistance, thus increasing the overall welded joint tensile strength.
5.4 Welding joint heat distribution profile analysis
ANSYS conducts calculations on welding joint central area to ascertain maximum temperature distribution, which subsequently documented for both models. The purpose of these experiments was determining HAZ and fusion zone temperature distributions and dimensions, also determining penetration depth for each model. Figures 10(A) and (B) depict welding temperature profile and HAZ during SMAW and GMAW welding processes. Measurements were obtained at precise welding joint midpoint. The given findings demonstrate a direct association between inter pass temperature and HAZ, fusion zone, and welding penetration dimensions. Figures 10(A) and (B) depict the thermal distribution in a welding joint that has been welded using SMAW and GMAW.
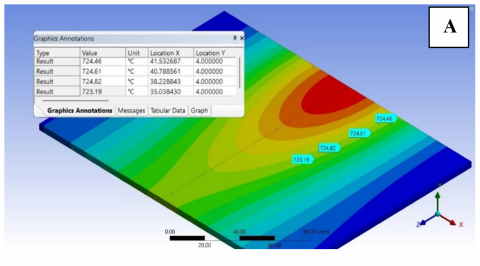
The minimum HAZ width situated at 35 mm distance from SMAW sample center line, while 64.8 mm maximum GMAW sample HAZ width observed. The HAZ in ANSYS determined by calculating base metal temperature range, which is 723℃, on both sides. This temperature range is crucial as it is the range at which phase transitions take place, and no additional phase changes occur beyond this threshold. The results demonstrated a clear and direct relationship between the amount of heat applied during welding and HAZ width. This validates that HAZ is most susceptible area during welding process, and its mechanical properties are impacted by the grain size and rate of cooling during welding. The prolonged cooling time caused by the elevated welding temperature led to a notable alteration referred to as the grain growth reaction. Furthermore, research has shown that austenitic steels often experience a loss of their amorphous state after being welded or exposed to high temperatures for an extended time [39]. The microstructure undergoes constant modification because of machine operations, welding, and heat treatment. The challenge occurs in metal welding when the process of recrystallization and grain development leads to the creation of sizable grains. The presence of this chemical increases the likelihood of liquidation cracking, which is affected by the distribution of welding temperatures and HAZ breadth [40].
Figure 10. Welding joint heat distribution and HAZ width (A) SMAW (B) GMAW
5.5 Welding joint deformation model analysis
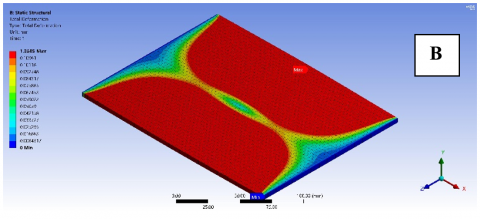
Reducing distortion is a key objective of the different welding techniques. Welding generates thermal energy, which modifies the composition of the material. This information is established. This transition is attributed to the processes of recrystallization, grain development, and precipitate dissolution. It is important to note specific alloy steels characteristics render very susceptible to deformation during the welding process. Welding induces distortion in the form of potential material deformation or displacement. This distortion compromises the structural integrity and functionality of welded constructions, potentially resulting in issues. The variation in transverse shrinkage across the thickness of the specimen was the cause for this. By employing the concept of significant displacement, mechanical analysis investigates the deformations associated with welding. This investigation utilizes the welding process thermal source profiles, specifically deformation in x-direction, within specific boundary conditions. Figure 11 displays both techniques ANSYS simulation models deformation outcomes. The welding joint centerline had most distortion in all three models due to the concentrated heat input and the constraints at both ends. Deflection for SMAW model was 1 mm representing about 25% of the weldment’s thickness at the welding end. The deflection for GMAW was recorded 1.35 mm at the same point, an increasing about 34% from the SMAW deflection due to the increase in welding heat. GMAW technology works with DC reverse polarity that produces 70% welding heat in the welding electrode. After this point, the deflection dramatically drops to about 10 to 8% of the maximum deflection.
Figure 11. Welding joint deformation (A) SMAW (B) GMAW
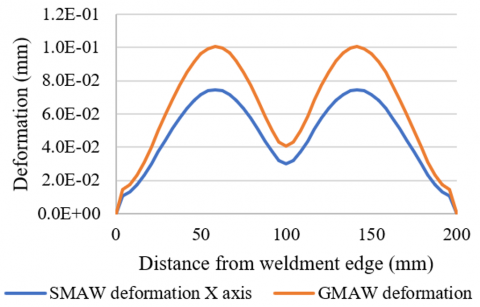
Figure 12. Welding deformation along the X axis: SMAW and GMAW
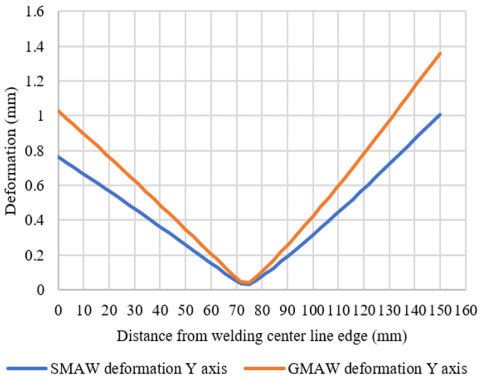
Figure 13. Welding deformation along the Y axis: SMAW and GMAW
To calculate and observe the deformation across the X-axis and the Y-axis of both welding technology the deformation for both axes is plotted based on the values produced from the ANSYS. The diagrams in Figures 12 and 13 illustrate two maximum deformation zones for the X-axis at the HAZ for both sides and one maximum deformation point at the welding joint end for both welding process models.
5.6 Numerical models assumptions and their impacts on results
Alloy steel engineering properties such thermal conductivity, specific heat, elasticity modulus, yield strength, and tensile strength are assumed constant or follow idealized temperature and phase independent models. If the material properties do change as such with temperature or during phase transformations, the FEM model may not incorporate all the aspects of welding properly. For instance, changes in alloy steel material properties at different temperature render the thermal distribution, HAZ formation, and welds mechanical characteristics less comprehensive. The thermal gradients and Heat Affected Zone might be not accurate predicted and may lead not accurate estimation of weld quality and mechanical properties. when welding using processes like GMAW the temperatures have a serious impact on material properties. Heat source which in SMAW and GMAW is welding arc, represented in many cases by a uniform or simplified Gaussian distribution of heat flux with a constant power supplied to the weld. This assumption amends widely appreciates real and highly sensitive character of heat source in welding where heat input can be varied by arc stability, welding speed and electrodes behavior etc. Indeed, it has been found that the heat flux is not necessarily uniformly distributed and its distribution affects the rate of cooling, the HAZ produced and the microstructure. These assumptions at each node and element are uniform heat distribution that might inaccurate the temperature distribution and cooling rates in the weld zone that influences the HAZ extent in GMAW due to high heat input. It is believed that cooling rate has slope and is usually modeled according to specific pattern such as standard cooling rates (convection, radiation) alongside characteristics of the material of the object being cooled. cooling rates only depend on complicated give factors such as welding joint geometry, environment conditions like temperature and moisture, and methods applied like air cooling or water cooling. Some of these factors may not be capture by the FEM model used in this research. The actual cooling rate differs which will further extend the discrepancies in HAZ sizes and the structure type forms, that is martensite or pearlite. This can cause an effect in the forecast of other properties such as tensile strength and hardness.
To model welds and weld’s mechanical properties and microstructure predictions, FEM approach used in this study. Despite these, FEM is a strong tool that assists in analysis of the welding process, however, applying FEM in welding simulation is characterized with limitations and challenges. Due to the assumption made in the FEM simulations, the weld geometry is often reduced to an ideal one or symmetrical, while in practice may exist certain imperfections or variations in the weld bead. Absence of weld imperfection representation may be used to produce erroneous predictions of weld strength, or toughness, and even fatigue resistances. Occasionally the simulation may not accurately describe features of the molten weld pool including convective heat transfer and fluid movement. This may certainly influence the generation of the weld metal as well as the development of its microstructure. Welding is the process that consists of four physical mechanisms, heat transfer, stress distribution, phase transformations and material flow. As for most FEM models, these interactions can be simplified or they are considered as distinct interactions.
HAZ microstructure examination pictures in Figures 6 and 7 taking from about 4 to 6 cm from welding center line to observed the microstructure and grain size changes in this distance, the results clearly reflected the welding heat input effects when comparing it with base metal microstructure pictures, after this distance the examination shows no changing in base metal microstructure or grains size which validated the HAZ distance measurements from the simulations models and validated the heat distribution models. The micro hardness test results in Figure 8 also validated the heat distribution effects and prove its impacts on different welding joint zones, Figure 8 illustrated high hardness values an adjacent area to fusion line due to small grains size in this zone and then hardness values start in lower down. These results also proved heat and stress distributions models.
The paper offers detailed conclusions from the experimental and analytical studies at the welding of alloy steel plates using GMAW and SMAW strategies. Below are key conclusions derived from each principal result:
The research results illustrated that GMAW is suitable for high-speed and high-throughput activities but there are problems when there is demand for fine microstructures and stronger heat affected zones. Yet for industries where weld strength and toughness are crucial that is where SMAW can come in handy its potential of delivering less yet smaller HAZs as well as fine grains that are mechanically superior in nature. While manufacturing pressure vessels or storage tanks, occasionally welds will be under high tensile stress and pressure and cannot crack, but SMAW could be used in the critical weld zones (such as HAZ) to get a better tensile strength and fatigue strength. This is because under cyclic loading the resistance capability of the vessel would be enhanced for the longer term.
Heat Input controls are significant since they determine the right mechanical characteristics needed in the material. This knowledge enables manufacturers to control welding parameters including arc voltage, current and welding speed in order to optimize weld speed as well as weld quality. In the automotive industry where material strength and component light weighting is critical some level of heat input control and therefore the use of SMAW or lower heat input GMAW could enhance critical welds on frames structures, suspension system and engine parts in turn enhancing their performance. The possibility to manage the HAZ size decreases the possibility to get post-weld cracking and fatigue failure.
[1] Mohammed, M.S., Hamdey, M.D., Kareem, A.H., Majdi, H.S. (2024). Investigation of copper backing plate effects in stainless steel welding distortion, heat distribution, and residual stress. International Journal of Heat and Technology, 42(4): 1434-1446. https://doi.org/10.18280/ijht.420433
[2] Lee, C.H., Bhadeshia, H.K.D.H., Lee, H.C. (2003). Effect of plastic deformation on the formation of acicular ferrite. Materials Science and Engineering: A, 360(1-2): 249-257. https://doi.org/10.1016/S0921-5093(03)00477-5
[3] Show, B.K., Veerababu, R., Balamuralikrishnan, R., Malakondaiah, G. (2010). Effect of vanadium and titanium modification on the microstructure and mechanical properties of a microalloyed HSLA steel. Materials Science and Engineering: A, 527(6): 1595-1604. https://doi.org/10.1016/j.msea.2009.10.049
[4] Dauod, D.S., Wade, K.J., Mohammed, M.S., Majdi, H.S. (2024). Analysis of shielding gases influences 304 gas metal arc welding microstructure, weld geometry, and mechanical properties. Revue des Composites et des Materiaux Avances, 34(4): 435. https://doi.org/10.18280/rcma.340405
[5] Sun, W., Wang, G., Zhang, J., Xia, D., Sun, H. (2009). Microstructure characterization of high-heat-input welding joint of HSLA steel plate for oil storage construction. Journal of Materials Science & Technology, 25(6): 857.
[6] Magudeeswaran, G., Balasubramanian, V., Reddy, G.M., Balasubramanian, T.S. (2008). Effect of welding processes and consumables on tensile and impact properties of high strength quenched and tempered steel joints. Journal of Iron and Steel Research International, 15(6): 87-94. https://doi.org/10.1016/S1006-706X(08)60273-3
[7] Kang, J., Wang, C., Wang, G.D. (2012). Microstructural characteristics and impact fracture behavior of a high-strength low-alloy steel treated by intercritical heat treatment. Materials Science and Engineering: A, 553: 96-104. https://doi.org/10.1016/j.msea.2012.05.098
[8] Lambert, A., Lambert, A., Drillet, J., Gourgues, A.F., Sturel, T., Pineau, A. (2000). Microstructure of martensite–austenite constituents in heat affected zones of high strength low alloy steel welds in relation to toughness properties. Science and Technology of Welding and Joining, 5(3): 168-173. https://doi.org/10.1179/136217100101538164
[9] Lakshminarayanan, A.K., Balasubramanian, V. (2010). An assessment of microstructure, hardness, tensile and impact strength of friction stir welded ferritic stainless steel joints. Materials & Design, 31(10): 4592-4600. https://doi.org/10.1016/j.matdes.2010.05.049
[10] Thompson, B., Babu, S. (2010). Tool degradation characterization in the friction stir welding of hard metals. Welding Journal, 89: 256-261.
[11] Galvão, I., Leal, R.M., Rodrigues, D.M., Loureiro, A. (2013). Influence of tool shoulder geometry on properties of friction stir welds in thin copper sheets. Journal of Materials Processing Technology, 213(2): 129-135. https://doi.org/10.1016/j.jmatprotec.2012.09.016
[12] Zhu, X.K., Chao, Y.J. (2004). Numerical simulation of transient temperature and residual stresses in friction stir welding of 304L stainless steel. Journal of Materials Processing Technology, 146(2): 263-272. https://doi.org/10.1016/j.jmatprotec.2003.10.025
[13] Fall, A., Fesharaki, M.H., Khodabandeh, A.R., Jahazi, M. (2016). Tool wear characteristics and effect on microstructure in Ti-6Al-4V friction stir welded joints. Metals, 6(11): 275. https://doi.org/10.3390/met6110275
[14] Gan, W., Li, Z.T., Khurana, S. (2007). Tool materials selection for friction stir welding of L80 steel. Science and Technology of Welding and Joining, 12(7): 610-613. https://doi.org/10.1179/174329307X213792
[15] Abtan, A.A., Mohammed, M.S., Alshalal, I. (2024). Microstructure, mechanical properties, and heat distribution ANSYS model of CP copper and 316 stainless steel torch brazing. Advances in Science and Technology. Research Journal, 18(1): 167-183. https://doi.org/10.12913/22998624/177299
[16] Lakshminarayanan, A.K., Balasubramanian, V. (2011). Understanding the parameters controlling friction stir welding of AISI 409M ferritic stainless steel. Metals and Materials International, 17: 969-981. https://doi.org/10.1007/s12540-011-6016-6
[17] Jindal, S., Chhibber, R., Mehta, N.P. (2013). Investigation on flux design for submerged arc welding of high-strength low-alloy steel. Proceedings of the Institution of Mechanical Engineers, Part B: Journal of Engineering Manufacture, 227(3): 383-395. https://doi.org/10.1177/0954405412468993
[18] Goldak, J., Chakravarti, A., Bibby, M. (1984). A new finite element model for welding heat sources. Metallurgical Transactions B, 15: 299-305. https://doi.org/10.1007/BF02667333
[19] Nélias, D., Jullien, J.F., Deloison, D. (2010). Experimental investigation and finite element simulation of laser beam welding induced residual stresses and distortions in thin sheets of AA 6056-T4. Materials Science and Engineering: A, 527(12): 3025-3039. https://doi.org/10.1016/j.msea.2010.01.054
[20] EN 1011–-2. (2001). European standard: Welding recommendations for welding of metallic materials part 1: General Guidance for Arc Welding, Brussels.
[21] Fu, G., Lourenco, M.I., Duan, M., Estefen, S.F. (2014). Effect of boundary conditions on residual stress and distortion in T-joint welds. Journal of Constructional Steel Research, 102: 121-135. https://doi.org/10.1016/j.jcsr.2014.07.008
[22] Fu, G., Lourenço, M.I., Duan, M., Estefen, S.F. (2016). Influence of the welding sequence on residual stress and distortion of fillet welded structures. Marine Structures, 46: 30-55. https://doi.org/10.1016/j.marstruc.2015.12.001
[23] Ferro, P., Zambon, A., Bonollo, F. (2005). Investigation of electron-beam welding in wrought Inconel 706—experimental and numerical analysis. Materials Science and Engineering: A, 392(1-2): 94-105. https://doi.org/10.1016/j.msea.2004.10.039
[24] Gilles, P., El-Ahmar, W., Jullien, J.F. (2009). Robustness analyses of numerical simulation of fusion welding NeT-TG1 application: “Single weld-bead-on-plate”. International Journal of Pressure Vessels and Piping, 86(1): 3-12. https://doi.org/10.1016/j.ijpvp.2008.11.012
[25] Kik, T. (2020). Heat source models in numerical simulations of laser welding. Materials, 13(11): 2653. https://doi.org/10.3390/ma13112653
[26] Nascimento, E.J., dos Santos Magalhães, E., dos Santos Paes, L.E. (2023). A literature review in heat source thermal modeling applied to welding and similar processes. The International Journal of Advanced Manufacturing Technology, 126(7): 2917-2957. https://doi.org/10.1007/s00170-023-11253-z
[27] Hamdey, M.D., Mohammed, M.S., Kareem, A.H., Majdi, H.S. (2024). Thermal and mechanical analysis in joint welding of thick steel alloy plates with and without backing plate. Journal of Engineering Science and Technology, 19(5): 1974-1989.
[28] Dean, D., Yu, L., Hisashi, S., Masakazu, S., Hidekazu, M. (2003). Numerical simulation of residual stress and deformation considering phase transformation effects (mechanics, strength & structural design). Transactions of JWRI, 32(2): 325-333.
[29] Zhang, Y.Q., Zhang, H.Q., Li, J.F., Liu, W.M. (2009). Effect of heat input on microstructure and toughness of coarse grain heat affected zone in Nb microalloyed HSLA steels. Journal of Iron and Steel Research International, 16(5): 73-80. https://doi.org/10.1016/S1006-706X(10)60014-3
[30] Ghomashchi, R., Costin, W., Kurji, R. (2015). Evolution of weld metal microstructure in shielded metal arc welding of X70 HSLA steel with cellulosic electrodes: A case study. Materials Characterization, 107: 317-326. https://doi.org/10.1016/j.matchar.2015.07.032
[31] Kantor, M.M., Sudin, V.V., Bozhenov, V.A., Solntsev, K.A. (2023). Microstructure and impact toughness of acicular ferrite in low alloy steel weld joints from results of multiple impact bending tests. Inorganic Materials, 59(4): 436-451. https://doi.org/10.1134/S0020168523040027
[32] Momeni, A., Arabi, H., Rezaei, A., Badri, H., Abbasi, S.M. (2011). Hot deformation behavior of austenite in HSLA-100 microalloyed steel. Materials Science and Engineering: A, 528(4-5): 2158-2163. https://doi.org/10.1016/j.msea.2010.11.062
[33] Withers, P.J., Bhadeshia, H.K.D.H. (2001). Residual stress. Part 2–Nature and origins. Materials Science and Technology, 17(4): 366-375. https://doi.org/10.1179/026708301101510087
[34] Venkata, K.A., Kumar, S., Dey, H.C., Smith, D.J., Bouchard, P.J., Truman, C.E. (2014). Study on the effect of post weld heat treatment parameters on the relaxation of welding residual stresses in electron beam welded P91 steel plates. Procedia Engineering, 86: 223-233. https://doi.org/10.1016/j.proeng.2014.11.032
[35] Brown, I.H. (2006). The role of microsegregation in centreline cold cracking of high strength low alloy steel weldments. Scripta Materialia, 54(3): 489-492. https://doi.org/10.1016/j.scriptamat.2005.09.047
[36] Li, Y.P., Song, R.B., Wen, E.D., Yang, F.Q. (2016). Hot deformation and dynamic recrystallization behavior of austenite-based low-density Fe–Mn–Al–C steel. Acta Metallurgica Sinica (English Letters), 29: 441-449. https://doi.org/10.1007/s40195-016-0406-1
[37] Konkol, P.J., Mruczek, M.F. (2007). Comparison of friction stir weldments and submerged arc weldments in HSLA-65 steel. Welding Journal-New York-, 86(7): 187.
[38] Shi, Z., Wang, J., Chai, X., Wang, S., Chen, G., Wang, R. (2020). Effect of boron on intragranular ferrite nucleation mechanism in coarse grain heat-affected zone of high-nitrogen steel. Materials Letters, 258: 126819. https://doi.org/10.1016/j.matlet.2019.126819
[39] Hamza, S., Boumerzoug, Z., Raouache, E., Delaunois, F. (2019). Simulated heat affected zone in welded stainless steel 304L. Acta Metallurgica Slovaca, 25(3): 142-149. https://doi.org/10.12776/ams.v25i3.1290
[40] Ghosh, A., Das, S., Chatterjee, S., Rao, P.R. (2006). Effect of cooling rate on structure and properties of an ultra-low carbon HSLA-100 grade steel. Materials Characterization, 56(1): 59-65. https://doi.org/10.1016/j.matchar.2005.09.014