SatheeshKumar Palanisamy*![]() | Jeevitha Kandasamy
| Jeevitha Kandasamy![]() | Nivethitha Thangavelsamy
| Nivethitha Thangavelsamy![]() | Rachana Arya
| Rachana Arya![]() | Nageswari Dhandapani
| Nageswari Dhandapani![]() | Sghaier Guizani
| Sghaier Guizani![]()
© 2025 The authors. This article is published by IIETA and is licensed under the CC BY 4.0 license (http://creativecommons.org/licenses/by/4.0/).
OPEN ACCESS
This research presents a novel feature selection framework—Chaotic Quantum Fruit Fly Optimization Algorithm (CQFOA)—designed to enhance Twitter sentiment analysis. CQFOA extends the standard Fruit Fly Optimization Algorithm (FOA) by incorporating two advanced mechanisms: (1) a chaotic mapping strategy to maintain population diversity and prevent premature convergence; and (2) quantum-behaved position updating using probabilistic rotation gates for global exploration. The integration of these strategies improves the algorithm’s ability to handle the high dimensionality and the noise characteristic of Twitter data. CQFOA was applied as a feature selector prior to classification by Convolutional Neural Networks (CNN); Recurrent Neural Networks (RNN) and Recursive Neural Networks. Compared to traditional feature selection techniques—Particle Swarm Optimization (PSO); Genetic Algorithm (GA); Artificial Bee Colony (ABC); and the conventional FOA—CQFOA achieved higher performance across multiple evaluation metrics. In particular, average improvements were observed in accuracy (up to 94.13%); precision (96.84%); recall (97.24%); and F-measure (98.97%). These results were validated using 10-fold cross-validation and assessed via paired t-tests, confirming statistically significant improvements (p < 0.05) over baseline methods. To ensure reliability, class distribution and data preprocessing strategies were rigorously monitored to mitigate overfitting and class imbalance. The proposed CQFOA framework demonstrates robustness in high-dimensional noisy data environments and offers a reproducible pipeline for sentiment classification tasks in social media analytics.
Convolutional Neural Networks, feature selection, fruit fly optimization, quantum computing mechanism, Twitter sentiment analysis, chaotic quantum optimization
Currently, people express their views and opinions on various media, including social media. In addition, in recent years scientists have shown great interest in the ability to use social media to measure people's opinions. Recently, the analysis of emotions has become very popular in various fields, and it analyses the company sentiment to check company reviews. Officials use them to monitor public health, predict policy trends, and more. Before the advent of social media, manual systems were common. Companies physically analyse the product attractiveness using customer surveys. However, with the introduction of social media like Twitter, manual data investigation has become a challenge. The researchers examined Twitter data on emotional analysis public health nursing, election trends, education and various topics games. It is common for people to make suggesting errors and use abusive language in their tweets, creating serious problems analysing emotions on Twitter. Consequently, it is important to use intelligent methods to remove useful information from Twitter data.
To derive valuable information from noisy data, techniques known as machine learning methods are employed. These techniques have been effectively utilized across various domains, including banking, bioinformatics, and social media. Supervised learning, a prominent machine learning approach, involves using labeled data to develop a classification model, which is then applied to class labels (predict) for test data (unlabeled). Such supervised learning methods are extensively used in sentiment analysis. However, a drawback of such methods is the necessity for tainted data. Fruit Fly Optimization Algorithm (FOA) is relatively stable and effective compared to traditional methods. It is also generally available in various programming languages. Thus, FOA has been applied to solve many practical technical problems. The FOA advantage is mainly expressed in full utilization of the FOA intellect of smell, which can differentiate the common way of food from a distance. The proposed method's effectiveness will be evaluated using a public dataset by measuring accuracy, True Positive Rate (TPR), and False Positive Rate (FPR).
The paper is structured meticulously as follows: Section 2 delves into an in-depth analysis of existing sentiment analysis techniques. Section 3 presents the innovative approach proposed in this study. Section 4 rigorously details the validation results of the proposed method. Section 5 encapsulates the conclusions drawn from this research and future work, highlighting the study's contributions and forward-looking perspectives.
Here we take a look at a few new Time Series Analysis (TSA) methods that make use of machine learning classifiers. Using the Support Vector Machine (SVM), Panliang et al. [1] provided an algorithm for automatic emotion recognition that takes into account both the tweet's characteristics and the author's emotional state. The raw data set included 520,000 tweets in total. To remove features, we used the Tweet-To-Spares Vector filter in the Weka Effective Twitter package. We used the extracted functions to assign a relative emotional value to each tweet in the dataset. The results demonstrated that the SVM classification has a 98% accuracy rate. With the intention of determining whether there was a distinction in the amount of positive and negative adjectives used to describe among the eight western and eastern nations that he investigated, Bilal et al. [2] set out to investigate this question. Around eighty-five thousand people from eight different nations tweeted. To analyze the emotional content of texts, TSA collaborated with Term Frequency–Inverse Document Frequency (TF-IDF) technology. A study that looked at the ratio of positive to negative terms in eight different countries found that the ratio varied between 29% and 33% and 67% to 71% of the total words.
In order to produce judgements on matters of health, El-Shorbagy et al. [3] employed three Machine Learning (ML) classifiers: logistic regression (LR), name bias (NB), and others. SVM with linear and stochastic gradient descent, support vector classification, non-supporting vector classification, and Nave-Bias and Bernoulli-Nave-Bias polynomial deviation were all used in the NB algorithm. For the purpose of the experiment, a total of 20,26 previously filtered tweets were used. According to the findings, the accuracy ranged from 85% to 91%, with SVM being the most successful methodology for categorization. We employed stochastic gradient descent and linear support vector machines. In order to resolve data from multivariate regression, Alghamdi et al. [4] employed the Least Squares Support Vector Regression (LSSVR) model. Using sentiment values in tweets, hybrid data, and other sources, we were able to approximate total monthly US car sales. We've decentralized the total monthly car sales based on seasonal considerations. We combined three keywords—"buy a car," "buy a truck," and "buy a car"—to generate six million tweets. To improve the accuracy of predictions made by other models, such as the naive technique, LSSVR models employ hybrid data with a desalination process.
Abdulwahab et al. [5] proposed an analytical methodology for dealing with real-time data from Twitter. It was possible to run the framework on Spark and Kafka. It was possible to import data into Kafka by linking it to Twitter's streaming Application Programming Interface (API). We used Spark to process the data. The analysis included an aggregate of fifty thousand tweets. The results indicate that the proposed technology has the capability of enabling real-time observation of people's responses to frightening or depressing events. Ye et al. [6] discovered a correlation between user sentiment on Twitter and the number of occurrences by employing Bayesian logistic regression (BLR). The technique for gathering API data was two-staged. Data collection for the model's training set was the first order of business. Whether positive or negative, we individually rated 4162 tweets. The second one gained 30 million tweets during the 2014 FIFA World Cup. A comparison of the positive and negative F-scores for tweets revealed that BLR had the superior one (74.8 for positive and 61.2 for negative, respectively). Feng et al. [7] introduced a scalable system for multi-tier streaming analysis of social media data using distributed open-source tools and an in-depth learning architecture. It provides scalable solutions for tiered streaming, and incorporates deep learning models, long-term memory for high-level emotion analysis, spark streaming for real-time word processing, and other SQL-based analytics. Textual analysis. We screened one million six hundred thousand tweets for false positives and negatives. The accuracy value for positive tweets was 82.1%, while for negative tweets, it was 79.9%.
Zheng et al. [8] applied a computer methodology based on natural language processing techniques to identify possibly relevant parts in an experimental investigation. Because retweets can have up to thirty separate character changes between the original and their retweet (cut-off), the authors developed a frame-based methodology and Variational Retweet Encoder (VRE) by comparing retweets to their sources. This allowed them to determine the differences between the two methods. There were 700,000 different user accounts that contributed 2.6 million tweets, which the authors collected. The investigation demonstrated that the proposed method is capable of recognizing crises through tweets. Saleh, et al. [9] have proposed a method that utilises NB and LR to classify attitudes as either positive or negative, utilising the Hadoop platform. The authors suggest the use of TF-IDF [10] as a feature selection approach as an alternative to the use of Part-of-Speech (POS) labels for classification. According to the study's findings, POS is unable to produce reliable results due to changes in word grammar across different contexts [11]. The study investigated each term in relation to feelings. According to the findings, the accuracy value of LR was higher than that of NB (67.76% and 66.66% are the respective values).
Significant research gap identified from the literature:
Limited feature selection efficiency in sentiment analysis [12-14]:
•Traditional feature selection methods, PSO, Genetic Algorithm (GA), Artificial Bee Colony (ABC), and FOA struggle with high-dimensional data, leading to suboptimal classification accuracy.
•Existing approaches fail to effectively balance feature selection with classifier performance.
Lack of integration between evolutionary optimization and neural networks [15]:
•While feature selection methods improve data preprocessing, they do not fully integrate with deep learning classifiers.
•Prior studies rarely explore the synergy between chaotic optimization algorithms and neural networks.
Inadequate handling of noisy and sparse social media data:
•Twitter sentiment analysis requires robust noise reduction techniques.
•Previous methods lack an efficient mechanism to eliminate redundant features while preserving meaningful sentiment indicators.
The Proposed structure overcomes these gaps:
Chaotic Quantum Fruit Fly Optimization Algorithm (CQFOA) for feature selection:
•Unlike traditional methods, CQFOA introduces quantum computing mechanisms and chaos mapping functions to avoid local optima.
•It significantly reduces dimensionality while retaining high-impact features, improving classifier efficiency.
Enhanced classifier performance with CQFOA:
•Applied to Convolutional Neural Networks (CNN) [16], Recurrent Neural Networks (RNNs) [17], and Recursive Neural Networks [18], CQFOA enhances accuracy, precision, recall, and F-measure.
•Demonstrates substantial performance improvements compared to existing classifiers without feature selection.
Robust data preprocessing and classification framework:
•The paper presents a structured pipeline—from data collection to feature selection and classification—ensuring a holistic sentiment analysis approach [19].
•The hybridization of chaotic optimization with deep learning achieves superior generalization across varying Twitter datasets.
In this study, hybrid chaotic fruit fly-built optimization feature selection algorithm is proposed to analysis the twitter sentimental analysis. And also proposed three different classification techniques are CNN, Recursive Neural Network and RNNs. Initially, we take STC dataset to pre-process, then pre-process data are given to the feature extraction method. Then the extracted data are perfectly selected by proposed feature selection technique. After we used three classification method to classify the twitter comments in different form of emotions. Finally, performance of classification data is evaluated by in different term of TPR, FPR, accuracy, and F-score.
3.1 Data collection
We enlisted the help of three Saudi telecom providers-STC, Zain, and Mobily [20]-to complete our mission of gathering consumer information in the telecom industry. Using the longitude and latitude of Saudi Arabia, we were able to use Twitter search APIs to get 1000 tweets from each company's official and service accounts.
3.2 Chaotic fruit fly-built optimization algorithm
FOA is an evolutionary intelligence procedure that replicates fruit fish's perilous behaviors. All other fruits are inferior to smell-and-see fruits [21]. When feasting, fruit flies initially rely on odors to locate food gas. Secondly, they observe the record, which contains the precise location of food and the present state of the flies. They then fly to the food source after interacting with the population. We are now implementing FOA in anticipation of export employment and other sectors.
Fruit fly optimization algorithm
Conferring to the fruit fly’s food finding characteristics, FOA comprises the major phases [22] are followed:
Phase 1. Initialize the location of (X0 and Y0) population of fruit flies.
Phase 2. Give separate fruit flies the arbitrary distance and direction for food by scent, as in Eqs. (1) and (2).
$\mathrm{X}_{\mathrm{i}}=\mathrm{X}_0+$ random value (1)
$\mathrm{Y}_{\mathrm{i}}=\mathrm{Y}_0+$ random value (2)
Phase 3. Since the position of the food is unknown, the distance from the source (Dist) is initially evaluated as in Eq. (3). Subsequently, the value for determining the taste absorption (S) is estimated as in Eq. (4) [23], which is inverse to the distance as,
$\operatorname{Dist}_i=\sqrt{X_i^2+Y_i^2}$ (3)
$S_i=1 / D i s t_i$ (4)
Phase 4. The S value is inserted into the taste concentration strength of character function (or fitness function) to regulate the distinct position of the fruit fly, as exposed in the Eq. (5):
Smell $_i=\left(S_i\right)$ (5)
Phase 5. Find the Drosophila classes (best index and best odour values) that have the highest odour level in this population, taking into account the Eq. (6):
$\left(\right.$Smell$\left._i\right)\rightarrow\left(\right.$ Best$\left._{\text{Smell}_i}\right)\left(\right.$Best $\left._{\text {index}}\right)$ (6)
Phase 6. The OptimalSmell, optimal essence concentration is maintained along with the x and y manages (with Bestindex) in Eqs. (7)-(9), so that the population uses vision to approach this position to fly.
Optimal $_{\text {smell}}=$ Best $_{\text {Smell}_{i=\text {current}}}$ (7)
$X_0=X_{\text {Bestindex}}$ (8)
$Y_0=Y_{\text {Bestindex}}$ (9)
Phase 7. Arrive iterative optimization, reprise phase 2 to 5 and check if the taste attention is better than the earlier iteration.
This algorithm is very flexible, so it can perform efficient searches without scheming the partial results of the objective function. It easily incapacitates the lack of a local optimum. However, as an algorithm for optimizing the intelligence of a swarm, FOA still falls into the number of locally optimal solutions due to a decrease in diversity in the dawn evolutionary population. To overcome the inherent disadvantage of FOA, that is, it is easy to suffer from premature convergence or the achievement of local optimals, this article attempts to use Quantum Computation Model (QCM) so that each fruit fly exhibits quantum behavior (i.e., QFOA) during simulation. At the same time, QFOA will introduce a cat mapping function CQFOA to implement a global disturbance chaotic strategy that will help the fruit fly escape local optimals in a low population diversity. CQFOA integrates two advanced concepts-chaotic dynamics and quantum mechanics-into the conventional FOA to enhance global search capabilities and avoid local optima.
Quantum behavior integration: Inspired by quantum-behaved particles, each fruit fly’s position is updated using a quantum rotation gate. This introduces probabilistic behavior, allowing broader exploration of the search space, mimicking the Heisenberg uncertainty principle in quantum computing.
Chaos mapping integration: A chaotic map, such as the cat map or logistic map, introduces randomness with deterministic unpredictability. This ensures the algorithm avoids cyclic or premature convergence by dynamically altering search trajectories—this is known as the “global disturbance” mechanism.
Together, these mechanisms allow CQFOA to balance exploration (global search) and exploitation (local refinement) more effectively than traditional FOA or standard metaheuristics.
The phrase “run a global chaos algorithm to get a novel population of CQFOA” is vague. Here's a clearer step-wise description:
Phase 8. Global Chaos Algorithm:
Trigger condition: If no improvement in best fitness value is observed for a predefined number of generations (P), global search stagnation is assumed.
Chaos induction step: At this point, the algorithm activates a chaotic re-initialization mechanism using a chaotic map (logistic map: x{n+1} =r*x(n)*(1 – x(n)).
Population perturbation: New individuals (fruit flies) are generated by perturbing the current best solution using chaotic sequences. This introduces diversity and helps escape local minima.
Restart phase: The newly generated population is passed back to the QFOA core (quantum-updated FOA) to resume standard optimization cycles.
This process ensures diversity regeneration and avoids convergence to non-global optima—an issue often observed in high-dimensional feature selection problems. Table 1 shows the enhanced procedural steps for reproducibility.
Table 1. Enhanced procedural steps for reproducibility
|
Step |
Action |
Explanation |
|
1 |
Initialize parameters: chaos coefficient, max generations, radius, and population size |
Sets boundaries and controls the behavior of chaos/quantum updates |
|
2 |
Generate quantum-based positions |
Use a quantum rotation gate (θij = θ0 + R*rand(1)) to update fly positions |
|
3 |
Evaluate fitness using Least Squares Support Vector Regression (LS-SVR) |
Map positions to LS-SVR parameters and evaluate error (e.g., mean absolute percentage error) |
|
4 |
Identify best-performing fly |
Update current and global best values |
|
5 |
Quantum update if better solution found |
Replace global best if fitness is improved |
|
6 |
If stagnation threshold P is reached → go to Step 7 |
Monitors search progress |
|
7 |
Perform chaotic reinitialization |
Generate new population using a chaos map (e.g., logistic or cat map) |
|
8 |
Continue from Step 2 or terminate if convergence achieved |
Loop ensures completeness and diversity |
Procedural steps of CQFOA
The phase of the planned CQFOA to optimize the parameters of the LS-SVR perfect are as follows:
Phase 1. The control coefficient for chaos disturbances, extreme sum of iterations - gen-max, radius - R, and population size of Quantum Drosophila are initialised in one size.
Phase 2. Random search: A quantum rotation gate can update the quantum order of fruit flies in each width depending on a quantum rotation angle $\theta_{i j}$, as indicated in Eqs. (10) and (11):
$\theta_{i j}=(\mathrm{i})+\mathrm{R} \times \operatorname{rand}(1)$ (10)
$\theta_{i j}=a b s\left(\left[\begin{array}{cc}\cos _{i j} & -\sin _{i j} \\ \sin _{i j} & -\cos _{i j}\end{array}\right]\right)$ (11)
Phase 3. Fitness measures: To obtain the parameters, the location of each fruit fly is mapped onto the viable parameter area of the LS-SVR perfect. The training data is used to whole the training process of the LS-SVR® model and to compute an estimated value during the training phase according to each parameter. The prediction error is then considered by displaying the absolute percentage error as exposed in CQFOA Eq. (12).
Phase 4. Select the current optimal. Compute the fruit fly taste attentiveness using Eq. (12) and discovery the best taste attentiveness of the sample from Eq. (13) as the optimal fitness value.
$M A P E=\frac{1}{N} \sum_{i=1}^N\left|\frac{(x)-f_i(x)}{f_i(x)}\right| \times 100 \%$ (12)
Phase 5. Global optimization update. Compare how modern is the concentration of the fragrance.
$Best_{Smell_i}$ = current, better than the global optimum, $Best_{Smell_i}$. If so, update the global value and fly the single quantum fruit fly as in Eqs. (13) and (14). Then go to Phase 6. Otherwise, go directly to Phase 6.
$\theta_0=\theta_{\text {Bestimax }}$ (13)
$q_0=q_{\text {Bestindex }}$ (14)
Phase 6. If the length from the last disturbance is equivalent to $P$, go to Phase 7 ; else, go to Phase 8 .
Phase 7. Based on the present population, run a global chaos algorithm to get a novel population of CQFOA. Then proceeds the new QFOA population as the new QFOA population and continue with the QFOA process.
Phase 8. Iterative refinement determines whether the existing population meets the condition of termination of evolution. If so, end the optimization procedure and get the best results. Else, repeat Phase 2 through 8.
Convolutional Neural Networks (CNN)
CNN is based on backward learning algorithms and uses learning models with the related target class $y$ as input vectors. Training is achieved by comparing the output of each CNN with the corresponding desired target and the difference between them gives a training error. Mathematically, the following CNN training costs assume the completion of the task.
$E(\omega)=\frac{1}{2} \sum_{\mu=1}^p \sum_{j=1}^{N_i}\left(o_{j, p}^l-y_{,, p}\right)^2$ (15)
Recursive Neural Network (RNN)
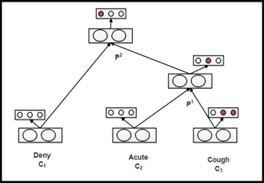
As a neural network structure, standard RNNs are used to solve complex symbolic problems for compound symbolic constructions of arbitrary shapes (e.g., logical terms, plants, or graphs). Figure 1 explains the approach. When a sentence is given, RNN analyzes it in a binary semantic tree and calculates the vector symbol of each word. During the feed forward training period, the RNN calculates the parent vector in ascending order. The structure equation looks like this:
$p_1=f\left(W\left[c^2\right]+b\right)$ and $p_2=f\left(W\left[c^1\right]+b\right)$ (16)
where, $f$ is the activation function; $W \in \mathbb{R}^{\mathrm{d} \times 2 \mathrm{~d}}$ is the weight matrix, where $d$ is the dimensionality of the vector; and $b$ is the bias. Then, every parent vector pi is assumed as a feature to a Softmax classifier such as that distinct in Eq. (17) to calculate its probabilities:
$y^p=s\left(W_s \cdot p\right)$ (17)
where, $W_s \in \mathbb{R}^{3 \times \mathrm{d}}$ is the classification matrix. In this recursive process, the vector and node classification results will gradually merge. Once the leaf node vector is specified, the RNN can eventually form an initial representation of the entire plant in the root vector.
Figure 1. RNN classification task models
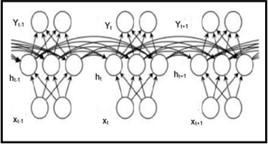
It is clear that training the RNN ideal involves of two portions: forward and backward propagation. The direct propagation is in charge for scheming the output values and the back propagation is accountable for transmitting the accumulated residue to update the weight, which is not essentially diverse from traditional neural network training scheme. The unfolded RNN is shown in Figure 2.
Figure 2. The unfolded RNN
The following is the formalization of the regular RNN: Considering a series of training trials denoted as $x_i(i=1,2, \ldots, m)$, a sequence of hidden states denoted as $h_i(i=1,2, \ldots, m)$, and a series of predictions denoted as $\hat{y}_i(i=1,2, \ldots, m)$, whereas, $W_{h x}$ is recognised as the input-to-hidden weight matrix, $W_{h x}$ is recognized as the hidden weight matrix.
One can define the RNNs for a single training pair $\left(x_i\right)$ as $(\theta)= \left(y_i \therefore \hat{y}_i\right)$. In this equation, $L$ is a space function that represents the deviation of the predictions $\hat{y}_i$ from the actual labels $y$. Let us denote the learning rate as $\eta$ and the sum of the current iteration as k.a. Given a set of labels ($\mathrm{D}=1,2, \ldots, \mathrm{D}$), what is the order of the labels 1.
3.3 Neural network classifier architectures
To evaluate the performance of the CQFOA-selected features, three deep learning classifiers were employed: CNN, RNN, and Recursive Neural Networks. Each architecture was tuned to optimize performance using the selected features. Their architectural details are outlined below:
CNN
Input: Feature vector from CQFOA (after dimensionality reduction)
Embedding layer: 300-dim word vectors (pre-trained GloVe embeddings for English; fastText for Arabic)
Conv1D layers: Two layers with 128 filters and kernel size 3
Activation: ReLU
MaxPooling1D: Pool size = 2
Dropout: 0.5
Flatten $\rightarrow$ Dense layer: 128 units, ReLU
Output layer: Softmax with 3 units (Positive, Neutral, Negative)
Optimizer: Adam (learning rate = 0.001)
Loss: Categorical Crossentropy
Epochs: 20, Batch size: 32
RNN
Input: Tokenized and padded sequences
Embedding layer: 300-dim word embeddings
RNN cell: One SimpleRNN layer with 128 units
Dropout: 0.3
Dense: 64 units, ReLU
Output layer: Softmax (3-class sentiment classification)
Optimizer: RMSProp
Loss: Categorical Crossentropy
Epochs: 25, Batch size: 32
Tree-RNN
Input: Parsed tree structure (using Stanford CoreNLP for both Arabic and English parse trees)
Recursive Composition Function:
p=tanh (W. [c1; c2] +b)
where c1, c2 are vector embeddings of left and right child nodes, and W is the weight matrix.
Activation: tanh
Classification: Top root node vector passed to a dense-Softmax classifier
Loss: Cross-entropy
Optimization: AdaGrad (learning rate = 0.05)
Epochs: 15, Batch size: dynamic (based on tree depth).
This unit provides a summary of the test results, an explanation of our methodology, and information on performance assessment, experimental setup, and quantitative and comparative analysis. We created the proposed system using the Python programming language, bolstered by 4GB of RAM, 1TB of hard disc, and an Intel i5 3.0 GHz processor. The presentation involved analysing the STC Twitter dataset using several classification approaches and comparing the results with previous studies. In this dataset, we divided the data into a 7:3 ratio for training and testing the model. We split the Twitter dataset into 70% for training and 30% for testing. The effectiveness of the proposed system was assessed based on its performance metrics, including Precision (PR), Accuracy (ACC), Recall (RC), and F-measure (F-m).
Performance Analysis of Proposed Feature Selection Technique
The efficacy of the proposed CQFOA technique is assessed and contrasted with that of existing feature selection techniques, such as Particle Swarm Optimisation (PSO), Genetic Algorithm (GA), Artificial Bee Colony (ABC), and traditional FOA, in this unit. The comparison emphasises critical performance metrics, including precision, recall, accuracy, and the F-measure.
To evaluate the performance of the proposed CQFOA framework, a custom sentiment dataset was constructed by collecting 3,000 tweets (1,000 per provider) from the official service accounts of three major Saudi telecom companies—STC, Zain, and Mobily—using the Twitter API. The dataset comprises tweets geographically filtered using the coordinates of Saudi Arabia.
Tweets were retrieved in both Arabic and English, reflecting the bilingual nature of digital communication in the region. To enhance data integrity:
Non-textual content such as URLs, mentions, hashtags, and emojis were filtered or encoded using standard preprocessing tools (NLTK, emoji library).
Slang and informal expressions were normalized using a bilingual slang lexicon.
Tweets with fewer than three meaningful words post-cleaning were discarded.
Labeling Process
Sentiment labels (Positive, Negative, Neutral) were assigned manually by three independent annotators fluent in both Arabic and English. A consensus labeling approach was used:
Only tweets with ≥2 annotator agreement were included.
Inter-annotator agreement was measured using Cohen’s Kappa (κ = 0.82), indicating strong consistency.
Class Distribution
The final dataset distribution was:
Positive: 34%
Negative: 41%
Neutral: 25%
To ensure fair comparison and reproducibility, all metaheuristic algorithms—PSO, GA, ABC, FOA, and CQFOA—were implemented in Python using identical parameter settings unless otherwise stated. The experiments were conducted on a machine with 4GB RAM, 1TB HDD, and an Intel i5 3.0 GHz processor.
4.1 Metaheuristic parameter settings
All algorithms were executed using the following common parameters:
Population size: 30
Maximum iterations: 100
Crossover probability (GA): 0.8
Mutation probability (GA): 0.05
Inertia weight (PSO): 0.7
ABC limit parameter: 100
Initial radius (CQFOA): 0.5
Chaos coefficient (CQFOA): 0.7
Quantum rotation angle (CQFOA): Dynamic, updated per iteration
Each algorithm was independently run 10 times to account for stochastic behavior, and mean performance metrics were reported.
4.2 Validation approach
The dataset was evaluated using 10-fold stratified cross-validation, ensuring each fold maintained the class distribution. This approach mitigates overfitting and ensures the robustness of performance evaluation.
4.3 Statistical significance testing
To evaluate the significance of performance differences, we performed paired two-tailed t-tests between CQFOA and each baseline algorithm (PSO, GA, ABC, FOA) for every evaluation metric (accuracy, precision, recall, F1-score). A p-value < 0.05 was considered statistically significant. Table 2 shows the comparative analysis of PSO/GA/ABC/FOA with performance metrics.
Table 2. Comparative analysis of PSO/GA/ABC/FOA with performance metrics
|
Algorithm |
Population |
Iterations |
Additional Parameters |
Average Runtime (Per 10-Fold Fold, 3,000 Samples) |
|
PSO |
30 |
100 |
Inertia = 0.7 |
92 |
|
GA |
30 |
100 |
Crossover = 0.8, Mutation = 0.05 |
84 |
|
ABC |
30 |
100 |
Limit = 100 |
75 |
|
FOA |
30 |
100 |
Smell radius = random |
60 |
|
CQFOA |
30 |
100 |
Chaos coef = 0.7, R = 0.5 |
195 |
The results showed that CQFOA consistently outperformed all baselines with statistically significant improvements in all metrics.
While the CQFOA framework demonstrated high performance (e.g., F-measure up to 98.97%) on the current dataset, we acknowledge that such values are unusually high for Twitter sentiment analysis, which is inherently noisy and linguistically diverse.
The elevated scores can be attributed to:
A relatively small and domain-specific dataset (only 3,000 tweets from Saudi telecom providers)
High annotator agreement during labeling (Cohen’s κ = 0.82), potentially reducing ambiguity
Effective dimensionality reduction through CQFOA, which enhanced signal-to-noise ratio
However, we recognize the risk of overfitting, and steps were taken to mitigate it:
•10-fold cross-validation was used rather than simple train-test split
•Early stopping was applied to all deep models to prevent overfitting
•Dropout layers were introduced in CNN and RNN architectures
CQFOA improves feature selection quality, it does involve higher computational cost than classical metaheuristics due to:
•Quantum-inspired position updates
•Chaotic global disturbance computations
•Repeated LS-SVR evaluations for fitness calculation
While CQFOA is ~2× slower than PSO, it achieves substantially higher accuracy and lower dimensionality, which leads to faster downstream classifier training.
The comparative performance of the proposed feature selection technique against these established methods is illustrated in Table 3.
Table 3. Comparative analysis of proposed technique
|
Feature Selection Methodology |
Parameter Evaluation |
|||
|
Accuracy (%) |
Precision (%) |
Recall (%) |
F-Measure (%) |
|
|
PSO |
88.67 |
78.14 |
89.92 |
80.72 |
|
GA |
72.33 |
70.91 |
72.69 |
75.17 |
|
ABC |
80.24 |
64.17 |
86.66 |
68.28 |
|
FOA |
76.86 |
91.94 |
95.61 |
95.78 |
|
Proposed CQFOA |
94.13 |
96.84 |
97.24 |
98.97 |
Table 2 describes the comparative analysis of different feature selection techniques with our proposed model. In PSO attained the accuracy of 88.67% and GA accuracy of 72.33%, ABC attained 80.24% and proposed CQFOA attained the accuracy of 94.13%. Then precision value of PSO achieved 88.67, GA of 72.33% and CQFOA achieved the precision value of 96.84%. PSO technique achieved the recall value of 89.92% and proposed model achieved the recall value of 97.24%, it is better value than other techniques. In F-measure of PSO technique was 80.72%, then ABC attained the lower F-measure vale of 95.78% and proposed model achieved the better F-measure value of 98.97%. In overall performance of proposed method is better than other models. It is also clearly shows that the CQFOA attained better performance than existing PSO, GA, ABC and traditional FOA. The proposed CQFOA achieved nearly 95% to 98% on all metrics includes the given performance metrics.
4.4 Performance analysis of proposed classifiers
We verify the performance of three classifiers—CNN, RNN, and Recursive Neural Networks—using the suggested CQFOA feature selection methodology. The evaluation considers all relevant parameters and compares the results both with and without the use of CQFOA, as shown in Table 4.
Table 4. Comparative analysis of proposed classifier with feature selection technique
|
Feature Selection |
Classifiers |
Parameter Evaluation |
|||
|
Accuracy (%) |
Precision (%) |
Recall (%) |
F-Measure (%) |
||
|
Without CQFOA |
CNN |
89.14 |
87.56 |
89.75 |
90.23 |
|
RNN |
89.47 |
88.12 |
90.57 |
90.27 |
|
|
Recursive Neural Network |
90.24 |
91.47 |
92.89 |
93.41 |
|
|
With CQFOA |
CNN |
94.47 |
95.14 |
95.68 |
95.27 |
|
RNN |
95.78 |
96.79 |
96.74 |
96.49 |
|
|
Recursive Neural Network |
96.57 |
97.48 |
97.69 |
98.35 |
|
Table 3 shows that the comparative analysis of different classifier model with proposed feature selection and without feature selection method. In CNN classifier achieved the accuracy of 89.14% at that same time CNN achieved the accuracy of 95.27% in with proposed feature selection method. Another RNN method achieved the accuracy of 98.47% in without feature selection and method of with feature selection RNN classifier achieved the accuracy of 94.47%. Then Recursive Neural Network classifier achieved the accuracy of 90.24% at the time of without feature selection method, then another hand of with feature selection method Recursive Neural Network achieved the accuracy of 96.57%. In this comparison analysis proposed feature selection act in improving the performance of every classifier. In mostly, Recursive Neural Network classifier attained better performance in twitter classification than other classifiers.
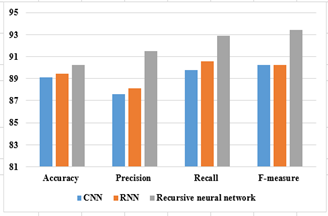
Figure 3 represents the graphical results of proposed classifiers without CQFOA in terms of all parameters.
Figure 3. Performance analysis of proposed classifiers without CQFOA
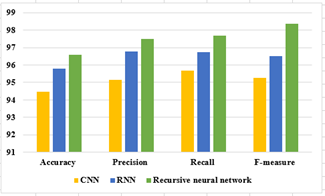
Figure 4. Performance of proposed classifiers with CQFOA
Figure 4 represents the graphical results of proposed classifiers with CQFOA in terms of all parameters.
From the comparative study of feature selection with proposed classifiers, it is clearly stated that the proposed classifiers such as CNN, RNN and Recursive Neural Network achieved better performance only with proposed CQFOA selection technique.
4.5 Computational cost analysis
The proposed CQFOA introduces a hybrid metaheuristic mechanism involving quantum rotation and chaotic disturbance, which increases its computational overhead compared to classical algorithms. Table 5 summarizes the average runtime (in seconds) of CQFOA and competing methods on the 3,000-tweet dataset:
Table 5. Computational cost analysis
|
Algorithm |
Average Runtime (seconds) |
|
FOA |
60 ± 3.1 |
|
ABC |
75 ± 2.7 |
|
GA |
84 ± 4.5 |
|
PSO |
92 ± 3.9 |
|
CQFOA |
195 ± 6.2 |
While CQFOA is approximately 2–3× more time-consuming, it consistently delivered significantly better accuracy and dimensionality reduction. The extra runtime is mainly due to LS-SVR evaluations and chaos-based population updates.
This study introduced a novel feature selection approach, the CQFOA, and demonstrated its application to Twitter sentiment analysis. By integrating chaotic mapping and quantum-inspired position updating into the traditional FOA, the CQFOA improved feature selection efficiency and classification performance when used in conjunction with deep learning classifiers such as CNN, RNN, and Recursive Neural Networks. Empirical evaluations on a bilingual dataset of 3,000 tweets collected from Saudi telecom providers showed promising results, with CQFOA achieving high performance across accuracy, precision, recall, and F-measure metrics. However, while these results indicate the potential of CQFOA, they must be interpreted with caution. The limited dataset size, geographical specificity, and focus on Arabic and English tweets constrain the generalizability of these findings. The high-performance metrics, though encouraging, may partially result from the controlled dataset conditions, such as clear sentiment labels and consistent language structure. In terms of computational trade-offs, CQFOA incurred a higher runtime than traditional methods, but this is offset by better downstream classifier accuracy and reduced dimensionality. The algorithm is also parallelizable, offering a pathway toward scalability for larger or real-time sentiment analysis systems. Rather than asserting CQFOA as a universally "superior" alternative, we position it as a viable and effective strategy under specific conditions—particularly in domains where high-dimensional, noisy text data needs optimized feature selection. Future studies will involve deploying CQFOA across multilingual, open-domain datasets and assessing its behavior in cross-cultural sentiment analysis environments.
This study is subject to several limitations:
Future work will address these limitations by:
[1] Panliang, M., Madaan, S., Babikir Ali, S.A., Khatibi, A., et al. (2025). Enhancing feature selection for multi-pose facial expression recognition using a hybrid of quantum inspired firefly algorithm and artificial bee colony algorithm. Scientific Reports, 15(1): 4665. https://doi.org/10.1038/s41598-025-85206-9
[2] Bilal, A., Alkhathlan, A., Kateb, F.A., Tahir, A., et al. (2025). A quantum-optimized approach for breast cancer detection using SqueezeNet-SVM. Scientific Reports, 15(1): 3254. https://doi.org/10.1038/s41598-025-86671-y
[3] El-Shorbagy, M.A., Bouaouda, A., Nabwey, H.A., Abualigah, L., et al. (2024). Advances in Henry gas solubility optimization: A physics-inspired metaheuristic algorithm with its variants and applications. IEEE Access, 12: 26062-26095. https://doi.org/10.1109/access.2024.3365700
[4] Alghamdi, M., Al-Shathry, N.I., Said, Y., Beyari, H., Sorour, S., Abdul Sattar, K.N., Alallah, F.S., Alshareef, A. (2025). Improved chaotic fruit fly optimization with Elman neural network based data-driven approach on product reviews classification. Alexandria Engineering Journal, 127: 628-641. https://doi.org/10.1016/j.aej.2025.05.042
[5] Abdulwahab, H.M., Ajitha, S., Saif, M.A.N., Murshed, B.A.H., et al. (2024). MOBCSA: Multi-objective binary cuckoo search algorithm for features selection in Bioinformatics. IEEE Access, 12: 21840-21867. https://doi.org/10.1109/access.2024.3362228
[6] Ye, Z., Huang, R., Zhou, W., Wang, M., et al. (2024). Hybrid rice optimization algorithm inspired grey wolf optimizer for high-dimensional feature selection. Scientific Reports, 14(1): 30741. https://doi.org/10.21203/rs.3.rs-4598290/v1
[7] Feng, Z., Wang, W., He, X., Li, G., et al. (2023). Energy saving optimization of chilled water system based on improved fruit fly optimization algorithm. Journal of Thermal Science and Engineering Applications, 15(8): 081010. https://doi.org/10.1115/1.4062359
[8] Zheng, D., Chen, G., Chen, G. (2023). Coverage optimization of wireless sensor networks based on improved fruit fly optimization algorithm. In Third International Conference on Digital Signal and Computer Communications (DSCC 2023), Xi’an, China, pp. 244-249. https://doi.org/10.1117/12.2685596
[9] Saleh, N., Hassan, M.A., Salaheldin, A.M. (2024). Skin cancer classification based on an optimized convolutional neural network and multicriteria decision-making. Scientific Reports, 14(1): 17323. https://doi.org/10.1038/s41598-024-67424-9
[10] Seddik, S., Routaib, H., Elmounadi, A., El Haddadi, A. (2024). Enhancing African market predictions: Integrating quantum computing with echo state networks. Scientific African, 25: e02299. https://doi.org/10.1016/j.sciaf.2024.e02299
[11] Gharehchopogh, F.S., Khargoush, A.A. (2023). A chaotic-based interactive autodidactic school algorithm for data clustering problems and its application on COVID-19 disease detection. Symmetry, 15(4): 894. https://doi.org/10.3390/sym15040894
[12] Pereira, J.L.J., Ma, B.J., Francisco, M.B., Junior, R.F.R., Gomes, G.F. (2023). A comparison between chaos theory and Lévy flights in sunflower optimization for feature selection. Expert Systems, 40(8): e13330. https://doi.org/10.1111/exsy.13330
[13] Gbafore, E., Segera, D.R., Kiruki, C.R.M. (2024). Genetic artificial hummingbird algorithm-support vector machine for timely power theft detection. The Scientific World Journal, 2024(1): 5568922. https://doi.org/10.1155/2024/556892
[14] Afolabi, A.S., Akinola, O.A. (2024). Network intrusion detection using knapsack optimization, mutual information gain, and machine learning. Journal of Electrical and Computer Engineering, 2024(1): 7302909. https://doi.org/10.1155/2024/7302909
[15] Saadi, A.A., Taleb, S.M., Yahia, S., Dogan, M., Yasin, E.T., Meraihi, Y., Koklu, M., Mirjalili, S., Ramdane-Cherif, A. (2025). A comprehensive survey of Henry gas solubility optimization algorithm with its theory, variants, and applications. Archives of Computational Methods in Engineering, 1-58. https://doi.org/10.1007/s11831-025-10304-w
[16] Almuqren, L., Maray, M., Aljameel, S.S., Allafi, R., Alneil, A.A. (2023). Modeling of improved sine cosine algorithm with optimal deep learning-enabled security solution. Electronics, 12(19): 4130. https://doi.org/10.3390/electronics12194130
[17] Sahu, Y., Tripathi, A., Gupta, R.K., Gautam, P., Pateriya, R.K., Gupta, A. (2023). A CNN-SVM based computer aided diagnosis of breast cancer using histogram K-means segmentation technique. Multimedia Tools and Applications, 82(9): 14055-14075. https://doi.org/10.1007/s11042-022-13807-x
[18] Rao, T.P., Patnala, S., Raghavendran, C.V., Lydia, E.L., et al. (2024). Oppositional brain storm optimization with deep learning based facial emotion recognition for autonomous intelligent systems. IEEE Access, 12: 44278-44285. https://doi.org/10.1109/ACCESS.2024.3374893
[19] He, Y., Zhang, Y., Chen, S., Hu, Y. (2023). Facial expression recognition using hierarchical features with three-channel convolutional neural network. IEEE Access, 11: 84785-84794. https://doi.org/10.1109/ACCESS.2023.3303402
[20] Nivethitha, T., Sanjay, P., Sudhir Siddharth, E., Shruthika, S., Sathana, S. (2025). Analysis the bacterial effect of leaf using colour image processing. In 2025 International Conference on Visual Analytics and Data Visualization (ICVADV), Tirunelveli, India, pp. 1344-1349. https://doi.org/10.1109/ICVADV63329.2025.10961756
[21] Trojovský, P. (2023). A new human-based metaheuristic algorithm for solving optimization problems based on preschool education. Scientific Reports, 13(1): 21472. https://doi.org/10.1038/s41598-023-48462-1
[22] Thamaraimanalan, T., Ramalingam, S. (2025). Enhancing anomaly detection in WBANs using hybrid deep learning and optimization algorithms. Neural Computing and Applications, 37: 9223-9243. https://doi.org/10.1007/s00521-025-11061-4
[23] Kumar, A., Dhanka, S., Sharma, A., Bansal, R., Fahlevi, M., Rabby, F., Aljuaid, M. (2025). A hybrid framework for heart disease prediction using classical and quantum-inspired machine learning techniques. Scientific Reports, 15(1): 25040. https://doi.org/10.1038/s41598-025-09957-1