Muhammad Kevin Alfirdaus*![]() | Elisa Kusrini
| Elisa Kusrini![]() | Winda Nur Cahyo
| Winda Nur Cahyo![]() | Imam Djati Widodo
| Imam Djati Widodo![]()
© 2025 The authors. This article is published by IIETA and is licensed under the CC BY 4.0 license (http://creativecommons.org/licenses/by/4.0/).
OPEN ACCESS
The poultry meat supply chain in Indonesia faces significant challenges, mainly due to fluctuating production levels and lack of transparency in information flow, which impacts farmer welfare and operational efficiency. Previous studies have mostly focused on generic supply chain models, but there is a gap in addressing collaborative frameworks specifically designed for the poultry industry. To address this gap, this study aims to design a Collaborative Planning, Forecasting, and Replenishment (CPFR) success model using Power BI to enhance transparency and collaboration among stakeholders. The methodology involves data collection through surveys, observations, and literature reviews, followed by analysis using SPSS and Structural Equation Modeling (SEM) to test the relationship between variables. A sample of 119 respondents, including farmers, distributors, and other stakeholders in the poultry supply chain, were analyzed. The results showed that real-time data visualization and information transparency significantly influenced Power BI implementation, which mediated the successful adoption of the CPFR model. Valid indicators and regression analysis confirmed the effectiveness of the proposed framework. The study concluded that integrating Power BI with CPFR improves decision-making, reduces risks, and increases supply chain efficiency. The findings offer actionable insights for stakeholders and policymakers, and pave the way for future research on longitudinal impacts and broader industry applications.
CPFR, Power BI, supply chain, poultry industry, information transparency, collaboration in the supply chain
Indonesia's economy is supported by the livestock industry, especially poultry, which absorbs a lot of labor and improves the nutritional status of the community through the provision of animal protein [1]. The poultry industry in Indonesia, particularly in Central Java, faces serious challenges that threaten the sustainability of farmers' businesses. Although poultry consumption has been increasing from 2018 to 2023, poultry production in Central Java fluctuates, making it difficult for producers to meet rising market demand [2]. This has caused major losses for poultry farmers, with an estimated loss per chicken of around IDR 3,000 per kg. According to Suharsih et al. [3], this condition is exacerbated by the selling price of live poultry at the farmer level, which is far below the production cost price [4], while prices at the consumer level are relatively stable. As a result, the number of independent poultry farmers continues to decline, which has the potential to have long-term impacts on the poultry industry and related sectors [5]. The livestock supply chain in Indonesia is the main pillar of the production process and distribution of animal livestock products. The efficiency of each supply chain process is highly dependent on its supply chain model [6, 7]. Therefore, developing a measurable and transparent supply chain model is essential to improve the overall performance of the supply chain [8].
However, the lack of access to information for poultry farmers hinders their ability to plan production and meet demand appropriately [9]. The lack of transparency of information triggers anxiety for farmers and can cause financial losses that disrupt the welfare of farmers in Indonesia [10]. Poultry meat supply chains in Indonesia play an important role in the economy and nutrition but face various challenges that cause inefficiencies, especially for independent farmers. Research by Ali et al. [11] shows that the industry operates under Volatility, Uncertainty, Complexity, Ambiguity (VUCA) conditions caused by fluctuations in live poultry prices and uncertainty related to imports. In addition, a study by Chapot et al. [12] noted that many smallholder farmers have difficulty accessing timely and reliable information, as well as a lack of collaboration between sectors. This research emphasizes the need for better information systems to improve productivity and profitability. To address these challenges, this study proposes a Collaborative Planning, Forecasting, and Replenishment (CPFR) model for the poultry meat supply chain, using Power BI to improve collaboration and transparency between stakeholders. While CPFR has been established as a valuable framework for supply chain collaboration, and Power BI is recognized for its data visualization capabilities, their synergistic integration has not been thoroughly explored within the context of the Indonesian poultry industry. This research contributes to supply chain management and provides practical implications for the industry.
2.1 CPFR model in poultry meat supply chain
Information transparency, which is the objective presentation of data without distortion, plays an important role in data-driven decision making throughout the supply chain. In the context of the poultry meat supply chain in Indonesia, the lack of information transparency is a major problem that causes uncertainty for farmers and hinders effective production planning [11]. Previous research shows that information transparency can help stakeholders make better decisions, reduce risk, and improve supply chain efficiency [13]. However, the challenge of integrating data from multiple sources to provide a comprehensive picture remains a significant obstacle. In addition, poultry meat supply chain effectiveness is also a major concern to ensure customer satisfaction, competitiveness, and sustainability of profits [14]. Comprehensive performance measurements, such as forecasting accuracy, response time, flexibility, inventory turnover, and production costs, are essential to identify areas for improvement [15]. Unfortunately, traditional approaches often do not deliver optimal results due to a lack of data integration and collaboration between stakeholders.
Power BI has been identified as a potential tool for improving transparency and collaboration in the poultry meat supply chain. With its ability to integrate data from multiple sources and visualize trends in real-time, Power BI can assist stakeholders in making better decisions [16]. However, previous research has not fully explored how Power BI can be applied specifically to the scope of the poultry meat supply chain in the CPFR model to improve supply chain efficiency and sustainability. The CPFR model offers a collaborative approach that allows stakeholders to accurately share information and plan their operations together. Previous studies have shown that CPFR can improve forecasting accuracy, reduce risk, and increase supply chain efficiency [17, 18]. In addition, the success of CPFR relies heavily on the trust between partners in sharing timely and high-quality information. From this literature review, there are several major gaps: lack of data integration across stakeholders for holistic information transparency; lack of Power BI implementation in CPFR models to improve collaboration; and no specific approach that combines information transparency with real-time supply chain performance measurement. This research offers novelty by developing a Power BI-based CPFR model specifically designed to improve information transparency and collaboration in the poultry meat supply chain in Indonesia. This model focuses not only on data integration but also on performance improvement through real-time analysis that supports strategic decision making.
2.2 Confirmatory factor analysis
Confirmatory Factor Analysis (CFA) is a statistical analysis technique used to test how well-measured variables represent constructs or factors that cannot be measured directly [19]. According to reference [20], in CPFR, CFA validates the measurement model, analyzes success factor relationships, and compares the fit of the model with empirical data. CFA is the first step before more complex structural models. In summary, CFA is important for the evaluation of CPFR and forms the basis for further research into its benefits in supply chain management.
2.3 Conceptual model
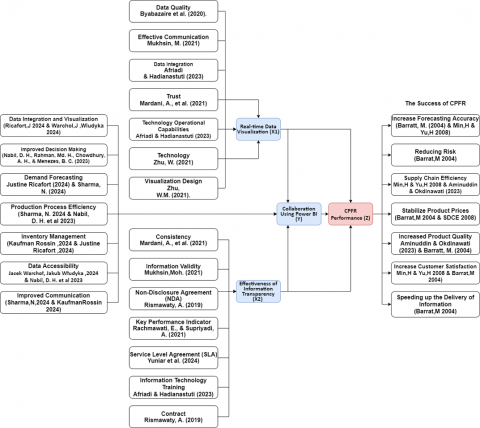
Variables are interrelated with supporting factors that strengthen their position. A conceptual model that links real-time data visualization and information transparency is critical to the success of CPFR. Power BI supports real-time data integration, improving decision speed and accuracy. Its interactive features make it easy to identify patterns and increase trust between teams. Here is a conceptual model that illustrates this relationship as shown in Figure 1.
Figure 1 illustrates the research model, where Variable X1 (Real-time data visualization) is supported by Data Quality, Effective Communication, Data Integration, Retailer Trust, Technology, and Visual Design [21-24]. Then Variable X2 (Information Transparency) has supporting variables, namely Consistency, Information Validity, Non-Disclosure Agreement (NDA), Key Performance Indicator (KPI), Service Level Agreement (SLA), Information Technology Training, and Contracts [21, 22, 25-28]. Then in the Mediating Variable, Variable Y (Collaboration with Power BI) is supported by data integration, visualization, decision making, demand forecasting, production efficiency, inventory management, data access, and communication [29, 30]. These variables support the design of the CPFR Model, including Variable Z, which improves forecast accuracy, reduces risk, supply chain efficiency, and stabilizes prices, product quality, customer satisfaction, and information delivery [31-33].
2.4 Research variable hypothesis
To predict whether the relationship between each variable is significant or not in this test, the following is a hypothesis of the relationship between variables both directly and indirectly.
H1: Relationship between Real-Time Data Visualization and Power BI
Real-time data visualization, as measured by data quality, effective communication, and data integration, significantly improves the implementation of Power BI in the poultry meat supply chain. This is based on the theory proposed by Irawan et al. [34] and Tirupati et al. [35], which states that real-time data visualization improves decision-making efficiency in supply chain management.
H2: Relationship between Real-Time Data Visualization and CPFR
Real-time data visualization positively and significantly influences the successful implementation of CPFR in the poultry meat supply chain through improved coordination and better decision-making. This is supported by research by Mahendra [36], which shows that data visualization helps stakeholders in the supply chain gain immediate insight into operational performance.
H3: Relationship between Information Transparency and Power BI
Information transparency, as measured by openness, accuracy, and accessibility of data, significantly improves the implementation of Power BI in the poultry meat supply chain. This is consistent with the study by Avinda et al. [37], who found that the use of Power BI contributes to the improvement of information transparency, accountability, and decision-making quality within the enterprise.
H4: Relationship between Information Transparency and CPFR
Information transparency positively and significantly influences the successful implementation of CPFR in the poultry meat supply chain through increased trust and collaboration among supply chain partners. This is supported by the research of Rosihan et al. [38], which shows that CPFR implementation significantly reduces the bullwhip effect, emphasizing the importance of access to accurate demand information.
H5: Relationship between Power BI and CPFR
The implementation of Power BI significantly improves the success of CPFR in the poultry meat supply chain by providing a platform for information sharing and collaborative decision-making. This is based on the findings of Jufri et al. [39], which showed that Microsoft Power BI improves the efficiency and accuracy of planning and decision-making in CPFR.
H6: Relationship between Real-Time Data Visualization and CPFR through Power BI
Power BI mediates the positive relationship between real-time data visualization and CPFR in the poultry meat supply chain. Real-time data visualization increases the effectiveness of Power BI, which in turn increases the success of CPFR. This is in line with research by Sabrina [40] and Anggraeni et al. [41], which shows that Power BI allows data to be visualized in real-time, providing fast and accurate insights into current conditions, which is crucial in the context of CPFR.
H7: Relationship between Information Transparency and CPFR through Power BI
According to Susanto and Tantawi [42], Information transparency is critical to the success of CPFR, as it gives all parties in the supply chain access to accurate, real-time data. Power BI supports transparency with interactive data visualization and source integration, reducing the risk of demand prediction errors and inventory mismatches. This study hypothesizes that Power BI mediates the relationship between information transparency and CPFR implementation.
Figure 1. Conceptual model [18, 20, 22, 24, 26-35, 39]
3.1 Research approach
This study uses a quantitative approach to analyze how the implementation of CPFR with Power Business Intelligence (BI) affects the welfare of poultry farmers. The objective was to find the success factors of the CPFR. Data were collected through a questionnaire survey and analyzed using the path analysis method with Structural Equation Modeling (SEM).
3.2 Population and sample
The population of this study includes parties in the poultry meat supply chain, including feed production, farms, abattoirs, producers, and marketers. The sample was purposively drawn based on experience with the Cost of Production (COGS) of poultry meat products, involving 119 respondents to ensure representative results.
3.3 Research variables
Table 1 shows the definition of each variable and the indicators of the impact resulting from the implementation of these variables. Table 1 also shows how each variable indicates its benefit or role in the poultry meat supply chain independently before the variables are connected.
Table 1. Research variables
|
Variables |
Definition |
Indicator |
|
Real-Time Data Visualization |
The relationship between the Real-Time Data Visualization variables and the variables Forecasting Accuracy, Reducing Risk, Supply Chain Efficiency, Product Price Stability, Increasing Product Quality, Increasing Customer Satisfaction, and Speed of Information Delivery. |
Real-Time Data Visualization to Improve Forecasting Accuracy |
|
Real-Time Data Visualization in Reducing Risk |
||
|
Real-Time Data Visualization to Improve Supply Chain Effectiveness |
||
|
Real-Time Data Visualization to Maintain Product Price Stability |
||
|
Real-Time Data Visualization to Improve Product Quality |
||
|
Real-Time Data Visualization to Increase Customer Satisfaction |
||
|
Real-Time Data Visualization to Accelerate Information Delivery |
||
|
Effectiveness of Information Transparency |
The relationship between the variable of Information Transparency Effectiveness to the variables of Forecasting Accuracy, Reducing Risk, Supply Chain Efficiency, Product Price Stability, Increasing Product Quality, Increasing Customer Satisfaction, and Speed of Information Delivery. |
Effectiveness of Information Transparency in Improving Forecasting Accuracy |
|
Effectiveness of Information Transparency in Reducing Risk |
||
|
Effectiveness of Information Transparency in improving supply chain effectiveness |
||
|
Effectiveness of Information Transparency in maintaining product price stability |
||
|
Effectiveness of Information Transparency in Improving Product Quality |
||
|
Effectiveness of Information Transparency in Increasing Customer Satisfaction |
||
|
Effectiveness of Information Transparency in accelerating the delivery of information |
||
|
Collaboration using Power BI |
The relationship between Collaboration variables using Power BI to Forecasting Accuracy, Reducing Risk, Supply Chain Efficiency, Product Price Stability, Increasing Product Quality, Increasing Customer Satisfaction, and Speed of Information Delivery. |
Collaboration using Power BI to improve forecasting accuracy |
|
Collaboration using Power BI in Reducing Risk |
||
|
Collaboration using Power BI to improve supply chain effectiveness |
||
|
Collaboration using Power BI to maintain product price stability |
||
|
Collaboration using Power BI to improve product quality |
||
|
Collaboration using Power BI to improve customer satisfaction |
||
|
Collaboration using Power BI to accelerate information delivery |
||
|
Collaborative, Planning, Forecasting, and Replenishment (CPFR) |
The relationship between the CPFR variable and the variables Forecasting accuracy, Risk reduction, Supply chain efficiency, Product price stability, increasing product quality, increasing customer satisfaction, and Speed of information delivery. |
Collaboration using CPFR to improve forecasting accuracy |
|
Collaboration Using CPFR in Reducing Risk |
||
|
Collaboration using CPFR to improve supply chain effectiveness |
||
|
Collaboration using CPFR to maintain product price stability |
||
|
Collaboration using CPFR to improve product quality |
||
|
Collaboration using CPFR to improve customer satisfaction |
||
|
Collaboration using CPFR to accelerate information delivery |
3.4 Steps in SEM analysis
Following Ghozali’s guidelines, the SEM analysis in this study was conducted through the following structured steps, each described in detail:
By organizing the SEM process into these subsections, the analysis becomes more systematic and accessible to readers, ensuring clarity in understanding the methodology and results.
4.1 Respondent classification
The classification of respondents in this study was carried out carefully, dividing individuals based on several important categories. In this study, 73.9% of respondents were male, with age groups of 26-40 years and 41-50 years at 34.5% each. Most were from the livestock sector (62.2%), followed by poultry meat production (16.8%). 67.2% were permanent employees, and 39.5% had 0-1.5 years of work experience. These findings show the dominance of the livestock sector and permanent employees, providing insights for further demographic analysis.
4.2 Data processing using SPSS
The following are the results of data processing using SPSS, which is done sequentially from the questionnaire data as shown in Table 2. The results of data identification and validation show that they have met the validity criteria with a significance level below 0.05. Therefore, the data can be employed as a basis for analysis and interpretation of research results.
Table 2. Reliability testing
|
Reliability Statistics |
|
|
Cronbach's Alpha |
N of Items |
|
.957 |
28 |
The reliability analysis shows that the Cronbach's Alpha coefficient for all items reaches 0.957, which means that these variables have sufficient reliability (>0.70) and can be used as valid measurement instruments. Then, the KMO and Barlett's Test can be carried out as a CFA test (Table 3).
Table 3. KMO and Barlett's test
|
KMO and Barlett’s Test |
||
|
Kaiser-Meyer-Olkin Measure of Sampling Adequacy |
.861 |
|
|
Barelett’s Test of Sphericity |
Approx. Chi-Square |
1782.121 |
|
df |
378 |
|
|
Sig. |
.000 |
|
On CFA Testing, the KMO value of 0.861 indicates good sample adequacy for factor analysis, and the Bartlett's test p-value of 0.000 proves that factor analysis is appropriate, and variables have significant correlations, then the normality test can be carried out. In this study, the normality test was carried out using the Kolmogorov-Smirnov method (Table 4).
Table 4. Normality test
|
Tests of Normality |
||||||
|
Kolmogorov-Smirnov |
Shapiro-Wilk |
|||||
|
|
Statistic |
df |
Sig. |
Statistic |
df |
Sig. |
|
X1 |
.176 |
119 |
.000 |
.912 |
119 |
.000 |
|
X2 |
.113 |
119 |
.001 |
.942 |
119 |
.000 |
|
Y |
.136 |
119 |
.000 |
.925 |
119 |
.000 |
|
Z |
.148 |
119 |
.000 |
.944 |
119 |
.000 |
The significance value of the normality test above is 0.000, which is below 0.05, therefore, it is necessary to carry out further testing using a non-parametric test (Table 5).
Table 5. Non-parametric test
|
Npar Tests |
||
|
One-Sample Kolmogorov-Smirnov Test |
||
|
Unstandardized Residual |
||
|
N |
119 |
|
|
Normal Parameters |
Mean |
.0000000 |
|
Std. Deviation |
1.70413956 |
|
|
Most Extreme Differences |
Absolute |
.073 |
|
Positive |
.046 |
|
|
Negative |
-.073 |
|
|
Test Statistics |
.073 |
|
|
Asymp. Sig. (2-tailed) |
.185 |
|
The non-parametric test results show a value of 0.185, which is greater than 0.05. Thus, the data from 119 respondents can be considered normal or normally distributed.
4.3 SEM analysis
In psychometric analysis, Cronbach's Alpha, rho_A, and AVE assess the reliability and validity of measurement instruments, where reliability reflects internal consistency and convergent validity indicates conformity to the intended concept (Table 6).
Table 6. Data validity and reliability test
|
Path |
Cronbach's Alpha |
Rho_A |
Composite Reliability |
AVE |
|
X1 |
0.882 |
0.883 |
0.908 |
0.585 |
|
X2 |
0.845 |
0.854 |
0.883 |
0.522 |
|
Y |
0.880 |
0.882 |
0.906 |
0.581 |
|
Z |
0.843 |
0.846 |
0.882 |
0.517 |
Real-time data visualization (X1) and Information Transparency (X2) have high reliability (Cronbach's Alpha: 0.882, 0.845). Power BI (Y) and CPFR (Z) also showed strong reliability.where these results show Cronbach's Alpha, rho_A, and AVE have the reliability and validity of measurement instruments that reflect internal consistency and convergent validity in accordance with the concept of the model created (Table 7).
Table 7. Discriminant validity
|
Path |
X1 |
X2 |
Y |
Z |
|
X1 |
0.765 |
|
|
|
|
X2 |
0.790 |
0.722 |
|
|
|
Y |
0.699 |
0.742 |
0.762 |
|
|
Z |
0.854 |
0.857 |
0.884 |
0.719 |
Discriminant validity analysis shows that the correlation between the variables Real-time Data Visualization (X1), Information Transparency (X2), Power BI (Y), and CPFR (Z) is quite high but below 0.90, indicating that the constructs in the model are well met (Table 8).
Table 8. R square
|
Path |
R Square |
R Square Adjusted |
|
Y |
0.584 |
0.577 |
|
Z |
0.909 |
0.907 |
Regression analysis shows a strong relationship between Power BI Implementation and CPFR, with an R Square of 0.909. This means 90% of the variation in CPFR is explained by Power BI Implementation, which has a significant effect on its success.
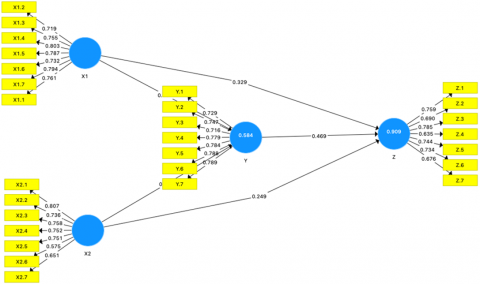
4.4 SEM diagram (PLS algorithm)
This model shows the relationship between the latent variables Real-time Data Visualization (X1) and Information Transparency (X2) on the mediating variables Power BI Implementation (Y) and Collaboration Success using CPFR (Z). Real-time Data Visualization (X1) has a significant positive effect on Power BI Implementation (Y) with a coefficient of 0.301, while Information Transparency (X2) also has a significant positive effect with a coefficient of 0.504. The implementation of Power BI has a significant positive effect on CPFR (Z) with a coefficient of 0.469. In addition, Real-time Data Visualization has a direct positive effect on CPFR (0.329), and Information Transparency also has an effect on CPFR (0.249). This model shows that both influence CPFR positively, but with Power BI Implementation as a mediating variable, the significance value is higher.so that it can be seen from the high value of the coefficient that the role of the implementation of power bi (Y) as mediation is better in achieving successful collaboration using CPFR than the direct relationship Real-time Data Visualization (X1) and Information Transparency (X2) (Figure 2).
Figure 2. Diagram SEM
Table 9. Direct effect and indirect effect
|
Path |
Original Sample (O) |
Sample Mean (M) |
Standard Deviation (STDEV) |
T Statistics (O/STDEV) |
p values |
Indication of Validity |
|
Direct Effect |
||||||
|
X1->Y |
0.301 |
0.296 |
0.100 |
2.999 |
0.003 |
Valid |
|
X1->Z |
0.470 |
0.464 |
0.075 |
6.271 |
0.000 |
Valid |
|
X2->Y |
0.504 |
0.510 |
0.093 |
5.408 |
0.000 |
Valid |
|
X2->Z |
0.486 |
0.493 |
0.071 |
6.829 |
0.000 |
Valid |
|
Y->Z |
0.469 |
0.466 |
0.050 |
9.343 |
0.000 |
Valid |
|
Indirect Effect |
||||||
|
X1->Y->Z |
0.141 |
0.138 |
0.051 |
2.792 |
0.005 |
Valid |
|
X2->Y->Z |
0.237 |
0.237 |
0.049 |
4.817 |
0.000 |
Valid |
The following is an explanation of the direct effect and effect through mediation variables (indirect effect) based on the results of the analysis of each path in the Table 9:
5.1 Conclusion
The conclusion of the analysis shows that real-time data visualization (X1) and information transparency (X2) have a significant effect on the implementation of Power BI (Y) and CPFR (Z), both directly and indirectly. Both affect the use of Power BI and the success of CPFR, with Power BI serving as a bridge between the two. This study introduces a customized CPFR model for the poultry industry in Indonesia, which uses Power BI to improve transparency and collaboration among stakeholders. This study addresses the gap in previous research by providing a specific collaborative framework that addresses the unique challenges faced by the Indonesian poultry supply chain.
The findings of this study have practical implications for stakeholders in the poultry supply chain. Stakeholders in the poultry supply chain need to focus on three key elements: quality data visualization and information transparency, proper use of Power BI, and implementation of a structured implementation process for effective collaboration outcomes. By focusing on these elements, stakeholders can improve decision-making, reduce risks, increase supply chain efficiency, improve farmer welfare, and enhance the competitiveness of the Indonesian poultry industry.
5.2 Managerial implications
Based on the research findings, to advance the poultry industry in Indonesia, industry players are advised to adopt an integrated information system based on Power BI that is designed according to the needs of each stakeholder, such as farmers, policy makers, and supply chain managers. For farmers, the dashboard should display easy-to-understand data on market prices, weather, and best farming practices. Policy makers need to be provided with analysis of industry trends and the impact of existing policies, while supply chain managers should focus on operational performance metrics and logistics efficiency. The government also needs to formulate policies that support information transparency, provide incentives for the adoption of this technology, and provide adequate training and digital infrastructure. In addition, further research is needed to explore the long-term impact of the transparency system and develop a more accurate demand prediction model. These steps are expected to improve operational efficiency, data transparency, and the welfare of all actors in the poultry meat supply chain, especially farmers as the most affected parties. These recommendations aim to ensure that all stakeholders can adapt to technological changes and improve their overall performance.
[1] Kementerian Koordinator Bidang Perekonomian Republik Indonesia. (2022). Dukungan bagi Korporasi Peternakan Terintegrasi Model Klaster untuk Gerakkan Ekonomi Pedesaan.
[2] Jumlah Ternak Indonesia. (2024). Badan Pusat Statistik. https://www.bps.go.id/indicator/24/488/1/produksi-daging-ayam-ras-pedaging-menurut-provinsi.html.
[3] Sumiati, Fadilah, R., Darmawan, A., Nadia, R. (2025). Challenges and constraints to the sustainability of poultry farming in Indonesia. Animal Bioscience, 38(4): 802-817. https://doi.org/10.5713/ab.24.0407
[4] Gunawan, I. (2023). Harga Ayam Anjlok, Peternak Kecil Rugi Rp3,2 Triliun Per Tahun. https://ekonomi.bisnis.com/read/20230110/12/1616772/harga-ayam-anjlok-peternak-kecil-rugi-rp32-triliun-per-tahun.
[5] Kurniawati. (2021). Sektor Pertanian Jadi Kekuatan Ekonomi Indonesia. Berita Magelang. http://beritamagelang.id/sektor-pertanian-jadi-kekuatan-ekonomi-indonesia.
[6] Liu, X.L., Dou, Z.W., Yang, W. (2021). Research on influencing factors of cross border E-commerce supply chain resilience based on integrated fuzzy DEMATEL-ISM. IEEE Access, 9: 36140-36153. https://doi.org/10.1109/ACCESS.2021.3059867
[7] Qin, J.J., Fu, H.P., Wang, Z.P., Xia, L.J. (2021). Financing and carbon emission reduction strategies of capital-constrained manufacturers in E-commerce supply chains. International Journal of Production Economics, 241: 108271. https://doi.org/10.1016/j.ijpe.2021.108271
[8] Razavian, E., Tabriz, A.A., Zandieh, M., Hamidizadeh, M.R. (2021). An integrated material-financial risk-averse resilient supply chain model with a real-world application. Computers & Industrial Engineering, 161: 107629. https://doi.org/10.1016/j.cie.2021.107629
[9] Akbar, M.W.S., Fariyanti, A., Adhi, A.K. (2022). Pengaruh kemitraan terhadap risiko produksi usaha ternak ayam broiler di kabupaten Serang provinsi Banten. Journal of Indonesian Agribusiness, 10(1): 85-100. https://doi.org/10.29244/jai.2022.10.1.85-100
[10] Harianto, A., Livestock, H. (2024). 4 Risiko Ternak Bebek Petelur dan Pedaging Beserta Solusinya. HOBI TERNAK. https://hobiternak.com/risiko-ternak-bebek/.
[11] Ali, P.R., Machfud, M., Sukardi, S., Noor, E., Purnomo, D. (2021). The challenges in Indonesia poultry industry business. In the 11th Annual International Conference on Industrial Engineering and Operations Management, Harbin, China, pp. 5433-5443. https://doi.org/10.46254/AN11.20210921
[12] Chapot, L., Hibbard, R., Ariyanto, K.B., Maulana, K.Y., Yusuf, H., Febriyani, W., Cameron, A., Paul, M., Vergne, T., Faverjon, C. (2024). Needs and capabilities for improving poultry production and health management in Indonesia. PloS One, 19(8): e0308379. https://doi.org/10.1371/journal.pone.0308379
[13] Brun, A., Karaosman, H., Barresi, T. (2020). Supply chain collaboration for transparency. Sustainability, 12(11): 4429. https://doi.org/10.3390/su12114429
[14] Ramadhani, K. (2023). Supply chain management: Definisi, Tujuan, Fungsi, Manfaat, Prinsip Dan Praktik terbaik. PRIEDS. https://www.prieds.com/post/supply-chain-management-definisi-tujuan-fungsi-manfaat-prinsip-dan-praktik-terbaik.
[15] Jagan, M.R.K., Neelakanteswara, R.A., Krishnanand, L. (2019). A review on supply chain performance measurement systems. Procedia Manufacturing, 30: 40-47. https://doi.org/10.1016/j.promfg.2019.02.007
[16] Sugiarto, D., Mardianto, I., Najih, M., Adrian, D., Pratama, D.A. (2021). Perancangan dashboard untuk visualisasi harga dan pasokan beras di pasar induk beras cipinang. Jurnal Teknologi Industri Pertanian, 31(1): 12-19. https://doi.org/10.24961/j.tek.ind.pert.2021.31.1.12
[17] Kurniawan, E.R. (2017). Perancangan collaborative planning forecasting replenishment “travel bag” pada travel agent dwidaya tour tour. Doctoral dissertation, Universitas Mercu Buana Jakarta-Menteng. https://repository.mercubuana.ac.id/id/eprint/64808.
[18] Kusrini, E., Subagyo, Masruroh, N.A. (2016). A new approach to design supply chain key performance indicator for actors and regulator: A case study in innovative product in Indonesia. International Journal of Business Performance Management, 17(1): 1-29. https://doi.org/10.1504/IJBPM.2016.073315
[19] Varadejsatitwong, P., Banomyong, R., Julagasigorn, P. (2022). A proposed performance-measurement system for enabling supply-chain strategies. Sustainability, 14(19): 11797. https://doi.org/10.3390/su141911797
[20] Aminuddin, R.R., Okdinawati, L. (2023). Supply chain through contract farming in Indonesian poultry industry. Journal of Business and Management Review, 4(2): 104-128. https://doi.org/10.47153/jbmr42.6272023
[21] Merino, J., Xie, X., Parlikad, A.K., Lewis, I., McFarlane, D. (2020). Impact of data quality in real-time big data systems. Cambridge University, Workshop Proceedings. https://doi.org/10.17863/CAM.59426
[22] Byabazaire, J., O’Hare, G., Delaney, D. (2020). Data quality and trust: Review of challenges and opportunities for data sharing in IoT. Electronics, 9(12): 2083. https://doi.org/10.3390/electronics9122083
[23] Ahmed, S., Rivera Gomis, J.R.G., Duncan, A.J., Berezowski, J., da Costa, M.R. (2024). An innovative and reproducible data visualization tool for continued monitoring and surveillance of pig health, welfare, and public health using abattoir data. In Conference 17th International Symposium of Veterinary Epidemiology and Economics, Sydney, Australia. https://pure.sruc.ac.uk/en/publications/an-innovative-and-reproducible-data-visualization-tool-for-contin.
[24] Zhu, W.M. (2021). A study of big-data-driven data visualization and visual communication design patterns. Scientific Programming, 2021(1): 6704937. https://doi.org/10.1155/2021/6704937
[25] Gosal, F.V., Mokat, J.E.H., Wawointana, T. (2024). Implementasi kebijakan keterbukaan informasi publik di kabupaten minahasa tenggara. Bureaucracy Journal: Indonesia Journal of Law and Social-Political Governance, 4(3): 2941-2958.
[26] Mukhsin, M. (2021). Kerjasama dan berbagi informasi dalam rantai pasokan. https://eprints.untirta.ac.id/13824/2/Buku%20Digital%20-%20KERJASAMA%20DAN%20BERBAGI%20INFORMASI%20DALAM%20KINERJA%20RANTAI%20PASOKAN.pdf.
[27] Yuniar, V.R., Zabina, K.A., Zakiah, M.N., Wulansari, A. (2024). Peran Key Performance Indicators (KPI) dalam meningkatkan kualitas pelayanan rumah sakit: Literature review. Jurnal Multimedia Dan Teknologi Informasi (Jatilima), 6(2): 72-86. https://doi.org/10.54209/jatilima.v6i02.433
[28] Rismawaty, A. (2019). Non disclosure agreement sebagai perlindungan hak kekayaan intelektual dalam perjanjian kerjasama. Aktualita: Jurnal Hukum, 2: 339-353. https://doi.org/10.29313/aktualita.v2i1.4706
[29] Nabil, D.H., Rahman, M.H., Chowdhury, A.H., Menezes, B.C. (2023). Managing supply chain performance using a real time Microsoft Power BI dashboard by action design research (ADR) method. Cogent Engineering, 10(2): 2257924. https://doi.org/10.1080/23311916.2023.2257924
[30] Afriadi, H.M.T., Hadianastuti, F.L. (2023). Rancang Bangun sistem informasi dashboard pengendalian produksi welding menggunakan Microsoft Power BI pada PT ABC. Journal of Manufacturing and Enterprise Information System, 1(1): 21-31. https://doi.org/10.52330/jmeis.v1i1.86
[31] Barratt, M. (2004). The impact of collaborative planning on supply chain performance. Supply Chain Management: An International Journal, 9(5): 359-370. https://doi.org/10.1108/13598540410561547
[32] Min, H., Yu, W.B. (2008). Collaborative planning, forecasting and replenishment: Demand planning in supply chain management. International Journal of Information Technology and Management, 7(1): 4-20. https://doi.org/10.1504/IJITM.2008.015886
[33] Andrews, J. (2008). CPFR: Considering the options, advantages and pitfalls. Supply and Demand Executive, 9(3): 8-12.
[34] Irawan, B.H., Ariyanto, N.P., Novianti, N.A., Widiastuti, H., Restu, F., Arifin, N.L. (2022). Penggunaan power BI untuk pengolahan data non-conformance material. Jurnal Teknologi dan Riset Terapan (JATRA), 4(2): 52-57. https://doi.org/10.30871/jatra.v4i2.3885
[35] Tirupati, K.K., Joshi, A., Singh, S.P., Chhapola, A., Jain, S., Gupta, A. (2024). Leveraging power BI for enhanced data visualization and business intelligence. Universal Research Reports, 10(2). https://doi.org/10.36676/urr.v10.i2.1375
[36] Mahendra, A. (2024). Visualisasi data untuk pemantauan kinerja proyek: Teknik dan tools. Jurnal Teknologi Pintar, 4(5).
[37] Avinda, M., Tarigan, R.E., Widjaja, A.E. (2017). Evaluasi aplikasi business intelligence pada proyek Indonesia WIFI PT. PINS Indonesia. Prosiding SISFOTEK, 1(1): 1-6.
[38] Rosihan, R.I., Paduloh, P., Sulaeman, D. (2021). Penerapan collaborative planning, forecasting and replenishment (CPFR) guna mengurangi bullwhip effect di PT. XYZ. Prosiding Seminar Nasional Aplikasi Sains & Teknologi, 20: 1-8.
[39] Jufri, M.A., Alam, S., Aris, V. (2024). Implementation of power BI as key performance indicators analysis in monitoring business operational control at PT. Mandiri Harapan Jaya. Innovative: Journal of Social Science Research, 4(4): 2563-2572. https://doi.org/10.31004/innovative.v4i4.11978
[40] Sabrina, S.S. (2024). Visualisasi data penyebab kematian di Indonesia rentang tahun 2000-2022 dengan power bi. Jurnal Informatika dan Teknik Elektro Terapan, 12(2): 948-955. http://doi.org/10.23960/jitet.v12i2.4071
[41] Anggraeni, D., Maharani, D., Putra, G.M. (2024). Penerapan microsoft power BI dalam pengolahan dan visualisasi data statis dan interktif. Interaksi: Jurnal Pengabdian Kepada Masyarakat, 1(1): 46-50.
[42] Susanto, J., Thantawi, A.M. (2024). Implementasi business perfomance dashboard untuk memonitoring booking pembiayaan pada Pt. internusa tribuana citra multi finance Jakarta. Ikraith-Informatika, 8(2). https://doi.org/10.37817/ikraith-informatika.v8i2.3041
[43] Hair Jr, J.F., Black, W.C., Babin, B.J., Anderson, R.E., Tatham, R.L. (2010). SEM: An introduction. Multivariate data analysis: A global perspective. ResearchGate, pp. 629-986. https://www.researchgate.net/publication/303049557_SEM_An_introduction_Multivariate_data_analysis_A_global_perspective.