Zainal Arifin*![]() | Farrel Julio Regannanta
| Farrel Julio Regannanta![]() | Singgih Dwi Prasetyo
| Singgih Dwi Prasetyo![]() | Noval Fattah Alfaiz
| Noval Fattah Alfaiz![]() | Watuhumalang Bhre Bangun
| Watuhumalang Bhre Bangun![]() | Mohd Afzanizam Mohd Rosli
| Mohd Afzanizam Mohd Rosli![]()
© 2025 The authors. This article is published by IIETA and is licensed under the CC BY 4.0 license (http://creativecommons.org/licenses/by/4.0/).
OPEN ACCESS
Solar energy is an extensively utilized renewable resource due to its plentiful availability. However, the efficiency of solar panels can diminish as their operating temperatures rise. To mitigate this problem, it is crucial to have an effective cooling system for sustaining optimal temperatures. One effective solution is the integration of photovoltaic and thermal components within a combined photovoltaic thermal collector (PV/T) system. This study focuses on advancing the PV/T system by incorporating internal fins into the collector design. These fins help create turbulence in the fluid flow, significantly enhancing the system's heat transfer performance. A unique aspect of this research is the experimental exploration of combining these internal fins with CuO-water nanofluids, a topic that has not been widely studied in previous research. The aim is to evaluate the operational effectiveness of finned PV/T systems that utilize CuO-water nanofluids in various concentrations as working fluids. The experiments were conducted outdoors, with irradiance levels varying from 560 to 1000 W/m². The performance of solar panels equipped with PV/T systems using different working fluids—water, 0.2% volume CuO-water nanofluid, 0.4% volume CuO-water nanofluid, and 0.6% volume CuO-water nanofluid—was compared. Findings revealed that employing the PV/T system with these working fluids can decrease the solar panel operating temperature by 13.14℃, 17.78℃, 18.46℃, and 18.97℃, respectively. The electrical efficiency observed for the PV/T system varied, yielding 11.25% for water, 12.7% for 0.2% vol. CuO-water nanofluid, 12.95% for 0.4% vol. CuO-water nanofluid, and 13.27% for 0.6% vol. CuO-water nanofluid. Thermal efficiency was recorded for each PV/T system at 32.32%, 68.18%, 76.08%, and 78.11%, respectively.
photovoltaic-thermal collector (PV/T), CuO-water nanofluid, thermal efficiency, electrical efficiency, heat transfer enhancement
In recent years, the impact of greenhouse gases on global climate change has emerged as a significant issue. As a primary source of energy, electricity is still generated mainly from fossil fuels, contributing to various challenges such as air pollution, rising global temperatures, and increased expenses [1]. Furthermore, the supply of fossil fuels is set to diminish annually. As a result, there is a growing demand for green and renewable energy sources [2]. Solar energy is a highly studied and sought-after type of renewable energy, primarily because it is plentiful and has a minimal environmental impact. Despite its advantages, solar energy as an electrical power source has not been fully maximized. One significant reason for this is that the efficiency of solar cells, which are the devices that transform solar energy into electricity, is still quite limited [3]. This phenomenon results from the elevated operating temperatures of photovoltaic solar cells. For every 1℃ rises above the ideal temperature, the efficiency of the solar cells can drop by 0.4-0.5% [4, 5]. A variety of factors can impact the rise in temperature of PV panels, such as the surrounding environmental temperature, the temperature coefficient, wind speed, and how the PV panels are installed [5]. To manage the operational temperature of solar cells, it is essential to implement specific measures, including the use of a cooling system [6]. A specific form of cooling system employed is active cooling, which utilizes a photovoltaic thermal collector (PV/T) [7].
The PV/T system is a hybrid technology that integrates photovoltaic (PV) panels with solar thermal collectors to improve the efficiency of the PV panels [8]. The PV/T (photovoltaic and thermal) system uses water- or air-based fluids that circulate beneath the photovoltaic (PV) panels. This circulation helps dissipate heat, keeping the panels cool. PV/T technology is applied in various fields, including thermal power systems, solar desalination, steam generation, space heating, solar furnaces, and solar water heating [9, 10].
Research on water-based PV/T collectors has shown that configurations with rectangular direct flow can improve efficiency by 12.22%. Additionally, studies comparing water-based and air-based collectors indicate that water-based collectors perform better than air-based ones. Incorporating an active water-cooled heat exchanger behind the PV panel can lower the temperature by approximately 20% and enhance efficiency by 9% [11-13].
Various elements can impact the heat transfer rate in PV/T systems, such as the fluid's properties and the system's flow configuration. Nanoparticles can significantly improve heat transfer efficiency since they demonstrate superior thermal conductivity and cooling capabilities compared to water [14]. Nanoparticles widely used as coolants are TiO2, ZnO, Al2O3, and CuO. CuO nanoparticles are often used because they have a low specific heat [15, 16]. A study examined the effects of adding CuO and Al2O3 nanofluids on thermophysical properties related to heat transfer. The findings indicate that as the mass fraction of nanoparticles increases, the specific heat of the nanofluid decreases, while its thermal conductivity increases. Additionally, the thermophysical properties of CuO nanofluid were superior to those of Al2O3. Another investigation focused on the impact of CuO-Air nanofluid on the performance of photovoltaic/thermal (PV/T) systems. It was observed that a CuO volume fraction of 0.4% proved to be more effective for cooling than both a volume fraction of 0.2% and the use of water [17].
The collector's working fluid can affect the thermal conductivity coefficient of the coolant used in PV/T systems. Nanofluids are more effective in turbulent flow than laminar flow, primarily due to the increased heat transfer contact area present in turbulent conditions. One practical approach to induce turbulent flow in a thermal collector is to incorporate fins inside the PV/T system. Research indicates that adding fins to the thermal collector channel can significantly enhance the efficiency of the PV/T system. Specifically, adding fins reduces the Nusselt number from 19.97 to 16.23, increasing fluid flow turbulence and improving thermal performance [18-20].
This study is focused on assessing how different concentrations of CuO-water nanofluid affect the performance of finned PV/T systems and contribute to lowering the operational temperature of PV panels. The research tested three specific concentrations of CuO-water nanofluid: 0.2%, 0.4%, and 0.6%. To ensure consistent research conditions, all experiments took place on the same day, with equal environmental settings for each concentration tested. The outcomes of this research offer a comparative analysis of the various CuO-water nanofluid concentrations, including evaluations of output power, I-V and P-V curves, and electrical and thermal efficiency measures.
The advancement of PV/T systems has experienced notable growth, especially in thermal management through innovative cooling methods. An auspicious approach uses nanofluids, especially mixtures of copper oxide and water (CuO-water), as an efficient cooling medium. These nanofluids possess excellent thermophysical properties, offering higher thermal conductivity and enhanced heat transfer capabilities than traditional cooling fluids. Such advantages facilitate improved temperature management of PV modules, resulting in increased electrical and thermal efficiency. Table 1 outlines the key results from various studies that showcase the remarkable effectiveness of CuO-water nanofluids in different configurations of PV/T systems.
In summary, integrating copper oxide-water (CuO-water) nanofluid as a cooling medium in PV/T collectors has been shown to significantly enhance system performance, mainly due to its superior thermal properties that enable more effective temperature regulation and improved energy conversion. As outlined in Table 1, previous studies have successfully demonstrated notable gains in thermal and electrical efficiencies when employing CuO-water nanofluids under various operating conditions. However, most of these investigations focus on optimizing nanofluid concentration or modifying the collector’s geometry in isolation. The potential combined impact of enhanced nanofluid heat transfer with structural enhancements such as internal fins that promote turbulence and surface area for heat exchange remains largely unexplored. Therefore, this study addresses that research gap by experimentally evaluating the synergistic effects of different CuO-water nanofluid concentrations in conjunction with fin-integrated PV/T collector designs, to achieve simultaneous and superior improvements in electrical and thermal efficiencies.
Table 1. Summary of CuO-water nanofluid applications in PV/T
|
Nanofluid Type |
Base Fluid |
Key Findings |
Performance Metrics |
References |
|
CuO-Water |
Water |
Demonstrates superior thermophysical properties (e.g., thermal conductivity and heat transfer) compared to conventional fluids. |
Enhanced cooling efficiency, lower PV cell temperature. |
[21, 22] |
|
CuO-Water |
Water |
Integration into serpentine tube collectors significantly reduces module operating temperature. |
Improved electrical output due to reduced heat losses. |
[23, 24] |
|
CuO-Water |
Water |
Increasing nanoparticle concentration results in better thermal and electrical performance. |
Up to 26% increase in thermal efficiency and electrical output. |
[25, 26] |
|
CuO-Water |
Water |
Nanofluid outperforms water in comparative heat transfer performance and operational cooling. |
Higher heat transfer coefficient at optimal CuO concentrations. |
[27, 28] |
|
CuO-Water |
Water |
Proven electrical performance improvement due to efficient thermal management. |
Electrical output increased by >11% over water-based cooling. |
[29, 30] |
3.1 Experimental setup
This research explores the impact of incorporating CuO nanofluid into PV/T systems by assessing and comparing the efficiency of photovoltaic solar panels that utilize water versus those that use CuO nanofluid at different concentrations of 0.2%, 0.4%, and 0.6% by volume as the working fluid. The experimentation took place in July 2024 on the rooftop of the UNS Inn at Universitas Sebelas Maret in Surakarta, Indonesia.
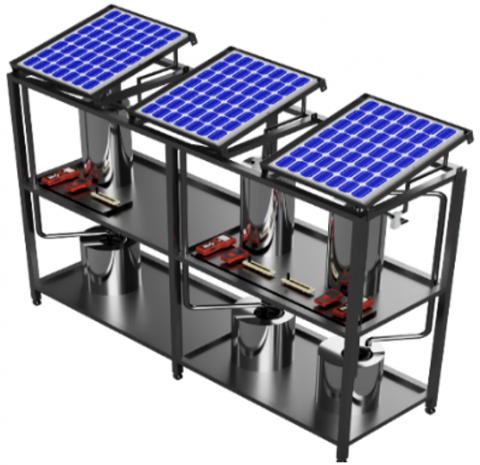
The PV/T system used for experimentation, shown in Figure 1, features polycrystalline photovoltaic panels, a finned thermal collector, a nanofluid reservoir, a pump, a flow measurement device, a heat exchanger tank, a multimeter, a thermocouple data logging system, a solar power meter, and a rheostat slider. To analyze the internal flow behavior, the Reynolds number was computed using the maximum volumetric flow rate (0.0167 m³/s), the hydraulic diameter of the finned channel (0.01 m), and the thermophysical characteristics of the nanofluid, yielding an approximate Reynolds number of 29050, which signifies fully turbulent flow.
The turbulence intensity generated by the fins was estimated to be around 5%, based on findings from research on similar channel geometries, though it was not directly measured. This level of turbulence, along with the increased thermal conductivity associated with CuO nanofluid, is anticipated to enhance the heat transfer efficiency of the PV/T system greatly.
3.2 System component
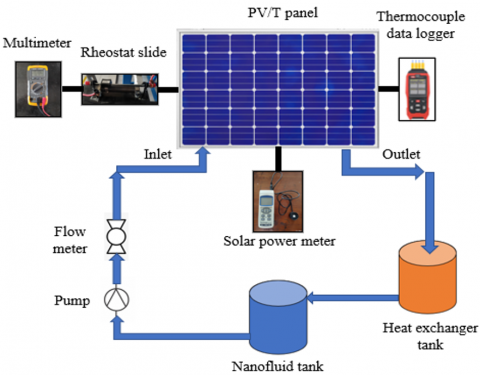
This study introduces a PV/T system that combines various components, each fulfilling a specific role to improve solar energy conversion into electrical and thermal outputs. These elements collaborate to boost overall system performance and ensure accurate data collection during experimental evaluations. The key components include a polycrystalline solar panel, a thermal collector, a pump, a flow meter, a thermocouple data logger, a multimeter, a solar power meter, and a rheostat. Each part has been selected for its technical capabilities and compatibility with the PV/T system's configuration. Table 2 presents a summary of the specifications and functions of these components, providing a detailed overview of the system's technical foundation. Figure 1 shows the isometric and schematic illustration of the PV/T system.
(a)
(b)
Figure 1. (a) Isometric (b) Schema illustrating the PV/T system
Table 2. Component details of the photovoltaic-thermal system
|
No. |
Component |
Specification |
|
1. |
Polycrystalline PV Panel |
This solar panel is rated to produce a maximum power output (Pmax) of 50 Watts. When operating at its peak power, the current (Imp) is 2.27 A, and the voltage (Vmp) measures 18.0 V. The open-circuit voltage (Voc) reaches 21.24 V, with a short-circuit current (Isc) of 3.11 A. The panel's dimensions are 670 mm in length, 530 mm in width, and 30 mm in thickness, and it has an efficiency rating of 17.6%. |
|
2. |
Thermal Collector |
The thermal collector is made from aluminum and is designed in a rectangular direct-flow format, incorporating four internal fins to optimize heat transfer. It has a contact area of 0.030 m by 0.015 m, with a thickness of 0.001 m for the collector and 0.005 m for the fins. The total length of the collector measures 4.61 m. |
|
3. |
Pump |
The pump operates with a power of 45 Watts, has a maximum flow rate (F. Max) of 3500 liters per hour, and a maximum head (H. Max) of 3 meters. |
|
4. |
Flow Meter |
The flow meter is made of acrylic material and has a measurement range from 2 to 18 liters per minute. It offers an accuracy of ±4% and can handle a maximum pressure of less than 0.6 MPa. |
|
5. |
Thermocouple Data Logger |
The data logger is the TASI TA612C 4-channel K-type thermocouple with USB connectivity. It can record up to four temperature input signals simultaneously and is suitable for real-time data logging. |
|
7. |
Multimeter |
Two HELES UX-838TR multimeters were used in the setup, one configured as a voltmeter and the other as an ammeter. These devices provide accurate readings of the electrical parameters of the photovoltaic panel. |
|
8. |
Solar Power Meter |
The Lutron SPM-1116SD is the solar power meter currently in use. Its measurement capacity reaches up to 2000 W/m² and offers a resolution of 0.1 W/m². This meter boasts an accuracy of ±10 W/m² and provides cosine-corrected angular accuracy below 5% for angles under 60°. Data from the meter is recorded on an SD card with storage options ranging from 1 to 16 GB, capturing readings every second. The dimensions of the probe are 38 × 25 mm, and the entire device measures 182 × 73 × 47.5 mm. |
|
9. |
Rheostat |
The rheostat used in this study is a slide-type rheostat, designed as a wire-wound resistor on an insulating cylinder. It can handle high current and voltage levels and is ideal for manual load control in experimental setups. |
3.3 Nanofluid preparation and thermophysical properties
Incorporating nanofluids in PV/T systems presents a significant opportunity to improve heat transfer efficiency, owing to their enhanced thermophysical characteristics compared to traditional fluids. Nanofluids are produced by introducing nanoparticles, like CuO, into a primary fluid, usually water, which alters their thermal conductivity, viscosity, specific heat, and density. These altered properties are vital for assessing the heat transfer capability and energy conversion efficiency of the PV/T system [31].
The characterization of these properties depends on well-established theoretical models, which are detailed in Eqs. (1) to (5). These equations connect the behavior of nanofluids with the concentration of nanoparticles (volume fraction) and fluid flow dynamics. Furthermore, Table 3 provides a summary of the critical parameters, their descriptions, and the governing equations utilized to model the thermophysical properties of the nanofluid in this research [32, 33].
Table 3. Key formulas and parameters for CuO–water nanofluid characterization
|
Parameter |
Description |
Equation |
Number |
Parameter Definitions |
|
Volume Fraction |
Volume-based concentration of nanoparticles in the base fluid. |
$\emptyset=\frac{\left(\frac{w_{n p}}{\rho_{n p}}\right)}{\left(\frac{w_{n p}}{\rho_{n p}}\right)+\left(\frac{w_{b f}}{\rho_{b f}}\right)} \times 100 \%$ |
(1) |
The volume fraction ($\emptyset$) is expressed as a percentage and represents the nanoparticle volume's ratio to the nanofluid's total volume. Here, $w_{np}$ is the mass of nanoparticles (kg), $w_{bf}$ is the mass of the base fluid (kg), $\rho_{n p}$ is the density of nanoparticles (kg/m³), and $\rho_{bf}$ is the density of the base fluid (kg/m³). |
|
Nanofluid Density |
Combined density of base fluid and CuO nanoparticles based on $\emptyset$. |
$\rho_{n f}=\rho_{b f}(1-\emptyset)+\rho_{n p} \emptyset$ |
(2) |
ρnf denotes the density of the nanofluid in kg/m³. |
|
Nanofluid Viscosity |
Viscosity is affected by increased particle interactions at higher $\emptyset$ temperatures, influencing flow and pumping power. |
$\mu_{n f}=\mu_{b f}(1-\phi)^{-2.5}$ |
(3) |
$\mu_{n f}$ is the viscosity of the nanofluid (mPa·s), $\mu_{b f}$ is the viscosity of the base fluid, and $\phi$ represents the nanoparticle volume fraction. An increase in $\phi$ leads to a nonlinear increase in viscosity and affects pumping power requirements. |
|
Specific Heat |
Adequate heat capacity from the weighted contribution of the base fluid and nanoparticles. |
$C_{n f}=C_{b f}(1-\emptyset)+C_{n p} \emptyset$ |
(4) |
$C_{n f}$ is the specific heat capacity of the nanofluid (kJ/kg·K), $C_{b f}$ is the specific heat of the base fluid, and $C_{n p}$ is the specific heat of the nanoparticles. The equation is a linear combination weighted by the volume fraction. |
|
Thermal Conductivity |
Effective thermal conductivity of nanofluid incorporating both static and Brownian motion effects, significant at T > 40℃. |
$\begin{gathered}k_{n f}=k_{ {static }}+k_{ {Brownian }} \\ \rho_{n f}\left[\frac{K_{n p}+2 K_{b f}+2 \emptyset\left(K_{n p}-K_{b f}\right)}{K_{n p}+2 K_{b f}-\emptyset\left(K_{n p}-K_{b f}\right)}\right. \\ k_{ {Brownian }} =5 \times 10^4 \phi \rho_{b f} \sqrt{\frac{K_B T}{\pi d_{n p}}} \frac{k_{b f}}{\mu_{b f}}\end{gathered}$ |
(5) |
$k_{n f}$ is the total thermal conductivity of the nanofluid (W/m·K), including both static and Brownian motion contributions. $K_{b f}$ and $K_{n p}$ are the thermal conductivities of the base fluid and nanoparticles, respectively. $T$ is the absolute temperature (K), $K_B$ is the Boltzmann constant (1.381×10⁻²³ J/K), is the average diameter of the nanoparticles (m), is the density of the base fluid (kg/m³), and $\mu_{b f}$ is the viscosity of the base fluid (mPa·s). Brownian motion enhances thermal conductivity, especially at temperatures above 40℃. |
3.4 PV efficiency analysis
A thorough analysis of its electrical and thermal efficiencies is required to assess the performance of a photovoltaic-thermal (PV/T) system. The efficiency of a PV panel is affected by various operational factors, such as irradiance, current, voltage, and the heat transfer processes occurring within the system. Important performance indicators, including fill factor, electrical efficiency, and both conduction and convection heat transfer, are quantitatively evaluated using established thermodynamic equations. These equations help identify the system’s energy conversion efficiency and thermal characteristics. Table 4 provides an overview of the essential equations and parameter definitions utilized in this analysis, serving as a theoretical foundation for calculating power output and heat gain across different operating scenarios [34, 35].
Table 4. Key formulas and parameters for PV and PV/T system efficiency and heat transfer
|
Parameter |
Equation |
Number |
Parameter Definitions |
|
Fill Factor |
$F F=\frac{I_{M P P} V_{M P P}}{I_{s c} V_{o c}}=\frac{P_{M P P}}{I_{s c} V_{o c}}$ |
(6) |
$FF$ is the fill factor; $I_{M P P}$ and $V_{M P P}$ are the maximum current (A) and voltage (V) at the maximum power point; $I_{s c}$ is the short-circuit current (A); and $V_{o c}$ is the open-circuit voltage (V). |
|
PV Electrical Efficiency |
$\begin{aligned} \eta_{p v} & =\frac{P_{M P P}}{P_{l i g h t}}=\frac{P_{M P P}}{I_{r a d} \times A} =\frac{I_{s c} \times V_{o c} \times F F}{I_{r a d} \times A}\end{aligned}$ |
(7) |
$\eta_{p v}$ is the electrical efficiency; $P_{M P P}$ is the maximum output power (W); $P_{L i g h t}$ is the total solar radiation power (W) received by the panel; $A$ is the PV panel area (m²); and $I_{r a d}$ is the solar irradiance (W/m²). |
|
Conduction Heat Transfer |
$Q_{ {cond }}=k A \frac{\left(T_1-T_2\right)}{L}$ |
(8) |
$Q_{ {cond }}$ is the conduction heat transfer (W); $k$ is the thermal conductivity of the material (W/m·K); $A$ is the contact area (m²); $T_1$ and $T_2$ are the temperatures at each side of the material (K); and $L$ is the thickness or distance of the material (m). |
| Convection Heat Transfer | $q_c=h_c A_s\left(T_s-T_m\right)$ | (9) | $q_c$ is the convection heat transfer (W); $h_c$ is the convection heat transfer coefficient (W/m²·K); $A_s$ is the surface area for heat transfer (m²); $T_s$ is the surface temperature (K); and $T_m$ is the mean or ambient fluid temperature (K). |
| Convection Heat Transfer | $q_c=h_c A \Delta T_{l m}$ | (10) | $h_c$ is the convection coefficient (W/m²·K); $A$ is the area of the surface where heat transfer occurs (m²); and $\Delta T_{l m}$ is the logarithmic mean temperature difference (K) between the inlet and outlet temperature gradients. |
| Log Mean Temperature Difference | $\Delta T_{l m}=\frac{T_i-T_e}{\ln \left[\frac{\left(T_s-T_e\right)}{\left(T_s-T_i\right)}\right]}=\frac{\Delta T_e-\Delta T_i}{\ln \left(\Delta T_e / \Delta T_i\right)}$ | (11) | $T_i$ and $T_e$ are the fluid inlet and outlet temperatures (K), respectively; $T_s$ is the surface temperature (K); $\Delta T_i=T_s-$ $T_i$ and $\Delta T_e=T_s-T_e$ represent the respective temperature differences. |
| Useful Heat Gain | $Q_u=\dot{m} C_p\left(T_e-T_i\right)$ | (12) | $Q_u$ is the useful heat gain (W); $\dot{m}$ is the mass flow rate of the fluid (kg/s); $C_p$ is the specific heat capacity of the fluid (kJ/kg·K); $T_e$ is the outlet temperature (K); and $T_i$ is the inlet temperature (K). |
| Mass Flow | $\dot{m}=\rho \dot{V}$ | (13) | $\dot{m}$ is the mass flow rate (kg/s); $\rho$ is the fluid density (kg/m³); and $V$ is the volume flow rate (m³/s). |
| Thermal Efficiency of PV/T | $\eta_{t h}=\frac{Q_u}{G \times A_m}=\frac{\dot{m} C_p\left(T_e-T_i\right)}{G \times A_m}$ | (14) | $\eta_{t h}$ is the thermal efficiency of the PV/T system; $G$ is the solar radiation intensity (W/m²); $A_m$ is the surface area of the collector (m²); $\dot{m}$ is the mass flow rate (kg/s); $C_p$ is the specific heat capacity (kJ/kg·K); $T_e$ and $T_i$ are outlet and inlet temperatures (K), respectively. |
4.1 Temperature of PV panel
Elevated temperatures in PV panels can adversely affect their performance. Using a PV/T cooling system can help lower the panel's operating temperature, thereby improving its efficiency. By varying the concentration of CuO-water nanofluid as the working fluid, the heat transfer rate in the PV panels can be enhanced, making temperature reduction more effective. Table 5 outlines the thermophysical properties of the working fluids.
Table 5. Thermophysical properties of working fluids
|
Working Fluid |
Density (Kg/m³) |
Dynamic Viscosity (mPa.S) |
Specific Heat (J/kg.K) |
Thermal Conductivity (W/m.K) |
|
Water |
997.05 |
0.000891 |
4182 |
0.6096 |
|
CuO-water (0.2%) |
1008.05 |
0.000895 |
4174.74 |
0.6131 |
|
CuO-water (0.4%) |
1019.06 |
0.000899 |
4167.48 |
0.6165 |
|
CuO-water (0.6%) |
1030.06 |
0.000904 |
4160.21 |
0.6200 |
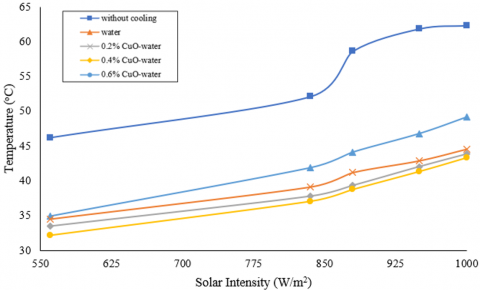
Figure 2. The influence of solar radiation strength on the temperature at which photovoltaic (PV) panels operate
The system's temperature rises as the intensity of solar radiation increases, as shown in Figure 2. The data presented in Figure 2 indicates that the water-based PV/T (photovoltaic/thermal) system operates at a higher temperature than the nanofluid PV/T system. For a solar radiation intensity of 1000 W/m², the recorded working temperatures for the different systems are as follows:
Uncooled PV: 63.32℃
Water working fluid PV/T system:
0.2% vol. CuO-water: 49.18℃
0.4% vol. CuO-water: 44.54℃
0.6% vol. CuO-water: 43.86℃
0.6% vol. CuO-water: 43.35℃
The temperature differences of the PV/T systems with water and CuO-water compared to the uncooled PV system are 13.14℃, 17.78℃, 18.46℃, and 18.97℃, respectively.
With increasing solar radiation intensity, the PV panel absorbs more photon energy. When this energy reaches the band gap energy threshold, it excites the electrons within the PV panel. However, excess photon energy can lead to an increase in the working temperature of the panel. A PV/T collector system can improve the heat transfer rate from the PV panels.
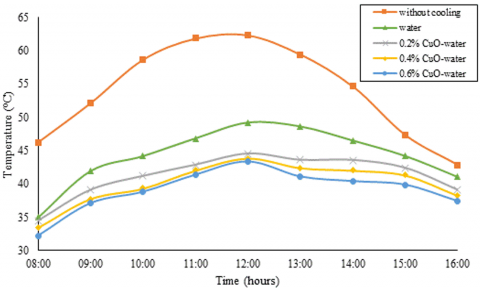
The intensity of solar radiation fluctuates during testing from 08:00 to 16:00. Any increase or decrease in this intensity will influence the operating temperature of the PV panels in every variation of the study. The relationship between the operating temperature of the PV panels and time is depicted in Figure 3.
Figure 3. The working temperature of PV panels is daily
The research findings reveal that the operational temperature of PV systems rises as solar radiation intensity increases [36, 37]. The amount of solar radiation intensity influences the energy from photons that a PV panel absorbs. When photon energy meets the band gap threshold, it stimulates the electrons within the panel. However, if the photon energy goes beyond this threshold, it may raise the operating temperature of the PV panel [37]. Implementing PV/T collector systems can improve heat transfer efficiency from PV panels [38, 39].
4.2 Electrical power
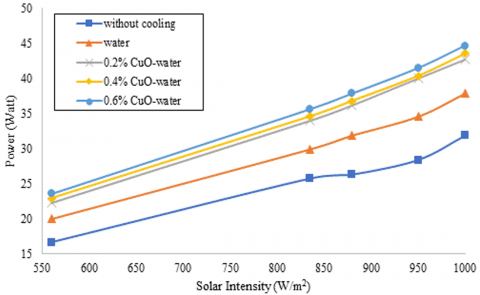
The output power of PV panels, known as maximum power point (PMPP), indicates the quantity of power they can generate based on energy production (measured in joules) over time (in seconds). To determine this output power, multiply the current (IMPP) by the optimal voltage (VMPP). The relationship between output power and solar radiation intensity is depicted in Figure 4.
Figure 4. A diagram depicting the relationship between solar radiation intensity and its effect on output power
Figure 4 demonstrates that as the intensity of solar radiation increases, the output power generated by the PV/T system also rises. For instance, when the solar radiation intensity ranges from 560 W/m² to 1000 W/m², the output power of the PV/T system using water as the working fluid grows from 19.96 W to 37.81 W.
For the PV/T system that incorporates a 0.2% volumetric concentration of CuO in water, the output power escalates from 22.24 W to 42.68 W. Likewise, the system with a 0.4% volumetric concentration of CuO in the water working fluid exhibits an increase in output power from 22.88 W to 43.54 W. Lastly, the PV/T system utilizing a 0.6% volumetric concentration of CuO in water witnesses its output power rise from 23.58 W to 44.61 W.
4.3 I-V and P-V curves
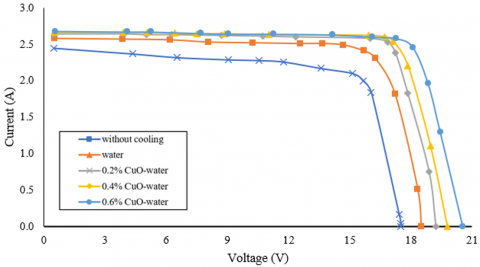
The graphs that depict the relationships among voltage, current, and power highlight the performance characteristics of the PV/T system. The research findings indicate that the peak efficiency is reached at an intensity of 1000 W/m². The relationships between voltage, current, and power can be found in Figures 5 and 6.
Figure 5 depicts the correlation between voltage and current when the solar radiation intensity is set at 1000 W/m². The optimal voltage values (VMPP) recorded for the PV/T system with water as the working fluid were: 15.69 V for a concentration of 0.2% volume CuO-water, 16.87 V for 0.4% volume CuO-water, 17.14 V for 0.6% volume CuO-water, and 17.29 V for the highest concentration. Correspondingly, these water working fluids' optimal current values (IMPP) were 2.41 A for 0.2% volume CuO-water, 2.53 A for 0.4% volume CuO-water, 2.54 A for 0.6% volume CuO-water, and 2.58 A for the highest concentration.
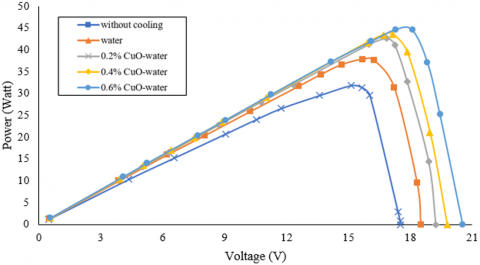
Figure 6 depicts how voltage correlates with the output power of the PV panel under solar radiation intensity of 1000 W/m². The maximum output power (PMPP) of the PV/T system is acquired by utilizing the ideal values of voltage and current. The PMPP values for the PV/T system using water as the working fluid, along with varying concentrations of CuO-water (0.2% vol., 0.4% vol., and 0.6% vol.), are measured at 37.81 W, 42.68 W, 43.54 W, and 44.61 W, respectively.
These findings suggest that decreasing the working temperature of the PV panel enhances the voltage output, resulting in increased power generation. Moreover, the area beneath the curve also expands. This validates that the temperature of the PV panel has an inverse relationship with the voltage, current, and power it generates.
Figure 5. I-V characteristic graph at radiation intensity of 1000 W/m2
Figure 6. The P-V characteristic graph is plotted for a radiation intensity of 1000 W/m²
4.4 Efficiency of panel
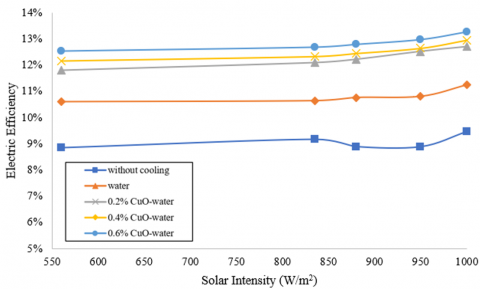
4.4.1 Electrical efficiency
The electrical efficiency of a PV panel is calculated by comparing the maximum output power (PMPP) to the power of radiation that the panel receives (Plight). This ratio is multiplied by 100% to express the efficiency as a percentage, as illustrated in Eq. (7). In Figure 7, a graph depicts the correlation between the intensity of solar radiation and the electrical efficiency of PV panels. Typically, as the intensity of solar radiation rises, the electrical efficiency also improves. At a peak intensity of 1000 W/m², the efficiencies of the PV/T system utilizing varying concentrations of CuO in water as the working fluid—specifically, 0.2% vol., 0.4% vol., and 0.6% vol.—are recorded as 11.25%, 12.7%, 12.95%, and 13.27%, respectively.
Figure 7. The relationship between solar radiation intensity and efficiency
The findings demonstrate that adding CuO-water nanofluid can effectively decrease the operating temperature of PV panels while improving their efficiency. This improvement arises from the enhanced thermophysical characteristics of the working fluid, resulting in more effective cooling of the PV panels. This conclusion is consistent with earlier studies, which indicate that the efficiency of PV panels generally drops by 0.05% for each degree Celsius increase in temperature, corresponding to a 0.5% decline in power output.
While a lower temperature for PV panels generally leads to better electrical performance, the magnitude of this improvement varies between thermal and electrical efficiencies due to their differing responses to cooling methods. When compared to the significant increases in thermal efficiency, the limited enhancement in electrical efficiency can be attributed to the non-linear relationship between PV cell temperature and its electrical output. Although thermal efficiency is markedly improved through better heat dissipation, electrical efficiency tends to stabilize since it is primarily influenced by the temperature sensitivity of the semiconductor material's bandgap, which experiences diminishing returns once it surpasses certain cooling thresholds.
4.4.2 Thermal efficiency
Introducing nanoparticles into a base fluid at a designated concentration enhances its thermal characteristics and optimizes convective heat transfer. In a PV/T system, the heat transfer rate of the working fluid serves as a crucial measure of the system's thermal efficiency.
The addition of nanofluids impacts various thermal attributes, such as mass flow rate (ṁ), thermal conductivity (k), and specific heat (cp). With an increase in nanoparticle concentration, there is a corresponding rise in both the mass flow rate (ṁ) and thermal conductivity (k), whereas the specific heat (cp) experiences a decline. A reduced cp value minimizes the residual heat in the working fluid across multiple cooling cycles, thereby enhancing the effectiveness of the cooling process.
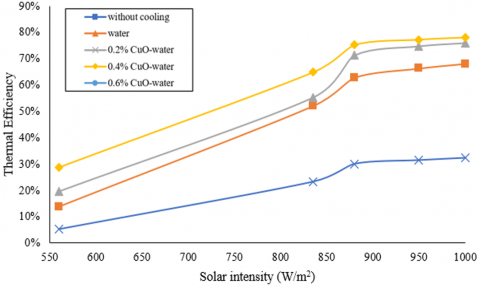
These alterations are essential in improving the system's overall thermal performance. Figure 8 depicts this trend, illustrating that thermal efficiency rises with increasing solar radiation intensity at various nanofluid concentrations. The figure highlights a significant enhancement in thermal efficiency for CuO-air nanofluids compared to air, with the 0.6% volume concentration of CuO-air delivering the highest performance.
Figure 8. The influence of solar radiation intensity on the thermal efficiency of photovoltaic panels
Table 6. Heat transfer characteristics of PV/T systems
|
Working Fluid |
Hc (W/m2. K) |
Qu (W) |
|
Water |
59.60 |
114.78 |
|
CuO-water 0.2% |
205.35 |
241.98 |
|
CuO-water 0.4% |
274.18 |
268.97 |
|
CuO-water 0.6% |
284.79 |
278.54 |
Additionally, a detailed analysis of flow characteristics and heat transfer behavior within the PV/T system can be accessed in Table 6, which is derived from computations using Eqs. (7)-(12).
Thermal efficiency indicates how effectively a system can transform heat energy into sound energy output. It can also be interpreted as the ratio between the heat generated by a PV/T system and the heat it receives. In water-based working fluids for PV/T systems, the thermal efficiency at a radiation intensity of 1000 W/m² for different concentrations of CuO is as follows: 32.32% for 0.2% volume CuO in water, 68.18% for 0.4% volume CuO in water, 76.08% for 0.6% volume CuO in water, and 78.11% for CuO in air. Figure 8 illustrates this study's thermal efficiencies obtained from the PV/T system. The enhancement in heat transfer capacity can be utilized in various pre-heating applications. This is based on previous research by Tiwari et al. [17] and Lee et al. [40], which shows that the system's thermal efficiency will increase with increasing nanoparticle concentration.
However, while higher concentrations of nanofluids improve thermal performance, they also introduce critical limitations. While this study tested concentrations up to 0.6% vol., increasing nanoparticle loading beyond this level may lead to excessive viscosity, which raises pumping power requirements, increases the risk of sedimentation, and reduces system reliability. Prior research has indicated that thermal efficiency gains tend to plateau around 1% vol., beyond which the benefits diminish and issues related to stability, operational cost, and maintenance become increasingly prohibitive for practical PV/T applications.
With these constraints in mind, the performance achieved in this study becomes even more notable compared to similar experimental investigations. Our thermal efficiency of 78.11% at 0.6% vol. CuO exceeds the ≈70% reported by Tiwari et al. [17] under 0.4% CuO and comparable irradiance, indicating a clear benefit from the fin-induced turbulence in our design. Likewise, Shasavar et al. [19] achieved thermal efficiencies around 72% using magnetite nanofluids in finned collectors, underscoring the effectiveness of combining nanoparticle-enhanced fluids with internal fins. Arifin et al. [11] demonstrated a 12.22% increase in electrical efficiency with TiO₂ nanofluids in a non-finned PV/T setup. In contrast, our configuration reaches 13.27% electrical efficiency, highlighting the added advantage of CuO nanoparticles and fin integration. Bahaidarah et al. [13] reported a 9% electrical efficiency gain and a 20% temperature reduction using back surface water cooling. Yet, our system achieves nearly double that temperature drop and significantly higher thermal performance. Although Lee et al. [40] showed electrical efficiency improvements up to 13% with Al₂O₃ nanofluids, our 13.27% with CuO-water at 0.6% vol. slightly surpasses it, suggesting that CuO-based nanofluids in fin-enhanced channels can deliver comparable or superior overall performance.
Incorporating CuO-water nanofluid as a working fluid in PV/T systems has dramatically improved their performance. Research shows that a volumetric concentration of 0.6% CuO nanoparticles lowers the operating temperature of photovoltaic panels by roughly 18.97℃. This temperature drop directly increases the electrical efficiency by 2.02 percentage points, elevating it from 11.25% to 13.27%, about an 18% relative enhancement. Furthermore, the system achieves a thermal efficiency of 78.11% when exposed to solar irradiance of 1000 W/m².
The primary reasons for these enhancements lie in the improved thermophysical characteristics of the nanofluid, which include enhanced thermal conductivity and better heat transfer properties, leading to more efficient cooling of the PV modules. This research emphasizes the promise of nanofluid technology as an effective and practical approach for thermal management within PV/T systems. The findings confirm the benefits of CuO-water nanofluids and provide a solid foundation for future investigations focused on optimizing nanofluid formulations and system designs to improve further the efficiency and reliability of photovoltaic energy conversion technologies.
This paper presents the findings of a research project titled "Optimization of Renewable Energy Efficiency for Sustainable Energy Production," which is funded by Sebelas Maret University under the Penguatan Kapasitas Grup Riset (pkg-uns) A scheme, with contract number 371/UN27.22/PT.01.03/2025.
|
P |
power, w |
|
V |
voltage, v |
|
I |
current, a |
|
FF |
fill factor |
|
I0 |
saturation current diode, a |
|
e |
Euler's number |
|
kB |
Boltzmann's constant, 1.381×10⁻²³ j.k-1 |
|
q |
electrical charge, 1.602×10⁻¹⁹c |
|
T |
temperature, k |
|
Im |
current at pmax, a |
|
Vm |
voltage at pmax, v |
|
Pmax |
rated maximum power, w |
|
G |
solar radiation, w.m-2 |
|
Am |
PV panel surface area, m2 |
|
Pout |
power generated, w |
|
$Q_u$ |
fluid heat flow rate, w |
|
$\dot{m}$ |
mass flow rate, kg.s-1 |
|
$C_p$ |
specific heat, j.kg-1.k-1 |
|
$\dot{V}$ |
volume flow rate, m3.s-1 |
|
K |
thermal conductivity, w.m-1.k-1 |
|
P |
power, w |
|
Greek symbols |
|
|
$\eta$ |
efficiency, % |
|
$\rho$ |
density, kg.m-1 |
|
$\emptyset$ |
concentration, % |
|
µ |
dynamic viscosity, kg.m-1.s-1 |
|
Subscripts |
|
|
np |
nanoparticle |
|
bf |
base fluid |
|
nf |
nanofluid |
|
sc |
short current |
|
oc |
open circuit |
|
ph |
photogeneration |
|
out |
outlet |
|
in |
inlet |
[1] Prasetyo, S.D., Prabowo, A.R., Arifin, Z. (2023). The use of a hybrid photovoltaic/thermal (PV/T) collector system as a sustainable energy-harvest instrument in urban technology. Heliyon, 9(2). https://doi.org/10.1016/j.heliyon.2023.e13390
[2] Khan, M.U., Hassan, M., Nawaz, M.H., Ali, M., Wazir, R. (2018). Techno-economic analysis of PV/wind/biomass/biogas hybrid system for remote area electrification of Southern Punjab (Multan), Pakistan using HOMER Pro. In 2018 International Conference on Power Generation Systems and Renewable Energy Technologies (PGSRET), Islamabad, Pakistan, pp. 1-6. https://doi.org/10.1109/PGSRET.2018.8686032
[3] Hardianto, H. (2019). Utilization of solar power plant in Indonesia: A review. International Journal of Environment, Engineering and Education, 1(3): 1-8. https://doi.org/10.55151/ijeedu.v1i3.21
[4] Ramdani, H., Ould-Lahoucine, C. (2020). Study on the overall energy and exergy performances of a novel water-based hybrid photovoltaic-thermal solar collector. Energy Conversion and Management, 222: 113238. https://doi.org/10.1016/j.enconman.2020.113238
[5] Asrori, A., Yudiyanto, E. (2019). Kajian karakteristik temperatur permukaan panel terhadap performansi instalasi panel surya tipe mono dan polikristal. FLYWHEEL: Jurnal Teknik Mesin Untirta, 1(1): 68-73. https://dx.doi.org/10.36055/fwl.v1i1.7134
[6] Gad, R., Mahmoud, H., Ookawara, S., Hassan, H. (2022). Energy, exergy, and economic assessment of thermal regulation of PV panel using hybrid heat pipe-phase change material cooling system. Journal of Cleaner Production, 364: 132489. https://doi.org/10.1016/j.jclepro.2022.132489
[7] Zubeer, S.A., Ali, O.M. (2022). Experimental and numerical study of low concentration and water-cooling effect on PV module performance. Case Studies in Thermal Engineering, 34: 102007. https://doi.org/10.1016/j.csite.2022.102007
[8] Ul Abdin, Z., Rachid, A. (2021). A survey on applications of hybrid PV/T panels. Energies, 14(4): 1205. https://doi.org/10.3390/en14041205
[9] Diniz, F.L., Vital, C.V., Gómez-Malagón, L.A. (2022). Parametric analysis of energy and exergy efficiencies of a hybrid PV/T system containing metallic nanofluids. Renewable Energy, 186: 51-65. https://doi.org/10.1016/j.renene.2021.12.151
[10] Hossain, F., Karim, M.R., Bhuiyan, A.A. (2022). A review on recent advancements of the usage of nano fluid in hybrid photovoltaic/thermal (PV/T) solar systems. Renewable Energy, 188: 114-131. https://doi.org/10.1016/j.renene.2022.01.116
[11] Arifin, Z., Prasetyo, S.D., Tjahjana, D.D.D.P., Rachmanto, R.A., Prabowo, A.R., Alfaiz, N.F. (2022). The application of TiO2 nanofluids in photovoltaic thermal collector systems. Energy Reports, 8: 1371-1380. https://doi.org/10.1016/j.egyr.2022.08.070
[12] Siecker, J., Kusakana, K., Numbi, E.B. (2017). A review of solar photovoltaic systems cooling technologies. Renewable and Sustainable Energy Reviews, 79: 192-203. https://doi.org/10.1016/j.rser.2017.05.053
[13] Bahaidarah, H., Subhan, A., Gandhidasan, P., Rehman, S. (2013). Performance evaluation of a PV (photovoltaic) module by back surface water cooling for hot climatic conditions. Energy, 59: 445-453. https://doi.org/10.1016/j.energy.2013.07.050
[14] Moradi, A., Zareh, M., Afrand, M., Khayat, M. (2020). Effects of temperature and volume concentration on thermal conductivity of TiO2-MWCNTs (70-30)/EG-water hybrid nano-fluid. Powder Technology, 362: 578-585. https://doi.org/10.1016/j.powtec.2019.10.008
[15] Maadi, S.R., Kolahan, A., Passandideh-Fard, M., Sardarabadi, M., Moloudi, R. (2017). Characterization of PVT systems equipped with nanofluids-based collector from entropy generation. Energy Conversion and Management, 150: 515-531. https://doi.org/10.1016/j.enconman.2017.08.039
[16] Huang, W., Marefati, M. (2020). Energy, exergy, environmental and economic comparison of various solar thermal systems using water and Thermia Oil B base fluids, and CuO and Al2O3 nanofluids. Energy Reports, 6: 2919-2947. https://doi.org/10.1016/j.egyr.2020.10.021
[17] Tiwari, A.K., Chatterjee, K., Deolia, V.K. (2023). Application of copper oxide nanofluid and phase change material on the performance of hybrid photovoltaic–thermal (PVT) system. Processes, 11(6): 1602. https://doi.org/10.3390/pr11061602
[18] Yazdanifard, F., Ameri, M., Ebrahimnia-Bajestan, E. (2017). Performance of nanofluid-based photovoltaic/thermal systems: A review. Renewable and Sustainable Energy Reviews, 76: 323-352. https://doi.org/10.1016/j.rser.2017.03.025
[19] Shahsavar, A., Jha, P., Arici, M., Kefayati, G. (2021). A comparative experimental investigation of energetic and exergetic performances of water/magnetite nanofluid-based photovoltaic/thermal system equipped with finned and unfinned collectors. Energy, 220: 119714. https://doi.org/10.1016/j.energy.2020.119714
[20] Daliran, A., Ajabshirchi, Y. (2018). Theoretical and experimental research on effect of fins attachment on operating parameters and thermal efficiency of solar air collector. Information Processing in Agriculture, 5(4): 411-421. https://doi.org/10.1016/j.inpa.2018.07.004
[21] Khan, K.F.A., Alam, Z., Yahya, S.M. (2021). Experimental investigation of potentiality of nanofluids in enhancing the performance of hybrid PVT system. Journal of University of Shanghai for Science and Technology, 23(5): 77-89. https://doi.org/10.51201/jusst/21/04252
[22] Jose, J.P.A., Shrivastava, A., Soni, P.K., Hemalatha, N., Alshahrani, S., Saleel, C.A., Alarifi, I.M. (2023). An analysis of the effects of nanofluid‐based serpentine tube cooling enhancement in solar photovoltaic cells for green cities. Journal of Nanomaterials, 2023(1): 3456536. https://doi.org/10.1155/2023/3456536
[23] Jidhesh, P., Arjunan, T.V., Gunasekar, N. (2021). Thermal modeling and experimental validation of semitransparent photovoltaic-thermal hybrid collector using CuO nanofluid. Journal of Cleaner Production, 316: 128360. https://doi.org/10.1016/j.jclepro.2021.128360
[24] Alhamayani, A. (2023). CNN-LSTM to predict and investigate the performance of a thermal/photovoltaic system cooled by nanofluid (Al2O3) in a hot-climate location. Processes, 11(9): 2731. https://doi.org/10.3390/pr11092731
[25] Sharaby, M.R., Younes, M., Baz, F., Abou-Taleb, F. (2024). State-of-the-art review: Nanofluids for photovoltaic thermal systems. Journal of Contemporary Technology and Applied Engineering, 3(1): 11-24.
[26] Allehiany, F.M., Memon, A.A., Memon, M.A., Fenta, A. (2023). Maximizing electrical output and reducing heat-related losses in photovoltaic thermal systems with a thorough examination of flow channel integration and nanofluid cooling. Scientific Reports, 13(1): 16961. https://doi.org/10.1038/s41598-023-44272-7
[27] Abdo, S., Saidani-Scott, H., Abdelrahman, M.A. (2021). Numerical study with eco-exergy analysis and sustainability assessment for a stand-alone nanofluid PV/T. Thermal Science and Engineering Progress, 24: 100931. https://doi.org/10.1016/j.tsep.2021.100931
[28] Sopian, K., Al‐Waeli, A.H., Kazem, H.A. (2021). Nano enhanced fluids and latent heat storage material for photovoltaic modules: A case study and parametric analysis. International Journal of Energy Research, 45(9): 12944-12967. https://doi.org/10.1002/er.6625
[29] Singh, M., Solanki, S.C., Agrawal, B., Bhargava, R. (2024). Numerical evaluation and artificial neural network (ANN) model of the photovoltaic thermal (PVT) system with different nanofluids. International Journal of Photoenergy, 2024(1): 6649100. https://doi.org/10.1155/2024/6649100
[30] Faizal, M., Saidur, R., Mekhilef, S., Alim, M.A. (2013). Energy, economic and environmental analysis of metal oxides nanofluid for flat-plate solar collector. Energy Conversion and Management, 76: 162-168. https://doi.org/10.1016/j.enconman.2013.07.038
[31] Ibrahim, A., Othman, M.Y., Ruslan, M.H., Alghoul, M., Yahya, M., Zaharim, A., Sopian, K. (2009). Performance of photovoltaic thermal collector (PVT) with different absorbers design. Wseas Transactions on Environment and Development, 5(3): 321-330.
[32] Kristiawan, B., Rifa'i, A.I., Enoki, K., Wijayanta, A.T., Miyazaki, T. (2020). Enhancing the thermal performance of TiO2/water nanofluids flowing in a helical microfin tube. Powder Technology, 376: 254-262. https://doi.org/10.1016/j.powtec.2020.08.020
[33] Zawrah, M.F., Khattab, R.M., Girgis, L.G., El Daidamony, H., Aziz, R.E.A. (2016). Stability and electrical conductivity of water-base Al2O3 nanofluids for different applications. HBRC Journal, 12(3): 227-234. https://doi.org/10.1016/j.hbrcj.2014.12.001
[34] Cengel, Y.A. (2002). Heat Transfer: A Practical Approach. McGraw Hill.
[35] Faizal, M., Saidur, R., Mekhilef, S., Alim, M.A. (2013). Energy, economic and environmental analysis of metal oxides nanofluid for flat-plate solar collector. Energy Conversion and Management, 76: 162-168. https://doi.org/10.1016/j.enconman.2013.07.038
[36] Hasan, I.A. (2018). Enhancement the performance of PV panel by using fins as heat sink. Engineering and Technology Journal, 36(7A): 798-805. http://doiorg/10.30684/eti.36.7A.13
[37] Rahman, M.M., Hasanuzzaman, M., Rahim, N.A. (2015). Effects of various parameters on PV-module power and efficiency. Energy Conversion and Management, 103: 348-358. https://doi.org/10.1016/j.enconman.2015.06.067
[38] Al-Ghezi, M.K., Abass, K.I., Salam, A.Q., Jawad, R.S., Kazem, H.A. (2021). The possibilities of using nano-CuO as coolants for PVT system: An experimental study. Journal of Physics: Conference Series, 1973(1): 012123. https://doi.org/10.1088/1742-6596/1973/1/012123
[39] Assaffat, L., Maulidin, M.S., Trisnoaji, Y., Prasetyo, S.D., Rizkita, M.A., Arifin, Z., Choifin, M. (2025). Improving grid stability with hybrid renewable energy and green hydrogen storage: A study of Karimunjawa Island. Mathematical Modelling of Engineering Problems, 12(5): 1524-1534. https://doi.org/10.18280/mmep.120506
[40] Lee, J.H., Hwang, S.G., Lee, G.H. (2019). Efficiency improvement of a photovoltaic thermal (PVT) system using nanofluids. Energies, 12(16): 3063. https://doi.org/10.3390/en12163063