Samsu Somadayo*![]() | Mohamad Jamil
| Mohamad Jamil![]()
© 2025 The authors. This article is published by IIETA and is licensed under the CC BY 4.0 license (http://creativecommons.org/licenses/by/4.0/).
OPEN ACCESS
This research evaluates the factors affecting the successful implementation of Virtual Reality (VR) technology in developing reading literacy in elementary schools. This research model examines the relationship between Perceived Ease of Use (PEOU), Perceived Usefulness (PU), Attitude Toward Use (ATU), Behavioral Intention to Use (BIU), Actual System Use (ASU), and Actual Learning Outcome (ALO). The information was gathered via a survey that included students and teachers as users of the VR system in literacy education. The analysis findings indicate that PEOU has a strong and positive correlation with PU, eventually affecting ATU towards VR technology. This positive ATU increases BIU, which encourages ASU. Furthermore, active utilization of VR is proven to improve student ALO, especially in reading literacy skills. These findings confirm that PEOU, PU, and positive ATU are essential in successfully integrating VR technology into basic education. Thus, VR technology can potentially be an effective, innovative learning medium to improve reading literacy among elementary school students.
Virtual Reality, online learning, reading literacy, elementary school, educational technology
Integrating innovative educational tools is increasingly essential in an era of rapid technological advancement. One such technology is Virtual Reality (VR), which has the ability to change the way we approach education and instruction [1, 2]. This technology provides immersive experiences that can captivate students in ways that conventional teaching methods are unable to. For elementary schools, particularly in the development of reading literacy, VR-based learning systems offer promising solutions to improve engagement, comprehension, and retention [3, 4]. Reading literacy is a fundamental skill that children should master early on, as it is the foundation for future academic success [5]. The advent of online learning systems, particularly those that integrate VR, offers a chance to design vibrant, interactive, and highly captivating learning experiences that can aid in developing this skill [6, 7].
VR-based learning systems in elementary schools usually consist of several key components that support the teaching-learning process. An immersive reading environment is one of the key features where students can interact with characters, objects, and elements from stories or reading materials in a virtual space [8, 9]. This helps improve comprehension by providing visual and auditory cues reinforcing the reading content.
The benefits of VR-based learning systems in reading literacy development are significant. First, VR can increase students' engagement and motivation by creating a more fun and interactive experience. In contrast to traditional learning methods, students read the text and actively participate in the story, making them more engaged [10, 11]. The VR system also allows for personalized learning, where materials can be tailored to students' ability levels so that each individual can learn at their own pace. The multisensory approach that VR offers, which combines visual, auditory, and kinesthetic, also strengthens students' cognitive ability to understand texts [12, 13]. In addition, VR supports diverse learning styles, accommodating students who prefer to learn in different ways [14].
However, despite the potential benefits, implementing VR-based learning systems in primary schools also encounters several difficulties. One of the main obstacles is the cost of devices and maintenance, as VR requires specialized hardware, such as VR headsets and computers, that support the technology [15, 16]. In addition, teacher training is necessary to use VR systems effectively in the classroom. Teachers may struggle to operate the technology and integrate it into lesson plans without adequate training. There are also concerns regarding the time students spend using VR devices for long periods, which could affect eye health and posture.
Some previous studies, including Silva et al. [17] in their research, investigated the influence of Augmented Reality (AR) application usage on students' academic performance, motivation, and acceptance of technology in chemistry education. Measurement results using the Technology Acceptance Model (TAM). The average TAM score after the experimental process is 5.4, with a standard deviation (SD) of 1.33, indicating that students accept AR technology in learning.
Wong et al. [18] assessed the impact of VR on enhancing students' comprehension of engineering principles in higher education. Using modified TROFLEI, the analysis showed that VARTeL significantly enhanced students' understanding, with a 24.8% improvement in the post-test relative to the pre-test.
Various assessment techniques can be employed to measure the impact of VR-based learning systems on developing reading literacy. One of them is to monitor the improvement of students' performance in reading comprehension, fluency, vocabulary, and retention through interactive quizzes and challenges in the VR system. In addition, surveys and feedback from students and teachers are also crucial to evaluate the extent of engagement and perceived learning results. Observation of students' behavior during VR sessions can give an idea of their enthusiasm and level of collaboration. Longitudinal studies that track students' progress over the long term can also provide deeper insights into the benefits of VR on reading literacy development.
Based on this, the purpose of this study is to bridge the current gap by evaluating the effect of VR-based learning systems on enhancing the reading literacy of elementary school students and measuring technology acceptance and factors that affect its use using the TAM. The hypothesis will test the relationship between Perceived Ease of Use (PEOU), Perceived Usefulness (PU), Attitude Toward Use (ATU), Behavioral Intention to Use (BIU), Actual System Use (ASU), and Actual Learning Outcome (ALO) to explore the elements that play a role in the effective application of VR in reading literacy education in elementary schools.
Research into the application of VR technology in education have expanded significantly in recent years. This technology is believed to increase student engagement in learning and provide a more immersive and interactive learning experience. Several previous studies have explored various aspects of VR's effectiveness in improving learning outcomes, particularly reading literacy and material comprehension.
2.1 VR in education
The research by Radianti et al. [19] demonstrates that VR holds significant promise in education because of its capacity to foster a more interactive and captivating learning atmosphere. VR-based learning can improve conceptual understanding and assist students in cultivating critical thinking abilities [20]. In addition, research conducted by Merchant et al. [21] found that students who learn using immersive technologies like VR and AR showed increased learning motivation compared to traditional learning methods.
2.2 Using VR in reading literacy
Several studies have examined the impact of VR on reading literacy. For example, research by Huang et al. [22] revealed that VR can help improve reading comprehension by creating a more interactive reading experience. In this study, students who used VR apps to read stories showed improvements in text comprehension compared to a control group using conventional book.
2.3 Evaluating technology acceptance in learning
Various studies have used the TAM to examine how users adopt and utilize technology in education. Davis et al. [23] developed TAM to evaluate factors that affect technology adoption, including PEOU and PU. Some more recent studies, such as the one conducted by Al-Adwan et al. [24], found that factors in TAM can explain user intention to adopt digital-based learning technologies, including VR. In the context of VR for education, research by Radu [25] showed that interactive experiences in VR increase the perceived value of the technology and motivate students to incorporate it.
This research employs a quantitative approach with a survey technique to assess the adoption of a VR-based online learning system in improving reading literacy in elementary schools. Partial Least Squares (PLS) was utilized to examine the connection across variables in the adapted TAM.
The sample in this research consists of 201 elementary school students who have used the VR system in reading learning. The sampling approach was implemented using purposive sampling, selecting students based on specific criteria who have attended at least four reading learning sessions using VR. In addition, teachers who are involved in the VR-based learning process are also among the respondents. The determination of the use of a sample of 200 respondents is a commonly used sample size and is considered an adequate size in PLS-SEM [26, 27].
The data collection tool employed is a survey with a 5-point Likert scale, which includes six main variables, namely PEOU, PU, ATU, BIU, ASU, and ALO. These variables reflect students' perceptions of the ease and benefits of using VR in learning to read, their attitudes toward the technology, their intention to continue using it, and its impact on learning outcomes. In addition to questionnaires, this study also uses observation methods to see how students interact with VR in reading learning and reading literacy tests to measure changes in student comprehension after using the VR system.
Data analysis was conducted in multiple steps, beginning with validity and reliability tests to confirm that the research instruments adhere to proper measurement standards. Confirmatory Factor Analysis (CFA) was employed to assess construct validity, while reliability was evaluated using Cronbach's Alpha, with values above 0.7 considered to indicate good consistency. Furthermore, Structural Equation Modeling (SEM) analysis was conducted using SmartPLS software to test the relationship between variables in the TAM model.
Table 1 presents the variables utilized in this research and the hypotheses that will be examined using the Structural Equation Modeling (SEM-PLS) approach.
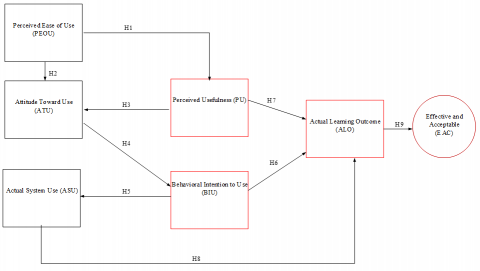
Based on Table 1, the hypotheses tested in this study include six main relationships in the TAM model. First, PEOU is anticipated to positively influence PU (H1), suggesting that the simpler the VR system is to operate, the greater the perceived benefits by students. Second, PEOU is also expected to positively impact ATU (H2), this suggests that the simpler the system is to use, the more positive the students' attitude toward VR becomes. The third hypothesis (H3) proposes that PU positively affects ATU, indicating that if students find VR beneficial, they will adopt a more positive attitude toward using it. Fourth, ATU is predicted to have a positive effect on BIU (H4), meaning that a favorable attitude toward VR will boost students' intention to continue using it. The fifth hypothesis (H5) posits that BIU has a positive impact on ASU, implying that the stronger the students' intention to use VR, the more frequently they will use it in their learning activities. The sixth hypothesis (H6) suggests that ALO positively affects ASU, meaning that the more frequently VR is used in reading instruction, the greater its impact on enhancing students' reading literacy. The seventh hypothesis (H7) states that PU will positively influence ALO, indicating that the higher the perceived usefulness of a VR-based learning system (PU), the better the learning outcomes achieved by students (ALO). The eighth hypothesis (H8) proposes that ASU will positively affect ALO, meaning that more frequent or intensive use of VR systems in learning (ASU) will lead to improved learning outcomes (ALO). Lastly, the ninth hypothesis (H9) suggests that ALO positively impacts EAC, implying that better learning outcomes (ALO) will result in an increased level of effectiveness and acceptance of VR systems in education. Figure 1 shows the hypothesis design model of VR-based online learning system evaluation.
Table 1. Variables and hypotheses
|
Independent Variables |
Dependent Variables |
Hypothesis |
Explanation |
|
Perceived Ease of Use (PEOU) |
Perceived Usefulness (PU) |
H1 |
The simplicity of using the VR system will increase students' perception of its usefulness in learning to read. |
|
Perceived Ease of Use (PEOU) |
Attitude Toward Use (ATU) |
H2 |
The simpler the VR system is to operate, the more favorable the student's attitude toward its usage. |
|
Perceived Usefulness (PU) |
Attitude Toward Use (ATU) |
H3 |
If students find VR useful in learning, they will develop a more favorable attitude toward using it. |
|
Attitude Toward Use (ATU) |
Behavioral Intention to Use (BIU) |
H4 |
Students' positive attitude towards VR will increase their intention to continue using it in learning. |
|
Behavioral Intention to Use (BIU) |
Actual System Use (ASU) |
H5 |
The higher the students' intention to use VR, the more often they use it in learning. |
|
Actual System Use (ASU) |
Actual Learning Outcome (ALO) |
H6 |
More frequent use of the VR system will improve students' reading literacy. |
|
Perceived Usefulness (PU) |
Actual Learning Outcome (ALO) |
H7 |
The higher the perceived usefulness of a VR-based learning system (PU), the better the real learning outcomes students achieve. |
|
Actual System Use (ASU) |
Actual Learning Outcome (ALO) |
H8 |
The more frequently or intensively students use the VR system, the better their learning outcomes. |
|
Actual Learning Outcome (ALO) |
Effective and Acceptable (EAC) |
H9 |
The better the learning outcomes students achieve, the higher the effectiveness and acceptance of the VR system in learning. |
Figure 1. Hypothesized model of VR-based online learning system evaluation
Theoretically, this model provides an important contribution to the development of TAM in the context of educational technology. By adding the constructs of ALO and EAC, this model not only examines the factors that influence the intention and use of technology, but also directly links them to actual learning outcomes and post-use evaluative perceptions. The addition of ALO broadens the scope of TAM from a behavioral orientation to an outcome-based approach, where the success of technology is not only measured by how often it is used, but by its impact on student learning outcomes. Meanwhile, EAC introduces a feedback dimension, where good learning outcomes will improve students' perceptions of the effectiveness and feasibility of the technology. Thus, this model presents a new perspective that is more holistic and outcome-oriented, and strengthens the relevance of TAM in explaining the adoption and sustainability of technology use in educational settings.
4.1 Outer model test
The outer model evaluation in PLS is employed to assess the connection between indicators and latent constructs in the research framework. The primary purpose of this test is to ensure that the indicators used can represent the constructs measured validly and reliably before proceeding to the analysis of the relationship between constructs in the Structural Model Assessment. The tests for evaluating the outer model of reflective indicators include Convergent Validity, Average Variance Extracted (AVE), Discriminant Validity, Reliability (Composite reliability), and Cronbach's Alpha. The results of the outer model evaluation are presented in Table 2.
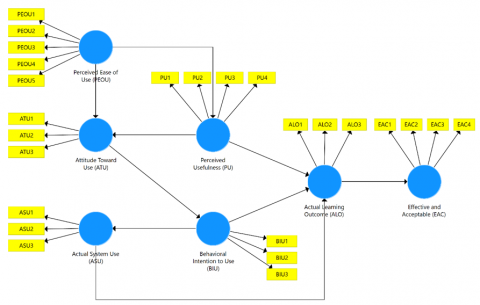
Table 2 displays the outcomes of the outer model evaluation in PLS, utilized to assess the validity and consistency of reflective indicators in the research framework. Each latent variable, such as PEOU, PU, ATU, BIU, ASU, ALO, and EAC, is measured using several indicators. Outer loading in the table shows the relationship between the indicator and the latent variable it measures. An outer loading value larger than 0.7 indicates that the indicator has a strong contribution in measuring its construct, and in this table, all indicators meet these criteria, so they are declared valid [28]. In addition, convergent validity is assessed using AVE, which evaluates the extent to which a latent variable explains the variance in its indicators. An AVE value greater than 0.5 indicates that the construct accounts for more than 50% of the variance in its indicators. According to the table, all latent variables have an AVE greater than 0.5, thus confirming that convergent validity is satisfied. With these results, it can be concluded that this study's measurement model or outer Model has met the validity and reliability criteria, so the analysis can proceed to the Inner Model Test stage to test the relationship between latent variables. Figure 2 illustrates the structural framework of the outer model.
Table 2. Results of the outer model measurement
|
Variable / Indicator |
Outer Loading |
AVE |
Information |
|
Perceived Ease of Use (PEOU) |
0.669 |
Valid |
|
|
PEOU1 |
0.820 |
Valid |
|
|
PEOU2 |
0.805 |
Valid |
|
|
PEOU3 |
0.859 |
Valid |
|
|
PEOU4 |
0.775 |
Valid |
|
|
PEOU5 |
0.828 |
Valid |
|
|
Perceived Usefulness (PU) |
0.718 |
Valid |
|
|
PU1 |
0.866 |
Valid |
|
|
PU2 |
0.845 |
Valid |
|
|
PU3 |
0.842 |
Valid |
|
|
PU4 |
0.837 |
Valid |
|
|
Attitude Toward Use (ATU) |
0.727 |
Valid |
|
|
ATU1 |
0.790 |
Valid |
|
|
ATU2 |
0.885 |
Valid |
|
|
ATU3 |
0.878 |
Valid |
|
|
Behavioral Intention to Use (BIU) |
0.755 |
Valid |
|
|
BIU1 |
0.869 |
Valid |
|
|
BIU2 |
0.875 |
Valid |
|
|
BIU3 |
0.863 |
Valid |
|
|
Actual System Use (ASU) |
0.780 |
Valid |
|
|
ASU1 |
0.853 |
Valid |
|
|
ASU2 |
0.913 |
Valid |
|
|
ASU3 |
0.883 |
Valid |
|
|
Actual Learning Outcome (ALO) |
0.798 |
Valid |
|
|
ALO1 |
0.906 |
Valid |
|
|
ALO2 |
0.899 |
Valid |
|
|
ALO3 |
0.874 |
Valid |
|
|
Effective and Acceptable (EAC) |
0.746 |
Valid |
|
|
EAC1 |
0.911 |
Valid |
|
|
EAC2 |
0.893 |
Valid |
|
|
EAC3 |
0.872 |
Valid |
|
|
EAC4 |
0.771 |
Valid |
Figure 2. Outer structural model
4.2 Inner model test
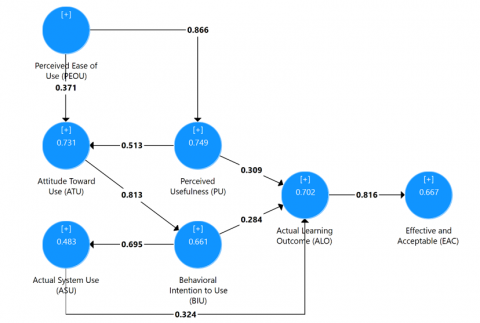
Figure 3 shows the structural model equation obtained after data analysis.
Figure 3. Post-data analysis structural model
The following structural model equation is based on the figure above:
PU = 0.866 PEOU + ei1; R2 = 0.749;
ATU = 0.371 PEOU + 0.513 PU + ei1; R2 = 0.731;
BIU = 0.813 ATU + ei1; R2 = 0.661;
ASU = 0.695 BIU + ei1; R2 = 0.483;
ALO = 0.309 PU + 0.284 BIU + 0.324 ASU + ei1;
R2 = 0.702;
EAC = 0.816 ALO + ei1;
R2 = 0.667.
The evaluation conducted for the inner model assessment involves the determination coefficient through R-square, predictive relevance via Q square, and the Goodness of Fit Index (GoF). The results of the coefficient of determination evaluation are shown in Table 3.
Table 3. Coefficient of determination results
|
Effect |
R-Square |
|
PEOU $\rightarrow$ PU |
0.749 |
|
PEOU, PU $\rightarrow$ ATU |
0.731 |
|
ATU $\rightarrow$ BIU |
0.661 |
|
BIU $\rightarrow$ ASU |
0.483 |
|
PU, BIU, ASU $\rightarrow$ ALO |
0.702 |
|
ALO $\rightarrow$ EAC |
0.667 |
An R-square value exceeding 0.5 suggests that the independent variable has a strong capacity to forecast the dependent variable [29]. The R-squared value derived from model 1, namely the effect of the PEOU variable on PU, is 0.749 or 74.9%. Model 2 is the effect of PEOU and PU on ATU of 0.731 or 73.1%. Model 3 is the effect of ATU on BIU of 0.661 or 66.1%. Model 4 is the effect of BIU on ASU of 0.483 or 48.3%. Model 5 is the effect of PU, BIU, and ASU on ALO of 0.702 or 70.2%. And in model 6, the effect of ALO on EAC is 0.667 or 66.7%.
Furthermore, Table 4 displays the results of the effect size, or the proportion of variance, between the exogenous and endogenous variables. The F-square coefficient classification includes a small category for F-square values fall within the range of 0.02 to 0.15 for a small effect, 0.15 to 0.35 for a medium effect, and values greater than 0.35 indicate a large effect.
Table 4. Effect size results
|
Exogen |
PU |
ATU |
BIU |
ASU |
ALO |
EAC |
|
Perceived Ease of Use (PEOU) |
2.991 (Large) |
0.128 (Small) |
|
|
|
|
|
Perceived Usefulness (PU) |
|
0.245 (Medium) |
|
|
0.084 (Small) |
|
|
Attitude Toward Use (ATU) |
|
|
1.954 (Large) |
|
|
|
|
Behavioral Intention to Use (BIU) |
|
|
|
0.935 (Large) |
0.080 (Small) |
|
|
Actual System Use (ASU) |
|
|
|
|
0.153 (Medium) |
|
|
Actual Learning Outcome (ALO) |
|
|
|
|
2.000 (Large) |
Table 5 presents the predictive relevance results with Q square. The outcomes of the Q-square computation are intended to forecast the model's quality.
Table 5. Q-Square results
|
Effect |
Q-Square |
|
PEOU $\rightarrow$ PU |
0.531 |
|
PEOU, PU $\rightarrow$ ATU |
0.522 |
|
ATU $\rightarrow$ BIU |
0.490 |
|
BIU $\rightarrow$ ASU |
0.368 |
|
PU, BIU, ASU $\rightarrow$ ALO |
0.547 |
|
ALO $\rightarrow$ EAC |
0.491 |
The Q-square value must exceed 0 (Q² > 0) to demonstrate that the model possesses predictive capability. Q-square values of 0.02, 0.15, and 0.35 correspond to low, medium, and high degrees of predictive relevance, respectively [30]. The Q-square value for model 1, which represents the effect of PEOU variables on PU variables, is 53.1%. Model 2, namely the effect of PEOU and PU variables on the ATU variable of 52.2%. Model 3, namely the effect of the ATU variable on the BIU variable of 49.0%. Model 4 is the effect of the BIU variable on the ASU variable by 36.8%. Model 5 shows the effect of PU, BIU, and ASU variables on the ALO variable by 54.7%, and in model 6, the effect of the ALO variable on EAC by 49.1%.
The GoF model assessment is performed to evaluate the model's overall accuracy by multiplying the mean coefficient of determination with the average communal value (AVE).
$\begin{gathered}G o F=\sum \sqrt{\overline{A V E} \times \overline{R^2}} \\ G o F=\sqrt{0.754 \times 0.663}=0.697\end{gathered}$ (1)
The GoF calculation yields a result of 0.697, indicating that the model's precision falls within the high category (> 0.36) [31].
4.3 Hypothesis test
Hypothesis testing is an evaluation of the coefficient or parameter that demonstrates the influence of one latent variable on another. The effect is considered significant when the p-value is less than 0.05, while it is considered insignificant if the p-value exceeds 0.05 [32]. Table 6 presents the outcomes of the t-statistics test for the direct effects of variables, and Table 7 displays the results of testing the indirect effects.
Table 6. Hypothesis testing results with t-statistics
|
Effect |
Path Coefficients |
t Statistics (p-value) |
|
Perceived Ease of Use (PEOU) $\rightarrow$ Perceived Usefulness (PU) |
0.866 |
33.265 (0.000)* |
|
Perceived Ease of Use (PEOU) $\rightarrow$ Attitude Toward Use (ATU) |
0.371 |
3.694 (0.000)* |
|
Perceived Usefulness (PU) $\rightarrow$ Attitude Toward Use (ATU) |
0.513 |
5.014 (0.000)* |
|
Attitude Toward Use (ATU) $\rightarrow$ Behavioral Intention to Use (BIU) |
0.813 |
23.454 (0.000)* |
|
Behavioral Intention to Use (BIU) $\rightarrow$ Actual System Use (ASU) |
0.695 |
14.058 (0.000)* |
|
Perceived Usefulness (PU) $\rightarrow$ Actual Learning Outcome (ALO) |
0.309 |
2.978 (0.003)* |
|
Behavioral Intention to Use (BIU) $\rightarrow$ Actual Learning Outcome (ALO) |
0.284 |
2.830 (0.005)* |
|
Actual System Use (ASU) $\rightarrow$ Actual Learning Outcome (ALO) |
0.324 |
4.413 (0.000)* |
|
Actual Learning Outcome (ALO) $\rightarrow$ Effective and Acceptable (EAC) |
0.816 |
24.023 (0.000)* |
*Significant (p<0.05)
Table 7. Hypothesis testing results of indirect effect with t-statistics
|
Effect |
Path Coefficients |
t Statistics (p-value) |
|
|
1 |
PEOU $\rightarrow$ PU $\rightarrow$ ATU |
0.444 |
4.976 (0.000)* |
|
2 |
PEOU $\rightarrow$ PU $\rightarrow$ ATU $\rightarrow$ BIU |
0.361 |
4.811 (0.000)* |
|
3 |
PEOU $\rightarrow$ PU $\rightarrow$ ATU $\rightarrow$ BIU $\rightarrow$ ASU |
0.251 |
4.400 (0.000)* |
|
4 |
PEOU $\rightarrow$ PU $\rightarrow$ ATU $\rightarrow$ BIU $\rightarrow$ ASU $\rightarrow$ ALO |
0.081 |
3.309 (0.001)* |
|
5 |
PEOU $\rightarrow$ PU $\rightarrow$ ATU $\rightarrow$ BIU $\rightarrow$ ASU $\rightarrow$ ALO $\rightarrow$ EAC |
0.066 |
3.192 (0.001)* |
|
6 |
PEOU $\rightarrow$ PU $\rightarrow$ ATU $\rightarrow$ BIU $\rightarrow$ ALO |
0.102 |
2.313 (0.021)* |
|
7 |
PEOU $\rightarrow$ PU $\rightarrow$ ATU $\rightarrow$ BIU $\rightarrow$ ALO $\rightarrow$ EAC |
0.084 |
2.245 (0.025)* |
|
8 |
PEOU $\rightarrow$ PU $\rightarrow$ ALO |
0.268 |
2.968 (0.003)* |
|
9 |
PEOU $\rightarrow$ PU $\rightarrow$ ALO $\rightarrow$ EAC |
0.219 |
2.910 (0.004)* |
|
10 |
PEOU $\rightarrow$ ATU $\rightarrow$ BIU |
0.302 |
3.559 (0.000)* |
|
11 |
PEOU $\rightarrow$ ATU $\rightarrow$ BIU $\rightarrow$ ASU |
0.210 |
3.245 (0.001)* |
|
12 |
PEOU $\rightarrow$ ATU $\rightarrow$ BIU $\rightarrow$ ASU $\rightarrow$ ALO |
0.068 |
2.352 (0.019)* |
|
13 |
PEOU $\rightarrow$ ATU $\rightarrow$ BIU $\rightarrow$ ASU $\rightarrow$ ALO $\rightarrow$ EAC |
0.056 |
2.311 (0.021)* |
|
14 |
PEOU $\rightarrow$ ATU $\rightarrow$ BIU $\rightarrow$ ALO |
0.086 |
2.257 (0.024)* |
|
15 |
PEOU $\rightarrow$ ATU $\rightarrow$ BIU $\rightarrow$ ALO $\rightarrow$ EAC |
0.070 |
2.211 (0.027)* |
|
16 |
PU $\rightarrow$ ATU $\rightarrow$ BIU |
0.417 |
4.914 (0.000)* |
|
17 |
PU $\rightarrow$ ATU $\rightarrow$ BIU $\rightarrow$ ALO |
0.118 |
2.337 (0.020)* |
|
18 |
PU $\rightarrow$ ATU $\rightarrow$ BIU $\rightarrow$ ALO $\rightarrow$ EAC |
0.097 |
2.274 (0.023)* |
|
19 |
PU $\rightarrow$ ATU $\rightarrow$ BIU $\rightarrow$ ASU |
0.290 |
4.551 (0.000)* |
|
20 |
PU $\rightarrow$ ATU $\rightarrow$ BIU $\rightarrow$ ASU $\rightarrow$ ALO |
0.094 |
3.416 (0.001)* |
|
21 |
PU $\rightarrow$ ATU $\rightarrow$ BIU $\rightarrow$ ASU $\rightarrow$ ALO $\rightarrow$ EAC |
0.077 |
3.304 (0.001)* |
|
22 |
PU $\rightarrow$ ALO $\rightarrow$ EAC |
0.252 |
2.932 (0.003)* |
|
23 |
ATU $\rightarrow$ BIU $\rightarrow$ ASU |
0.565 |
9.870 (0.000)* |
|
24 |
ATU $\rightarrow$ BIU $\rightarrow$ ASU $\rightarrow$ ALO |
0.183 |
4.026 (0.000)* |
|
25 |
ATU $\rightarrow$ BIU $\rightarrow$ ASU $\rightarrow$ ALO $\rightarrow$ EAC |
0.150 |
3.867 (0.000)* |
|
26 |
ATU $\rightarrow$ BIU $\rightarrow$ ALO |
0.231 |
2.784 (0.005)* |
|
27 |
ATU $\rightarrow$ BIU $\rightarrow$ ALO $\rightarrow$ EAC |
0.188 |
2.706 (0.007)* |
|
28 |
BIU $\rightarrow$ ASU $\rightarrow$ ALO |
0.225 |
4.204 (0.000)* |
|
29 |
BIU $\rightarrow$ ASU $\rightarrow$ ALO $\rightarrow$ EAC |
0.184 |
4.096 (0.000)* |
|
30 |
BIU $\rightarrow$ ALO $\rightarrow$ EAC |
0.232 |
2.779 (0.006)* |
|
31 |
ASU $\rightarrow$ ALO $\rightarrow$ EAC |
0.265 |
4.385 (0.000)* |
*Significant (p<0.05)
The test results presented in Table 6 reveal that all direct effects tested exhibit a positive and significant impact, as reflected by the t-statistics values exceeding the critical threshold (1.96).
The PEOU variable demonstrates a positive and significant influence on the PU variable, with t-statistics values greater than the critical value (33.265 > 1.96) and p-values below α (0.000 < 0.050). The positive coefficient suggests that an increase in Perceived Ease of Use can significantly enhance Perceived Usefulness.
The PEOU variable exerts a notable and meaningful influence on the ATU variable, with t-statistics values exceeding the critical value (3.694 > 1.96) and p-values below α (0.000 < 0.050). The positive coefficient indicates that increased PEOU can significantly increase ATU.
The PU variable has a notable and meaningful impact on the ATU variable, with t-statistics values exceeding the critical threshold (5.014 > 1.96), and p-values less than α (0.000 < 0.050). The positive coefficient suggests that higher Perceived Usefulness can substantially improve Attitude Toward Use.
The ATU variable demonstrates a substantial and noteworthy effect on the BIU variable, with t-statistics values surpassing the critical value (23.454 > 1.96) and p-values below α (0.000 < 0.050). The favorable coefficient suggests that an improved Attitude Toward Use can significantly increase Behavioral Intention to Use.
The BIU variable exerts a significant and beneficial impact on the ASU variable, with t-statistics values exceeding the critical value (14.058 > 1.96), and p-values smaller than α (0.000 < 0.050). The advantageous coefficient indicates that a stronger Behavioral Intention to Use can substantially enhance Actual System Use.
The PU variable has a meaningful and marked effect on the ALO variable, with t-statistics values surpassing the critical threshold (2.978 > 1.96) and p-values below α (0.003 < 0.050). The beneficial coefficient shows that a higher Perceived Usefulness can significantly improve Actual Learning Outcomes.
The BIU variable exerts a notable and significant influence on the ALO variable, with t-statistics values exceeding the critical value (2.830 > 1.96) and p-values lower than α (0.005 < 0.050). The favorable coefficient illustrates that increased Behavioral Intention to Use can meaningfully enhance Actual Learning Outcomes.
The ASU variable demonstrates a significant and positive effect on the ALO variable, with t-statistics values higher than the critical threshold (4.413 > 1.96) and p-values below α (0.000 < 0.050). The positive coefficient highlights that greater Actual System Use can lead to substantial improvements in Actual Learning Outcomes.
The ALO variable shows a significant and positive influence on the EAC variable, with t-statistics values exceeding the critical value (24.023 > 1.96) and p-values lower than α (0.000 < 0.050). The advantageous coefficient reveals that higher learning outcomes significantly enhance the system's effectiveness and acceptance.
The test results in Table 7 show that the PU variable mediates the effect of PEOU on ATU with a significant indirect effect (p-value 0.000, smaller than α 0.050). In addition, the PU and ATU variables mediate the effect of PEOU on BIU, with a significant indirect effect (p-value 0.000, smaller than α 0.050). Furthermore, PU, ATU, and BIU mediate the effect of PEOU on ASU with a significant indirect effect (p-value 0.000, smaller than α 0.050).
The PU, ATU, BIU, and ASU variables mediate the effect of PEOU on ALO, with a significant indirect effect (p-value 0.001, smaller than α 0.050). Meanwhile, PU, ATU, BIU, ASU, and ALO mediate the effect of PEOU on EAC with a significant indirect effect (p-value 0.001, smaller than α 0.050).
Furthermore, the variables PU, ATU, and BIU also mediate the effect of PEOU on ALO with a significant indirect effect (p-value 0.021, smaller than α 0.050). PU and ALO mediate the effect of PEOU on EAC with a significant indirect effect (p-value 0.004, smaller than α 0.050).
The variable ATU mediates the effect of PEOU on BIU with a significant indirect effect (p-value 0.000, smaller than α 0.050), and ATU and BIU mediate the effect of PEOU on ASU (p-value 0.001, smaller than α 0.050).
In addition, ATU, BIU, and ASU also mediate the effect of PEOU on ALO with a significant indirect effect (p-value 0.019, smaller than α 0.050), and ATU, BIU, ASU, and ALO mediate the effect of PEOU on EAC with a significant indirect effect (p-value 0.021, smaller than α 0.050).
The ATU and BIU variables also mediate the effect of PEOU on ALO (p-value 0.024, smaller than α 0.050), and ATU, BIU, and ALO mediate the effect of PEOU on EAC (p-value 0.027, smaller than α 0.050).
The ATU variable mediates the effect of PU on BIU with a significant indirect effect (p-value 0.000, smaller than α 0.050), and ATU and BIU mediate the effect of PU on ALO (p-value 0.020, smaller than α 0.050). ATU, BIU, and ALO mediate the effect of PU on EAC (p-value 0.023, smaller than α 0.050).
ATU and BIU also mediate the effect of PU on ASU with a significant indirect effect (p-value 0.000, smaller than α 0.050), while ATU, BIU, ASU, and ALO mediate the effect of PU on EAC with a significant indirect effect (p-value 0.001, smaller than α 0.050).
Finally, ALO mediates the effect of PU on EAC with a significant indirect effect (p-value 0.003, smaller than α 0.050).
In addition, the BIU variable mediates the effect of ATU on ASU with a significant indirect effect (p-value 0.000, smaller than α 0.050), and BIU and ASU mediate the effect of ATU on ALO (p-value 0.000, smaller than α 0.050).
The BIU, ASU, and ALO variables also mediate the effect of ATU on EAC with a significant indirect effect (p-value 0.000, smaller than α 0.050). BIU mediates the effect of ATU on ALO with a significant indirect effect (p-value 0.005, smaller than α 0.050), and BIU and ALO mediate the effect of ATU on EAC (p-value 0.007, smaller than α 0.050).
The ASU variable mediates the effect of BIU on ALO with a significant indirect effect (p-value 0.000, smaller than α 0.050), and ASU and ALO mediate the effect of BIU on EAC (p-value 0.000, smaller than α 0.050). ALO mediates the effect of BIU on EAC with a significant indirect effect (p-value 0.006, smaller than α 0.050). Finally, ALO also mediates the effect of ASU on EAC with a significant indirect effect (p-value 0.000, smaller than α 0.050).
In practical terms, these results confirm that in the context of primary education, the successful integration of technologies such as VR is highly dependent on students’ initial perceptions of the system’s ease of use. Teachers and educational technology developers need to ensure that the VR system interface is simple, intuitive, and accessible in order to foster positive attitudes and intentions to use it. On the other hand, these findings also underline the importance of teacher training, as teacher competence in guiding the use of VR will greatly contribute to students’ perceptions of ease of use, which then spreads throughout the mediation pathways that influence learning outcomes and overall technology acceptance. Therefore, VR implementation strategies in primary schools should not only focus on providing hardware, but also on technical training, interface simplification, and ongoing support to ensure effective and sustainable use in the long term.
The results of the hypothesis test indicate a positive and substantial connection between the factors assessed, which support the effective implementation of VR technology in enhancing reading literacy in elementary schools. It was found that the Perceived Ease of Use (PEOU) of the system significantly impacts the Perceived Usefulness (PU), demonstrating that the more user-friendly the VR system is, the greater the benefits experienced by the user. In addition, PEOU and PU also positively affect the users’ Attitude Towards Using (ATU) the system, which ultimately drives the Behavioral Intention to Use (BIU) the system. This intention then contributes to the Actual System Use (ASU), which directly affects the improvement of students' reading literacy Actual Learning Outcome (ALO). Thus, PEOU, PU, ATU, and BIU are vital in supporting the successful implementation of VR technology to improve elementary school students' reading literacy.
However, the study has limitations in that it solely relies on survey responses and self-reported data from respondents. While this approach is effective in capturing students' perceptions, attitudes, and subjective experiences with the VR system, it does not fully capture the objective effectiveness of the technology in real-world educational settings. Self-reported data are susceptible to various biases, such as social desirability bias or discrepancies between students' perceptions and their actual capabilities. Therefore, the findings of this study should be interpreted with caution. To address these limitations, future research is recommended to incorporate more objective data, such as pre-test and post-test scores, direct classroom observations, or system usage logs. A mixed-methods approach could also provide a more comprehensive analysis, allowing for a more accurate and thorough verification of the VR system's effectiveness in improving learning outcomes.
[1] Al-Ansi, A.M., Jaboob, M., Garad, A., Al-Ansi, A. (2023). Analyzing augmented reality (AR) and virtual reality (VR) recent development in education. Social Sciences & Humanities Open, 8(1): 100532. https://doi.org/10.1016/j.ssaho.2023.100532
[2] Begum, D.S., Dutta, A., Borah, G., Sheikh, D.S., Jindal, T. (2024). Virtual reality in education: Transforming learning environments. Educational Administration Theory and Practice, 30(5): 8967-8973. https://doi.org/10.53555/kuey.v30i5.4491
[3] Chen, J., Fu, Z., Liu, H., Wang, J. (2024). Effectiveness of virtual reality on learning engagement: A meta-analysis. International Journal of Web-Based Learning and Teaching Technologies, 19(1): 1-14. https://doi.org/10.4018/IJWLTT.334849
[4] Javaid, M., Haleem, A., Singh, R.P., Dhall, S. (2024). Role of virtual reality in advancing education with sustainability and identification of additive manufacturing as its cost-effective enabler. Sustainable Futures, 8: 100324. https://doi.org/10.1016/j.sftr.2024.100324
[5] Leahy, M.A., Fitzpatrick, N.M. (2017). Early readers and academic success. Journal of Educational and Developmental Psychology, 7(2): 87-95. https://doi.org/10.5539/jedp.v7n2p87
[6] Abadia, R., Fritsch, J., Abdelaal, S., Jayawickrama, T. (2024). Opportunities overcome challenges in adopting immersive virtual reality in online learning. Computers and Education Open, 7: 100208. https://doi.org/10.1016/j.caeo.2024.100208
[7] Shah, S.F.A., Mazhar, T., Shahzad, T., Ghadi, Y.Y., Hamam, H. (2024). Integrating educational theories with virtual reality: Enhancing engineering education and VR laboratories. Social Sciences & Humanities Open, 10: 101207. https://doi.org/10.1016/j.ssaho.2024.101207
[8] Mystakidis, S., Lympouridis, V. (2023). Immersive learning. Encyclopedia, 3(2): 396-405. https://doi.org/10.3390/encyclopedia3020026
[9] Żammit, J. (2023). Exploring the effectiveness of virtual reality in teaching Maltese. Computers & Education: X Reality, 3: 100035. https://doi.org/10.1016/j.cexr.2023.100035
[10] Li, H. (2023). The effect of VR on learners’ engagement and motivation in K12 English education. Journal of Education, Humanities and Social Sciences, 22: 82-89. https://doi.org/10.54097/ehss.v22i.12291
[11] Portuguez-Castro, M., Santos Garduño, H. (2024). Beyond traditional classrooms: Comparing virtual reality applications and their influence on students’ motivation. Education Sciences, 14(9): 963. https://doi.org/10.3390/educsci14090963
[12] Sanfilippo, F., Blazauskas, T., Salvietti, G., Ramos, I., et al. (2022). A perspective review on integrating VR/AR with haptics into STEM education for multi-sensory learning. Robotics, 11(2): 41. https://doi.org/10.3390/robotics11020041
[13] Šlosar, L., Peskar, M., Pišot, R., Marusic, U. (2023). Environmental enrichment through virtual reality as multisensory stimulation to mitigate the negative effects of prolonged bed rest. Frontiers in Aging Neuroscience, 15: 1169683. https://doi.org/10.3389/fnagi.2023.1169683
[14] Won, M., Ungu, D.A.K., Matovu, H., Treagust, D.F., et al. (2023). Diverse approaches to learning with immersive virtual reality identified from a systematic review. Computers & Education, 195: 104701. https://doi.org/10.1016/j.compedu.2022.104701
[15] Díaz, P., Zarraonandía, T., Sánchez-Francisco, M., Aedo, I., Onorati, T. (2019). Do low cost virtual reality devices support learning acquisition? A comparative study of two different VR devices. In Interacción 2019: XX International Conference on Human Computer Interaction, Donostia, Spain, pp. 1-8. https://doi.org/10.1145/3335595.3335629
[16] Reer, F., Wehden, L.O., Janzik, R., Tang, W.Y., Quandt, T. (2022). Virtual reality technology and game enjoyment: The contributions of natural mapping and need satisfaction. Computers in Human Behavior, 132: 107242. https://doi.org/10.1016/j.chb.2022.107242
[17] Silva, M., Bermúdez, K., Caro, K. (2023). Effect of an augmented reality app on academic achievement, motivation, and technology acceptance of university students of a chemistry course. Computers & Education: X Reality, 2: 100022. https://doi.org/10.1016/j.cexr.2023.100022
[18] Wong, J.Y., Azam, A.B., Cao, Q., Huang, L., Xie, Y., Winkler, I., Cai, Y. (2024). Evaluations of virtual and augmented reality technology-enhanced learning for higher education. Electronics, 13(8): 1549. https://doi.org/10.3390/electronics13081549
[19] Radianti, J., Majchrzak, T.A., Fromm, J., Wohlgenannt, I. (2020). A systematic review of immersive virtual reality applications for higher education: Design elements, lessons learned, and research agenda. Computers & Education, 147: 103778. https://doi.org/10.1016/j.compedu.2019.103778
[20] Alifteria, F.A., Prastowo, T., Suprapto, N. (2023). Analysis of students’ critical thinking skills on virtual reality learning media. International Journal of Recent Educational Research, 4(1): 59-67. https://doi.org/10.46245/ijorer.v4i1.275
[21] Merchant, Z., Goetz, E.T., Cifuentes, L., Keeney-Kennicutt, W., Davis, T.J. (2014). Effectiveness of virtual reality-based instruction on students' learning outcomes in K-12 and higher education: A meta-analysis. Computers & Education, 70: 29-40. https://doi.org/10.1016/j.compedu.2013.07.033
[22] Huang, X., Zou, D., Cheng, G., Xie, H. (2021). A systematic review of AR and VR enhanced language learning. Sustainability, 13(9): 4639. https://doi.org/10.3390/su13094639
[23] Davis, F.D., Bagozzi, R.P., Warshaw, P.R. (1989). User acceptance of computer technology: A comparison of two theoretical models. Management Science, 35(8): 982-1003. https://doi.org/10.1287/mnsc.35.8.982
[24] Al-Adwan, A.S., Li, N., Al-Adwan, A., Abbasi, G.A., Albelbisi, N.A., Habibi, A. (2023). Extending the technology acceptance model (TAM) to predict university students’ intentions to use metaverse-based learning platforms. Education and Information Technologies, 28(11): 15381-15413. https://doi.org/10.1007/s10639-023-11816-3
[25] Radu, I. (2014). Augmented reality in education: A meta-review and cross-media analysis. Personal and Ubiquitous Computing, 18: 1533-1543. https://doi.org/10.1007/s00779-013-0747-y
[26] Wolf, E.J., Harrington, K.M., Clark, S.L., Miller, M.W. (2013). Sample size requirements for structural equation models: An evaluation of power, bias, and solution propriety. Educational and Psychological Measurement, 73(6): 913-934. https://doi.org/10.1177/0013164413495237
[27] Dash, G., Paul, J. (2021). CB-SEM vs PLS-SEM methods for research in social sciences and technology forecasting. Technological Forecasting and Social Change, 173: 121092. https://doi.org/10.1016/j.techfore.2021.121092
[28] Subhaktiyasa, P.G. (2024). PLS-SEM for multivariate analysis: A practical guide to educational research using SmartPLS. EduLine: Journal of Education and Learning Innovation, 4(3): 353-365. https://doi.org/10.35877/454RI.eduline2861
[29] Hair, J., Alamer, A. (2022). Partial least squares structural equation modeling (PLS-SEM) in second language and education research: Guidelines using an applied example. Research Methods in Applied Linguistics, 1(3): 100027. https://doi.org/10.1016/j.rmal.2022.100027
[30] Ishaq, M. (2023). The effects of cognitive-and affective-based trust on students’ knowledge sharing and learning performance during the Covid-19 pandemic. Knowledge Management & E-Learning: An International Journal, 15(2): 303-321. https://doi.org/10.34105/j.kmel.2022.14.007
[31] Purwanto, A., Sudargini, Y. (2021). Partial least squares structural squation modeling (PLS-SEM) analysis for social and management research: A literature review. Journal of Industrial Engineering & Management Research, 2(4): 114-123.
[32] Purwanto, A., Asbari, M., Santoso, T.I. (2021). Education management research data analysis: comparison of results between Lisrel, Tetrad, GSCA, Amos, SmartPLS, WarpPLS, and SPSS for small samples. Nidhomul Haq: Jurnal Manajemen Pendidikan Islam, 6(2): 382-399. https://doi.org/10.31538/ndh.v6i2.1575