Pawenary*![]() | Muniroh
| Muniroh![]() | Arief Suwandi
| Arief Suwandi![]() | Jerry Maratis
| Jerry Maratis![]() | Dwi Listiawati
| Dwi Listiawati![]() | Hendri
| Hendri![]()
© 2025 The authors. This article is published by IIETA and is licensed under the CC BY 4.0 license (http://creativecommons.org/licenses/by/4.0/).
OPEN ACCESS
This study aims to investigate the causal relationship between Artificial Intelligence (AI) integrated Human Machine Interface (HMI) system implementation on smart vision camera and the improved performance of waste processing machine operators. It examines how Human Resource Management (HRM) training practices, such as competency development, management change, and job design, influence the success of HMI implementation and contribute to enhanced operator performance. Employing a quantitative research method, this study collected data from selected samples, which were then analyzed using the Structural Equation Modeling-Partial Least Square (SEM-PLS) method. The analysis revealed several significant findings. The results show that improving employee performance has a strong influence on both HR development and the effectiveness of HMI usage. In addition, effective HR practices positively impact operator performance, and skilled operators significantly support the success of AI-integrated HMI systems. These findings suggest that combining technology with targeted HR development strategies is essential for building a more efficient and sustainable waste management system.
management, human resources, Human Machine Interface, optimization, performance, smart vision camera
One of the major problems faced by large cities around the world, including Indonesia, is waste management. The volume of waste generated continues to increase along with the number of people living in the world and what they consume. This adds to the burden on existing waste management systems. Many cities have invested in advanced waste processing technologies to address this issue. This includes sophisticated machines designed to process waste efficiently and environmentally friendly. Given the magnitude of environmental challenges, such as the increasing amount of waste and its contribution to climate change, there is an urgent need for innovative solutions that can be applied in various cities and regions in Indonesia. The application of machines in waste management not only provides an opportunity to modernize waste management infrastructure but also encourages sustainable urban development by increasing efficiency and reducing environmental impacts [1].
However, the effectiveness of these machines is highly dependent on the skills and efficiency of the operators who operate them. Often, there is a gap between the potential of the technology and actual performance due to limitations in human-machine interaction. In the era of rapid digital transformation, improving human resource (HR) performance is the main key to driving economic growth and improving people's standard of living [2]. Many HR personnel do not have the knowledge and expertise to process waste that can be utilized more efficiently due to economic limitations and difficulties in gaining access to knowledge or education. This inability has driven previous human resource personnel or waste operators to rely only on hereditary knowledge that is not effective enough. Knowledge is a combination of contextual information, framed experience, expert experience, and values that produce innovation and pure experience. Knowledge is also considered as organizational culture, skills, reputation, intuition, and codified theories that influence human behavior and thinking [3].
The waste processing system in this study utilizes smart vision camera technology integrated with a Human Machine Interface (HMI) system. This technology allows operators to run waste processing machines by correlating real-time visual data captured by the smart camera with the HMI interface. The integration is expected to improve accuracy, efficiency, and occupational safety in the waste management process.
In Indonesia, waste processing has traditionally been carried out using conventional methods. The government has established an organization known as TPS3R (Reduce, Reuse, Recycle Waste Processing Facility) to support decentralized waste management efforts. The primary function and concept of TPS3R is to reduce the quantity and/or improve the characteristics of waste before it is further processed at the Final Processing Site (FPS). Although some facilities have adopted machinery for waste processing, operations are still largely manual and rely on conventional electric motor systems without modern automation.
Central Java was selected as the research sample based on strategic considerations. The region is well-known as a popular tourist destination frequently visited by international travelers, thus maintaining environmental performance and cleanliness is a key priority. Therefore, implementing advanced waste processing systems that integrate HMI and smart camera technology is considered both relevant and urgent to uphold environmental standards and support the region’s tourism image.
HMI has emerged as a potential solution to bridge this gap. HMI is a system that enables more intuitive and efficient interaction between human operators and machines. By designing a user-friendly and responsive interface, HMI can improve operator understanding of the ongoing process, speed up decision-making, and reduce the potential for human error, which has a greater risk of work accidents. The use of HMI technology that requires new training and skill development not only increases the market value of operators in the waste processing industry, but also opens up new career opportunities in the fields of technology and operational management. The increase in new knowledge in handling waste processing makes operators have added value, increasing the quality of work and social levels in society because jobs that were previously considered less prestigious can gain new recognition as skilled technology-based jobs.
The implementation of HMI in the context of waste processing has the potential to significantly increase operational efficiency. By providing real-time visualization of the processing process, enabling more precise control, and providing instant feedback, HMI can help operators optimize machine performance and increase overall productivity. With a more intuitive and efficient interface, operators can manage larger volumes of waste with lower error rates. This increase in productivity has the potential to translate into increased income, either through increased salaries or performance bonuses. In addition, the use of HMI can also have a positive impact on occupational safety aspects. By providing clear and easy-to-understand information about machine status and potential hazards, HMI can help prevent work accidents and increase operator awareness of safety procedures.
This causal study aims to investigate the causal relationship between HMI implementation and improved performance of waste processing machine operators. This study will explore how Human Resource Management (HRM) practices, such as training, competency development, change management, and job design can influence the success of HMI implementation and improved operator performance. The results of this study are expected to provide significant contributions to the development of more effective and sustainable waste management strategies, while improving the working conditions and productivity of waste processing machine operators.
A training program will be conducted to introduce the implementation of Artificial Intelligence (AI) in vision cameras that are integrated with the HMI system. The participants will include both technicians and machine operators. This initiative is expected to ensure that, moving forward, technicians and operators possess equal skills and competencies in operating the vision camera systems integrated with HMI.
Qashlim et al. [4] presented that using HMI always requires human involvement, especially prospective system users in order to find out the characteristics and needs of users. This certainly raises many challenges, such as finding the right subjects to convince them to be involved in research and this is difficult and time-consuming, especially for evaluations on systems designed for specific populations.
According to Priswanto et al. [5], based on the results of system testing, HMI can work well, with a success rate of 100%, this shows that the addition of an HMI module to the system does not affect the performance of the conveyor system, but with the HMI feature it will make it easier to monitor the process in the industry from the control room.
Khaeruman et al. [6] emphasized that strategy in human resource (HR) planning plays a crucial role in improving organizational performance. A critical initial step in developing this strategy is conducting an in-depth analysis of HR needs. In this regard, companies must thoroughly understand the demands and expectations of their employees. A comprehensive evaluation of the skills and competencies required by the company is essential, taking into account current industry trends, recent innovations, and regulatory changes that may affect skill requirements. Therefore, an effective HR planning strategy demands a comprehensive understanding of industry dynamics and workforce needs, enabling the company to adapt responsively to ongoing changes.
Based on previous research, this study seeks to help workers understand the operational work of machines using HMI and create modules or guidelines. This study also focuses on analyzing the effectiveness of implementing HMI in improving the performance of human resources, especially waste processing machine operators, designing and implementing HMI systems that play a role in human resources, and measuring improvements in work efficiency, safety, and productivity after implementing HMI.
(a) Human Machine Interface
The system that connects humans and machine technology is called HMI. The HMI system can control the status manually or through real-time computer visualization. This can be done by reading data sent through the I/O port used by the controller system. Some ports commonly used by controller systems include COM ports, USB ports, RS232 ports, and even serial ports. One of the tasks of the HMI is to create a real visualization of technology or systems. so that the HMI design can be adjusted to make physical work easier [7]. In the industrial world, HMI is in the form of a Graphic User Interface (GUI) display on a computer screen faced by both machine operators and users who need machine work data. HMI offers various visualizations to view and monitor machine data that is connected online and in real time, as well as various buttons and sliders that can be used to control the machine in various ways. In addition, summary data on machine work can be displayed graphically on the HMI [8].
(b) Human Resource Management
According to Ricardianto [9], HRM is a science or a way to manage the relationship and role of resources (workforce) owned by individuals efficiently and effectively and can be used optimally so that (goals) are shared by the company, employees and the community. Human resource management is the design of activities that include the procurement and coordination of human resources. According to Robbins and Judge [10], HR performs two main functions: management functions and operational functions. Management functions include:
1) Planning—which is responsible for setting goals, strategies, and organizational plans to coordinate activities.
2) Organizing—responsible for determining what needs to be done, how to do it, and who should do it.
3) Leading—in management, leaders are responsible for directing, organizing, and organizing the work and activities of individuals in an organization.
4) Controlling—is a management job that involves monitoring or supervising the work process to ensure that everything goes according to plan [11].
(c) Performance Management
Wardhana et al. [12] found that traditional management methods increase productivity with low results. Therefore, we must shift from results-oriented management to performance-oriented management. It also mentioned there are three dimensions that shape the success of performance management. They are effectiveness (the company's ability to meet consumer needs), effectiveness (the company's ability to use resources economically), and change (the company's ability to adapt to future changes). Performance management is the process of identifying, measuring, managing, and developing the performance of organizations, teams, and individuals within an organization to anticipate performance declines. Armstrong the study [12] defines performance management as a process that helps achieve higher levels of performance in an organization through effective management of individuals and teams. According to the study [12], there are four principles of performance management:
Clarity, which means that the goals to be achieved must be clear and measurable.
Challenge, which means that goals must be challenging but achievable in order to motivate employees.
Commitment, which means that management and employees must be committed to using the resources needed to achieve these goals.
Continuous, constructive feedback is essential for guiding performance and helps employees stay on track, correct mistakes early, and stay motivated.
In addition to continuous feedback, modern performance management emphasizes a more holistic view of employee performance, incorporating both quantitative metrics and qualitative aspects such as skill development, collaboration, and adaptability [13].
Performance management has undergone a significant transformation, shifting from traditional annual reviews to more dynamic, continuous feedback systems. This evolution addresses the limitations of infrequent evaluations, which often fail to provide timely insights or foster employee development. Organizations are increasingly adopting continuous feedback mechanisms to enhance communication, promote real-time performance improvement, and align employee goals with organizational objectives. Such approaches foster a culture of collaboration and adaptability, crucial in today's fast-paced business environments [14].
The method used is a quantitative research method. The quantitative method is based on the philosophy of positivism which is carried out to research a particular population or sample [10]. The data results obtained from the samples taken will be processed using the Structural Equation Modeling-Partial Least Square (SEM-PLS) method, so that it is expected that a relationship of influence will be obtained between the conventional processing system using the HMI machine and an evaluation of the performance results from previously working as scavengers will have the potential to become operators in the future and the environment will be better when waste processing at Temporary Disposal Site (TDS) is completed without impacting waste disposal at the Final Processing Site (FPS).
3.1 Research findings
3.1.1 Respondents demographics
Respondents obtained were 31, with the majority aged 20-30 years at 64.5% and dominated by men at 74.2%, the rest were women at 25.8% (Table 1). Respondents who were not married were 67.7%, the rest were married at 32.3%. The last education of the majority of respondents was high school/equivalent at 80.6%, the rest were elementary school at 9.7%, D3 at 3.2%, and S1/S2 at 6.5%. Positions in the company were mostly 41.9% as operators, 29% as staff, 16.1% as management, the rest 12.9% others (student interns). The length of work of the majority of respondents was 54.8% for 1-5 years, the rest 32.3% for less than 1 year, 3.2% for 6-10 years and 9.7% for more than 10 years. The domicile of respondents 80.6% came from Central Java, the remaining 19.4% came from Yogyakarta. The majority of respondents' income 48.4% was less than 5 million rupiah, and the rest were more than 5 million rupiah.
Table 1. Respondent demographics
|
Frequency |
Percentage |
||
|
Age |
< 20 years old |
2 |
6.5% |
|
20-30 years old |
20 |
64.5% |
|
|
31-40 years old |
3 |
9.7% |
|
|
> 40 years old |
6 |
19.4% |
|
|
Gender |
Male |
23 |
74.2% |
|
Female |
8 |
25.8% |
|
|
Marriage Status |
Single |
21 |
67.7% |
|
Married |
10 |
32.3% |
|
|
Last Education |
Elementary |
3 |
9.7% |
|
Senior High School |
25 |
80.6% |
|
|
Diploma III |
1 |
3.2% |
|
|
Bachelor Degree |
2 |
6.5% |
|
|
Position in Company |
Operator |
13 |
41.9% |
|
Staff |
9 |
29.0% |
|
|
Management |
5 |
16.1% |
|
|
Others |
4 |
12.9% |
|
|
Length of Work |
< 1 Year |
10 |
32.3% |
|
1-5 Year |
17 |
54.8% |
|
|
6-10 Year |
1 |
3.2% |
|
|
> 10 Year |
3 |
9.7% |
|
|
Area |
Jawa Tengah |
25 |
80.6% |
|
Yogyakarta |
6 |
19.4% |
|
|
Income |
< Rp. 5.000.000 |
15 |
48.4% |
|
Rp 5.000.000 – Rp 6.000.000 |
12 |
38.7% |
|
|
Rp 6.000.000 – Rp 7.000.000 |
3 |
9.7% |
|
|
> Rp 7.000.000 |
1 |
3.2% |
|
|
Age |
< 20 years old |
2 |
6.5% |
|
20-30 years old |
20 |
64.5% |
|
|
31-40 years old |
3 |
9.7% |
|
|
> 40 years old |
6 |
19.4% |
|
3.2 Data analysis
The survey data obtained in this study were processed and analyzed using the Structural Equation Modeling (SEM) method using the Partial Least Square (PLS) approach. Sarstedt et al. [15], stated that PLS is an alternative SEM method used to overcome the problem of relationships between complex variables and can be used as a very appropriate analysis tool in developing theories. In exploratory research like this, the PLS-SEM method is useful because it helps provide better findings [15]. In addition, PLS-SEM is more suitable for use because there are no prerequisites required regarding sample size and certain distributions [16]. The software used is SmartPLS 3.2.9.
Evaluation of the measurement model has several requirements that must be met, including convergent validity, reliability, and discriminant validity. The measurement model is said to meet the requirements of convergent validity when each indicator has an outer loading value above 0.50 and each construct has an AVE value of 0.50 or more [17]. Hair et al. [17] explained that the AVE value is the main average value of the squared loadings of a set of indicators and is equivalent to the construct. In short, when the AVE value is 0.50, it indicates that the construct has succeeded in explaining more than half of the indicator variance. Table 2 shows the outer loading value of each indicator ranging from 0.514 to 0.950 as well as the AVE value of each construct ranging from 0.573 to 0.835, meaning that it has met the requirements of convergent validity. In addition, Composite Reliability (CR) and Cronbach Alpha are used to measure the reliability of the consistency of each construct of the indicator. Based on Table 2, the Composite Reliability (CR) and Cronbach Alpha values are more than 0.7, meaning they meet the construct reliability requirements [11].
Table 2. Reliability and construct validity discriminant validity testing
|
Variable |
Indicator |
Outer Loading |
CR |
Cronbach's Alpha |
AVE |
|
X1. Improvement Performance |
X1.1 Skills and Expertise |
0.617 |
0.870 |
0.808 |
0.581 |
|
X1.2 Self Motivation |
0.871 |
||||
|
X1.3 Leadership Support |
0.899 |
||||
|
X1.4 Teamwork |
0.805 |
||||
|
X1.5 Work System and Facilities |
0.558 |
||||
|
X2. Human Resources Management |
X2.1 Job Task |
0.514 |
0.867 |
0.814 |
0.573 |
|
X2.2 Work Quality |
0.796 |
||||
|
X2.3 Quantity |
0.848 |
||||
|
X2.4 Timeliness |
0.819 |
||||
|
X2.5 Cost Effectiveness |
0.760 |
||||
|
Y1. Machine Operator |
Y1.1 Availability |
0.890 |
0.938 |
0.902 |
0.835 |
|
Y1.2 Performance |
0.950 |
||||
|
Y1.3 Quality |
0.900 |
||||
|
Y2. Human Machine Interface Method |
Y2.1 Efficiency |
0.906 |
0.932 |
0.902 |
0.774 |
|
Y2.2 Quality |
0.896 |
||||
|
Y2.3 Safety |
0.932 |
||||
|
Y2.4 Environmental Sustainability |
0.777 |
Table 3. Fornell-Larcker discriminant validity criteria
|
Category |
X1 |
X2 |
Y1 |
Y2 |
|
X1. Performance Improvement |
0.762 |
|||
|
X2. Human Resources |
0.452 |
0.757 |
||
|
Y1. Machine Operators |
0.445 |
0.538 |
0.914 |
|
|
Y2. Human Machine Interface Methods |
0.623 |
0.490 |
0.605 |
0.880 |
Note: The numbers in “Bold” are the square root values of AVE, the others are the correlation values
Table 4. HTMT discriminant validity criteria
|
Category |
X1 |
X2 |
Y1 |
Y2 |
|
X1. Performance Improvement |
- |
|||
|
X2. Human Resources |
0.502 |
- |
||
|
Y1. Machine Operators |
0.486 |
0.555 |
- |
|
|
Y2. Human Machine Interface Methods |
0.671 |
0.549 |
0.656 |
- |
Recommendations of Fornell and Larcker namely by comparing the square root value of AVE to the correlation value between constructs. Table 3 shows that the overall AVE root value of the construct is greater than the correlation value between constructs, meaning that the model has met discriminant validity. In addition, the discriminant validity testing method can also use the Heterotrait-Monotrait Ratio of Correlations (HTMT) method. HTMT testing is carried out by calculating the ratio between the correlation between constructs (heterotrait) and the correlation in the same construct (monotrait) estimated from the PLS model. The recommended HTMT value is below 0.90 [17] If the HTMT value between two constructs is less than 0.90, then the construct is considered to have good convergent consistency and can be distinguished from other constructs. The test results in Table 4 show that the HTMT value between the two constructs is less than 0.90, so it can be concluded that all constructs have met the requirements of discriminant validity.
4.1 Hypothesis
Structural model evaluation was conducted to test the research hypothesis. The bootstrapping procedure was carried out with 500 resampling using SmartPLS 3.2.9 software [15]. The quality of the research structural model was analyzed by testing the coefficient of determination (R2), effect size (f2), predictive relevance (Q2) and path coefficients [17]. This study has 6 direct influence hypotheses and 2 indirect influence hypotheses (mediating effects). The results in Table 5 show that hypothesis H1 is accepted, meaning that Performance Improvement (X1) has a significant effect on human resources (X2) (β=0.452 and p=0.002).
Hypothesis H1 is accepted, meaning that the better the performance improvement, the more human resources will improve. Hypothesis H2 is not accepted/rejected, meaning that performance improvement (X1) does not have a significant effect on machine operators (Y1) as seen from the p-value of 0.334, more than the real level of 0.10. In addition, the H3 hypothesis is accepted, meaning that Performance Improvement (X1) has a significant effect on the Human Machine Interface Method (Y2) (β=0.413 and p=0.067). The H3 hypothesis is accepted, meaning that the higher the performance improvement factor, the better the results of using the Human Machine Interface Method. Likewise, the H4 hypothesis is accepted, meaning that human resources (X2) have a significant effect on machine operators (Y1) (β=0.423 and p=0.051). The H4 hypothesis is accepted, meaning that the better the existing human resource management, the better the machine operators will be. The H5 hypothesis is not accepted/rejected, meaning that human resources (X2) do not have a significant effect on the Human Machine Interface Method (Y2) as seen from the p-value of 0.613, more than the real level of 0.10.
Based on the findings of Doan [18], although the level of significance (α) can be determined by the researcher, in social science research, α is conventionally set at 1%, 5%, and occasionally 10%. However, the α level is flexible and typically depends on several factors, such as the type and purpose of the research being conducted, the sample size, and the potential costs associated with drawing incorrect conclusions.
In addition, the H6 hypothesis is accepted, meaning that Machine Operators (Y1) have a significant effect on the Human Machine Interface Method (Y2) (β=0.363 and p=0.096). Hypothesis H6 is accepted, meaning that the increasing machine operator factor will also increase the results of using the Human Machine Interface Method. Based on Table 5, it shows that hypothesis H7 is rejected, meaning that increasing performance (X1) through machine operators (Y1) does not have a significant effect on the Human Machine Interface Method (Y2) (β=0.092 and p=0.452). Likewise, hypothesis H8 is rejected, meaning that human resources (X2) through machine operators (Y1) do not have a significant effect on the Human Machine Interface Method (Y2) (β=0.153 and p=0.318. The direct influence between variables can be seen in Figure 1.
Figure 1. Framework of think
Table 5. Results of hypothesis testing (direct and indirect effects)
|
Hypothesis |
Paths |
β-value |
S. D |
t-value |
p-values |
Information |
|
H1 |
X1-> X2 |
0.452 |
0.149 |
3.027 |
0.002** |
Hypothesis accepted |
|
H2 |
X1-> Y1 |
0.254 |
0.263 |
0.966 |
0.334 |
Hypothesis rejected |
|
H3 |
X1-> Y2 |
0.413 |
0.225 |
1.832 |
0.067* |
Hypothesis accepted |
|
H4 |
X2-> Y1 |
0.423 |
0.216 |
1.953 |
0.051* |
Hypothesis accepted |
|
H5 |
X2-> Y2 |
0.108 |
0.214 |
0.505 |
0.613 |
Hypothesis rejected |
|
H6 |
Y1-> Y2 |
0.363 |
0.218 |
1.663 |
0.096* |
Hypothesis accepted |
|
H7 |
X1-> Y1-> Y2 |
0.092 |
0.123 |
0.752 |
0.452 |
Hypothesis rejected |
|
H8 |
X2-> Y1-> Y2 |
0.153 |
0.154 |
0.998 |
0.318 |
Hypothesis rejected |
Table 6. Effect size value (f2)
|
Paths |
f2 |
Information |
|
X1-> X2 |
0.257 |
Medium effect |
|
X1-> Y1 |
0.078 |
Small effect |
|
X1-> Y2 |
0.267 |
Medium effect |
|
X2-> Y1 |
0.216 |
Medium effect |
|
X2-> Y2 |
0.016 |
Small effect |
|
Y1-> Y2 |
0.184 |
Medium effect |
Effect size (f2) testing is conducted to determine changes in the coefficient of determination (R2) value on endogenous latent variables. Changes in the R2 value indicate the influence between variables that affect endogenous latent variables. The effect is said to be large when f2 is 0.35, medium when f2 is 0.15, and small when f2 is 0.02 [19]. The f² indicates whether or not exogenous variables effect endogenous variables [20]. The F² may be subdivided into numerous categories, as recommended by Cohen [19], small effect (f²=0,02), medium effect (f²=0.15), and larger effect (f²=0.35). Based on Table 6, it shows that the performance improvement factor (X1) has a medium effect on the coefficient of determination of human resources (X2) and the Human Machine Interface Method (Y2), while it has a small effect on machine operators. The human resource factor (X2) has a medium effect on the coefficient of determination of machine operators (Y1) and a small effect on the Human Machine Interface Method (Y2). In addition, the machine operator factor (Y1) has a medium effect on the Human Machine Interface Method (Y2).
Based on the findings that the performance improvement factor has a significant positive effect on human resources and the Human Machine Interface Method, it is planned to conduct training programs for technicians and operators focused on the use of machine interface systems. The goal is to enhance their technical skills and ensure consistent competency in operating the integrated systems.
Furthermore, the study also shows that the human resource factor has a significant positive effect on machine operators, indicating that better management of human resources leads to improved operator performance. Therefore, it is recommended to establish a more robust organizational structure that supports the professional development of technicians and operators.
Lastly, the results reveal that the machine operator factor has a significant positive effect on the Human Machine Interface Method, meaning that improvements in operator capabilities contribute directly to better outcomes in HMI usage. Hence, it is suggested that future studies explore the modernization of machines in alignment with the growing skills and competencies of technicians and operators.
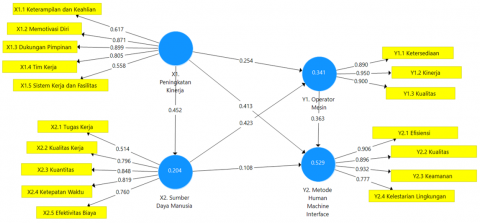
Structural model research involves the use of statistical techniques, such as Structural Equation Modeling (SEM), to examine and quantify the relationships between latent variables within a theoretical framework. This approach allows researchers to test hypotheses about causal pathways, assess direct and indirect effects, and evaluate the overall fit of the model to empirical data. Structure model of this research can be seen as in Figure 2.
Figure 2. Structural model
4.2 Predictive model
The level of diversity of endogenous variables that can be explained by exogenous variables as a whole is explained by R2. According to Cohen, there are three criteria for R2 values, namely weak (R2 ranges from 0.02–0.13), moderate (R2 ranges from 0.13–0.26), and substantial (R2 more than 0.26). Based on Table 7, it shows that the model is able to explain the diversity of human resources factors (X2) by 20.4%, Machine Operator factors (Y1) by 0.341, and Human Machine Interface Method Factors (Y2) by 52.9%, while the rest is explained by other variables outside the model. The results of this study indicate that the Human Machine Interface Method model (Y2) is included in the substantial criteria. Furthermore, by using the blindfolding method to see the predictive relevance value (Q2), namely measuring how well the observation value is generated by the model and also its parameter estimates. In Table 7, the Q2 values obtained are between 0.076 and 0.308, a Q2 value of more than 0 means that the model has good predictive relevance [20].
The initiative will also include the development of a training module that incorporates the use of smart vision cameras, allowing the system to read and interpret field data in real time. Technicians and operators will receive targeted training on both the functions of the smart vision camera and the operation of the HMI. This integrated training approach aims to ensure that personnel are equipped with the necessary knowledge and skills to manage the technology effectively and optimize system performance.
Table 7. R2 and Q2
|
Category |
R2 |
Q² |
|
X2. Human Resources Management |
0.204 |
0.076 |
|
Y1. Machine Operator |
0.341 |
0.231 |
|
Y2. Human Machine Interface method |
0.529 |
0.308 |
Source: Author's Estimation.
Based on the results of the research hypothesis test, the following conclusions can be drawn:
1. The performance improvement factor has a significant positive effect on human resources and the Human Machine Interface Method, meaning that the better the performance improvement, the more human resources will improve, and the better the Human Machine Interface Method.
2. The human resource factor has a significant positive effect on machine operators, meaning that the better the management of existing human resources, the better the machine operators will be.
3. The machine operator factor has a significant positive effect on the Human Machine Interface Method, meaning that the more the machine operator factor improves, the results of using the Human Machine Interface Method will also improve.
One of the limitations of this study is the limited number of subjects available as research samples in the field. Future research is recommended to further develop the findings by enhancing the functionality of AI-integrated HMI systems, allowing them to support additional factors in the development of human resource performance.
I sincerely thank Esa Unggul University for providing the necessary resources and to teammates for their valuable contributions, without which this work would not have been possible.
[1] Singagerda, F.S., Dewi, D.A., Trisnawati, S., Septarina, L., Dhika, M.R. (2025). Towards a circular economy: Integration of AI in waste management for sustainable urban growth. Journal of Lifestyle and SDGs Review, 5(1): e02642-e02642. https://doi.org/10.47172/2965-730X.SDGsReview.v5.n01.pe02642
[2] Tahar, A., Setiadi, P.B., Rahayu, S., (2022). Strategi pengembangan sumber daya manusia dalam menghadapi era revolusi industri 4.0 menuju era society 5.0. Jurnal Pendidikan Tambusai, 6(2): 12380-12394. https://doi.org/10.31004/jptam.v6i2.4428
[3] Abubakar, A.M., Elrehail, H., Alatailat, M.A., Elçi, A. (2019). Knowledge management, decision-making style and organizational performance. Journal of Innovation & Knowledge, 4(2): 104-114. https://doi.org/10.1016/j.jik.2017.07.003
[4] Qashlim, A., Prahasto, T., Gernowo, R., Al, U., Mandar, A., Barat, S. (2014). Evaluasi human machine interface menggunakan kriteria Usability pada sistem e-learning perguruan tinggi. Jurnal Sistem Informasi Bisnis, 2: 96-107. https://doi.org/10.21456/vol4iss2pp96-107
[5] Priswanto, P., Herdantyo, T., Nugroho, D.T., Ramadhani, Y., Mubyarto, A. (2018). Desain dan simulasi sistem HMI (Human Machine Interface) berbasis citect SCADA pada konveyor proses di industri. Prosiding Seminar Nasional & Internasional, 1(1): 253-262.
[6] Khaeruman, K., Mukhlis, A., Bahits, A., Tabroni, T. (2024). Strategi perencanaan sumber daya manusia untuk meningkatkan kinerja organisasi. Jurnal Riset Bisnis dan Manajemen Tirtayasa, 7(1): 41-50. http://doi.org/10.48181/jrbmt.v7i1.23910
[7] Sadi, S., Putra, I.S. (2018). Rancang bangun monitoring ketinggian air dan sistem kontrol pada pintu air berbasis arduino dan SMS Gateway. Jurnal Teknik: Universitas Muhammadiyah Tangerang, 7(1): 77-91.
[8] Adriono, E., Sumardi, S., Setiyono, B. (2015). Perancangan sistem antarmuka berbasis HMI (Human Machine Interface) pada mesin auto ballpress plant di PT. Apac inti corpora. Transient: Jurnal Ilmiah Teknik Elektro, 4(3): 534-541. https://doi.org/10.14710/transient.v4i3.534-541
[9] Ricardianto, P. (2018). Human Capital Management. Indonesia, Bogor: In Media.
[10] Robbins, S.P., Judge, T.A. (2019). Organizational Behaviour. Pearson.
[11] Hasmin, Nurung, J. (2021). Manajemen Sumber Daya Manusia. Indonesia, Solok: Mitra Cendekia Media.
[12] Wardhana, A., Sari, A.P., Limgiani, Gunaisah, E., et al. (2022). Manajemen Kinerja. In Konsep, Teori, Dan Penerapannya. Indonesia, Bandung: Penerbit Media Sains Indonesia.
[13] Eyo-Udo, N.L., Apeh, C.E., Bristol-Alagbariya, B., Udeh, C.A., Ewim, C.P.M. (2025). Performance management evolution in organizations: An HR review of modern approaches and techniques. Account and Financial Management Journal, 10(1): 3479-3490. https://doi.org/10.47191/afmj/v10i1.05
[14] Idrus, S. (2025). Performance management reimagined: Moving beyond annual reviews to continuous feedback. The Journal of Academic Science, 2(1): 222-231.
[15] Sarstedt, M., Ringle, C.M., Hair, J.F. (2022). Partial least squares structural equation modeling. In Handbook of Market Research. Springer, Cham. https://doi.org/10.1007/978-3-319-57413-4_15
[16] Sugiyono. (2020). Metode Peneiltian Kuantitatif. Indonesia, Bandung: Alfabeta.
[17] Hair, J., Anderson, R., Babin, B., Black, W. (2013). Multivariate Data Analysis. Pearson International.
[18] Doan. (2005). Type I and Type II error. In Encyclopedia of Social Measurement, pp. 883-888. https://doi.org/10.1016/B0-12-369398-5/00110-9
[19] Cohen. (2013). Statistical Power Analysis for the Behavioral Sciences. New York: Routledge. https://doi.org/10.4324/9780203771587
[20] Richter, N.F., Sinkovics, R.R., Ringle, C.M., Schlägel, C. (2016). A critical look at the use of SEM in international business research. International Marketing Review, 33(3): 376-404. https://doi.org/10.1108/IMR-04-2014-0148