Sarala Murugesan![]() | Muralidhara Benakanahally Lakshminarasaiah*
| Muralidhara Benakanahally Lakshminarasaiah*![]() | Suresh Ramaiah
| Suresh Ramaiah![]() | Rajesh Balarama
| Rajesh Balarama![]()
© 2025 The authors. This article is published by IIETA and is licensed under the CC BY 4.0 license (http://creativecommons.org/licenses/by/4.0/).
OPEN ACCESS
Machine learning (ML) is a widespread technique in classification tasks, fraud detection, time series analysis, and many such challenging problems. One such problem in the education sector is recognizing the different types of educational credentials to verify the genuineness of such credentials. We have not found any research work to identify educational documents using ML. The objective of this work is to recognize the educational credentials across multiple categories to avoid manual processes. This novel study recognizes credentials from large datasets into five categories: Choice-Based Credit System (CBCS), Computerized, Handwritten, Non-CBCS, and Degree Certificate. The two statistical feature extraction methods, namely Gray Level Co-occurrence Matrix (GLCM), and Gray Level Histogram Analysis (GLHA) were used to extract the features from these credentials, and we stored them in the database. These features were trained using six supervised classifier algorithms including Naïve Bayes (NB), Multinomial Logistic Regression (MLR), Decision Tree (DT), K-Nearest Neighbours (KNN), Support Vector Machine (SVM), and Random Forest (RF) to recognize the credentials. We analyzed the performances of these algorithms as follows: (i) the impact of hyper-parameters on each algorithm, (ii) the performance of two feature extraction methods, and (iii) the recommendation of classifiers based on accuracy. SVM yielded good results using the GLCM feature extraction method among the above-mentioned algorithms, attaining a high accuracy of 98.4%. This approach can also recognize documents like employment agreements, contracts agreements, financial statements, etc., in business, and industry sectors.
supervised, classification, multiclass, GLCM, GLHA
Machine Learning (ML) techniques are based on computer science, statistics, and mathematics. It is used in various fields including healthcare, agriculture, banking, and e-commerce, and works well with low-dimensional structure data. ML techniques are extensively employed in time series analysis, spam detection, content-based retrieval, and classification in healthcare and agriculture fields. The fundamental concept in ML is ‘learning’, which involves using statistics, mathematics, and computer programming to make predictions. Three core approaches in ML are supervised, unsupervised, and semi-supervised. Supervised algorithms such as Decision Tree (DT), Multinomial Logistic Regression (MLR), K-Nearest Neighbours (KNN), Naïve Bayes (NB), Support Vector Machine (SVM), Linear Discriminant Analysis (LDA), and Random Forest (RF) are trained using labeled datasets, while unsupervised learning algorithms like clustering algorithms are trained without the use of labeled data. Finally, semi-supervised learning algorithms are trained on normal datasets.
In general, classifiers utilize various techniques. NB and DT follow frequency tables; LDA and MLR use the Covariance matrix; KNN uses the similarity measure, and SVM works based on vectors and margin [1]. Datasets are typically found in four categories: (i) Structured: well-defined structure, and stored in typical structure, (ii) Unstructured: no predefined format e.g., sensor data, images, videos, and audio files, (iii) Semi-structured: XML, and JSON documents, and (iv) Metadata: e.g., file size. The classification task can be classified into three types: (i) Binary classification: having two classes e.g., ‘spam or ham’, ‘true or false’, (ii) Multiclass classification: having more than two classes. e.g., classification of severity of disease i.e., early stage, middle state, and severe stage, and (iii) Multi-label classification, e.g., multi-level text classification [2]. In this work, we utilized a supervised learning approach, structured datasets, and focused on multiclass classification.
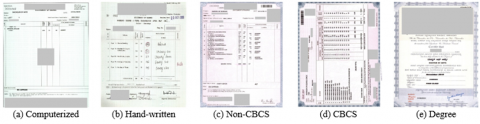
In the education sector, ML algorithms can be utilized to predict student performance [3], assist in decision-making [4], recognize documents during the admission process, and enable biometric identification of both staff and students for attendance tracking. They can also facilitate evaluation of answer scripts, and the identification of research articles [5-7]. Additionally, ML techniques can be applied to verify the authenticity of educational credentials. The emergence of fake credentials has become a concern due to technological advancements that allow individuals to secure jobs and gain admission to higher education institutions. In response to this issue, institutions frequently update the designs of credentials like marks cards and degree certificates to prevent fraud. A key challenge in verifying authenticity lies in classifying the various templates used for these credentials. This research focuses on recognizing five types of educational credentials: CBCS, Computerized, Non-CBCS, Hand-written, and Degree certificates to avoid manual segregation. Each type of credential has unique features such as logo, content texture, border color, and Registrar Evaluation signature. The ‘Hand-written’ marks card was issued by the Bangalore University until 2004. The ‘computerized’ marks card was issued from 2005 to 2009 without student photos, whereas the ‘Non-CBCS’ marks cards were issued with photos until 2013. The ‘CBCS’ mark cards have been issued since 2014, and referred to degree certificates as ‘Degree’.
The contribution of this research work is the automated classification of five types of credentials. The performance of classifiers was compared with hyper-parameters with GLCM, and GLHA. Additionally, we recommended the algorithm for each category based on the overall performance. In Section 2, we have presented the comprehensive literature review. The datasets, and methodology employed in empirical study are outlined in Section 3. Section 4 discusses the classifier algorithms’ outcomes. Section 5 concludes findings, and future work.
ML extends the applications across various disciplines. The initial literature review on document classification utilized image data with ML algorithms, noting that most prior research has centered on natural language processing (NLP) techniques for document classification. Therefore, we focus on image-based classification in healthcare and agriculture applications leveraging ML methodologies. Feature extraction from high-dimensional data can be accomplished using methods like GLCM and GLHA to train ML models effectively. Consequently, we broaden the literature review to include feature extraction techniques.
In this context, the functioning of ML algorithms, as well as their applications, benefits, and limitations, as presented in various studies [8-10]. Further, it focuses on ML algorithms are used for disease prediction, and document classification that yielded the best results. The SVM was particularly effective for classifying images of airplanes, ferries, laptops, and stop signs [11]. In predicting diabetes, XGBoost outperformed other algorithms using a dataset sourced from the UCI repository [12]. Random Forest excelled in classifying Coronary Artery Disease (CAD) based on datasets from Near East University (NEU) [13].
In document classification, the biomedical documents from datasets such as Farm-Ads, TREC 2006 genetics, and Bio Creative Corpus-II, SVM, Passive-Aggressive, and Stochastic Gradient Descent provided the top results [14]. Research articles were categorized into scientific, business, and social sciences via ML algorithms, with SVM outperforming KNN, NB, and DT [15]. Patents registered from 1985 to 2018 by the United States Patent and Trademark Office (USPTO) were classified geographically [16]. Additionally, text and ML algorithms categorized research and educational institution documents [17]. The datasets of crowdsourced mapping, Vxheaven, and banknotes were classified using ML algorithms, and KNN provided better results [18]. The content was extracted using OCR, preprocessed by NLP techniques, and classified by ML and deep learning algorithms to recognize the documents [19-21].
The subsequent works emphasize feature extraction methods employed in classification tasks. The GLCM method, a second-order statistical tool utilized in medical datasets for feature extraction, plays a significant role in pattern recognition via texture analysis [22]. In the realm of image forgery detection, GLCM is used for feature extraction, with classification handled by ML algorithms [23]. GLCM feature extraction and SVD were applied in the detection of forged educational certificates [24]. Barburiceanu et al. [25] used GLCM for feature extraction in 3D image sensor data to classify textured volumetric data. The GLCM method, and SVM classifier were used for lung cancer detection [26]. Techniques such as GLCM, GLCM +C, and GLCM+V enhanced the identification of posterior capsule opacification (PCO) [27]. The classification of kidney stones, cystic formations, and kidney tumors from ultrasound images achieved the highest accuracy when utilizing GLCM alongside PCA [28]. Lastly, the classification of fractures versus non-fractures from X-ray images in the Musculoskeletal Radiograph (MURA) dataset was performed using GLCM and various ML techniques [29].
3.1 Materials
We collected two thousand five hundred scanned copies of Bangalore University's original marks cards and degree certificates from various departments of Bangalore University. The dataset was scanned with 300 dpi in image file format using the FUJITSU scanner. The datasets were segregated into five categories such as (i) CBCS, (ii) Computerized, (iii) Handwritten, (iv) Non-CBCS, and (v) Degree certificate based on the templates, and samples are shown in Figure 1.
Figure 1. Educational credentials
Each category contains five hundred data samples. The dataset is split into a 4:1 ratio for training and testing. Hence, the training dataset contains four hundred data samples, and the test dataset contains one hundred data samples.
3.2 Methodology
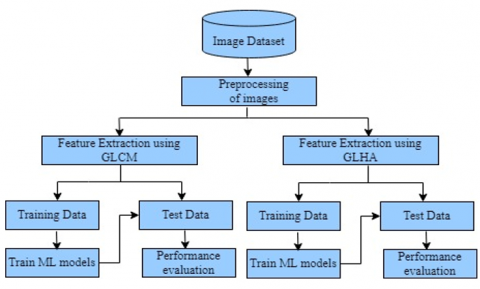
The ML techniques were used to classify the five types of educational credentials. The proposed methodology is shown in Figure 2. First, the dataset was preprocessed to reduce computational time. Second, the features were extracted from credential using GLCM, and the GLHA method. Finally, six supervised classifier algorithms were applied to classify the educational credentials.
Figure 2. Proposed methodology
|
Algorithm 1: Recognizing educational credentials |
|
Dataset: scanned image dataset of five types of educational credentials Input: [{e11, e12, . . ., e1m}, {e21, e22, . . ., e2m}, {e31, e32, . . ., e3m}, {e41, e42, . . ., e4m}, {e51, e52, . . ., e5m}] //m=500 //Preprocessing 1. for img in range(0,2500): gray = convert_to_gray(img) 2. db1 = extracted the features of gray using GLCM 3. db2 = extracted the features of gray using GLHA 4. for i in range(0,2): split the dbi into 4:1 for training and testing ML model // Fit ML model // algj means jth algorithm 5. for j in range(0,6): // six ML algorithms Modelj = fit ML model using algj with dbi Predj = predict the test data using Modelalg If Predj > 90: Go to step 5 else: Fine-tune the hyper-parameters 6. end for 7. end for 8. evaluate the performance |
3.2.1 Preprocessing
In this preprocessing stage, the images were resized into 256×256 from raw size to reduce the computational time, and converted from RGB into grayscale channels for feature extraction purposes.
3.2.2 Feature extraction
The traditional feature extraction methods based on texture, wavelet, edge detection, histogram, and statistics are available to extract the features. In the field of medical image processing, texture and histogram analysis techniques were utilized to extract features, leading to high accuracy in disease diagnosis [26-29]. The GLCM method serves as a feature extraction technique focused on texture analysis, effectively drawing out features from image data [23-25]. Additionally, the histogram analysis method GLHA demonstrated superior performance in image retrieval [30]. Consequently, we selected the GLCM and GLHA methods from among others for feature extraction in recognizing educational credentials.
GLCM: It includes six features such as contrast, correlation, dissimilarity, energy, Angular Second Moment (ASM), and homogeneity to extract the features of the preprocessed image dataset. Contrast calculates the spatial frequency of image using the Eq. (1). Correlation measures the relationship between a pixel and its neighbour using Eq. (2). Dissimilarity measures the distance between feature pairs in the ROI as per Eq. (3). Energy provided the degree of pixel pair repetitions using the Eq. (4). Homogeneity measures the similarity of pixels as mentioned in Eq. (5). ASM refers the square of the energy as mentioned in Eq. (6). Here $P_{i j}$ represents the (i,j)th element of GLCM matrix, i denotes the row, and j represents the column. The value N represents the number of gray levels in the image, and $\sigma^2$ depicts the variance of pixel intensities.
Contrast $=\sum_{i, j=0}^{N-1} P_{i j}(i-j)^2$ (1)
Correlation $=\sum_{i, j=0}^{N-1} P_{i j} \frac{(i-\mu)(j-\mu)}{\sigma^2}$ (2)
Dissimilarity $=\sum_{i, j=0}^{N-1}|i-j| P_{i j}$ (3)
Energy $=\sum_{i, j=0}^{N-1}\left(P_{i j}\right)^2$ (4)
Homogeneity $=\sum_{i, j=0}^{N-1} \frac{P_{i j}}{1+(i-j)^2}$ (5)
ASM=Energy×Energy (6)
GLHA: It is a first-order statistical texture features analysis method [30]. Here we used five features: skewness, standard deviation, mean, entropy, and kurtosis to extract features of the preprocessed image dataset. Mean $\mu$, and standard deviation $\sigma$ return the average, and standard deviation of pixel intensities of the entire image respectively. Skewness represents the inequality of pixel intensity level distribution using Eq. (7). Kurtosis measures the peak of the pixel intensity distribution as mentioned in Eq. (8). Entropy measures the randomness of the image using Eq. (9). Here, $b$ represents each bin, $L$ points out the total number of bins, and $P(b)$ is the probability distribution of bin $b$.
Skewness $=\frac{1}{(\sigma)^3} \sum_{b=1}^L(b-\mu)^3 P(b)$ (7)
Kurtosis $=\frac{1}{(\sigma)^4} \sum_{b=1}^L(b-\mu)^4 P(b)$ (8)
Entropy $=-\sum_{b=1}^L P(b) \log _2[P(b)]$ (9)
3.3 Classifiers
Classifier algorithms are used to train ML models using labeled datasets. The six classifier algorithms such as Naïve Bayes, Decision Tree, Multinomial Logistic Regression, KNN, SVM, and Random Forest were chosen for classifying the educational credentials based on the performance [3-12]. The performance of each algorithm is detailed from Section 3.3.1 to Section 3.3.6. Besides these algorithms, one can use the neural network, and ensemble classifier algorithms like Adaboosing, XGBoosting, and GradientBoosting to compare the performance.
3.3.1 Naïve Bayes
It works based on Baye’s theorem, and it is used in text or document classification, and spam detection [2]. In this research work, we compared all algorithms of Naïve Bayes including Gaussian NB, Complement NB, Multinomial NB, Bernoulli NB, and categorical NB. Complement NB is suitable for imbalanced datasets. Multinomial NB supports integer discrete features, and Bernoulli and Categorical NB supports discrete features.
3.3.2 Multinomial Logistic Regression
It solves the multiclass problems and uses a Softmax function to estimate the probability as mentioned in Eq. (10). Here z represents the features, k points out each category, and c represents the total number of classes. The performance of this algorithm was compared using ‘solver’ parameters such as ‘lbfgs’, ‘newton-cg’, ‘sag’, and ‘saga’. The ‘newton-cg’ performed well out of all.
Softmax $=\frac{e^{z_k}}{\sum_{k=1}^c e^{z_k}}$ (10)
3.3.3 Decision Tree
It builds the decision tree based on features using two criterion methods 'entropy' and 'gini' using Eq. (11), and Eq. (12) respectively. Here, $p\left(x_i\right)$ represents the probability of the random variable $x$, and $p_i$ represents the proportion of each class $i$.
Entropy $=-\sum_{i=1}^n p\left(x_i\right) \log _2 p\left(x_i\right)$ (11)
Gini $=1-\sum_{i=1}^c p_i^2$ (12)
3.3.4 K-Nearest Neighbours
It is an ‘instance-based learning’ method in classification algorithms, as well as called ‘lazy learning’ [2]. Here, the number of neighbours was fine-tuned i.e., n. from 1 to 4, and analyzed the results.
3.3.5 Support Vector Machine
It constructs the hyper-plane based on the features, and classifies the data samples by boundary. Here, the gamma $\gamma$ value was chosen as 0.05 based on empirical study, and the performance of SVM was compared by varying the kernel methods such as ‘linear’, ‘rbf’, ‘ploy’, ‘sigmoid’, and ‘precomputed’.
3.3.6 Random Forest
It is an ensemble classification technique, that uses multiple decision tree classifiers to classify data. It also used the same criterion metrics mentioned in Eq. (11), and Eq. (12).
3.4 Performance metrics
Generally, the precision, recall, F1-score, and accuracy of a classification model are typically used to assess its performance. These metrics were determined using the formulas mentioned in Eqs. (13)-(16) respectively. Here, True Positive (TP), True Negative (TN), False Positive (FP), and False Negative (FN) are denoted by TP, TN, FP, and FN respectively.
Precision $=\frac{T P}{T P+F P}$ (13)
Recall $=\frac{T P}{T P+F N}$ (14)
$F 1-$ score $=2 \times \frac{\text { precision } \times \text { recall }}{\text { precision }+ \text { recall }}$ (15)
Accuracy $=\frac{T P+T N}{T P+T N+F P+F N}$ (16)
To analyze the effectiveness of six ML algorithms, an empirical study was conducted for classifying educational credentials. The performance of the classification algorithm with various parameters is discussed in Section 4.1, and the results of the GLCM method, and GLHA method are represented in Section 4.2, and Section 4.3 presents the recommended algorithm for each category.
4.1 Performance analysis of ML algorithms with hyper-parameters
The performance of six ML algorithms was evaluated by fine-tuning their hyper-parameters to get better results as follows: (i) NB: the complement NB showed lower accuracy, while the multinomial NB achieved moderate accuracy with the GLHA method, and the Gaussian NB outperformed the others using GLCM. (ii) KNN: this algorithm tends to perform better when the n value is an odd number, as it relies on the majority voting of neighbors for classification. (iii) MLR: the 'sag' and 'saga' solvers are suitable for the GLHA method but not for the GLCM method. The 'lbfgs' offered moderate results, while 'newton-cg' yielded better performance. (iv) Decision Tree: both the 'gini' and 'entropy' criteria yielded good results with the GLCM method. (v) RF: similarly, the 'gini' and 'entropy' criteria performed well with the GLCM method. (vi) SVM: the kernels 'rbf', 'poly', and 'linear' showed enhanced performance using the GLCM method. Overall, MLR and KNN showed strong performance with the GLHA method, whereas the other algorithms excelled with the GLCM method.
4.2 Results of ML algorithms with GLCM, and GLHA method
The suitable parameters for each classifier were selected based on the performance presented in Table 1. The results of six ML algorithms using GLCM and GLHA feature extraction methods are summarized in Table 2. The statistical metrics like precision, recall, and accuracy of four ML algorithms including Gaussian NB, DT, SVM, and RF are high when using GLCM feature extraction. On the other hand, these metrics are high in MLR, and KNN when using the GLHA feature extraction method.
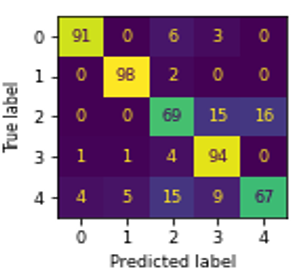
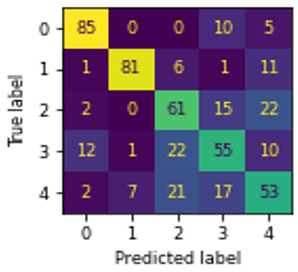
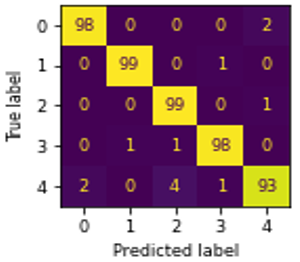
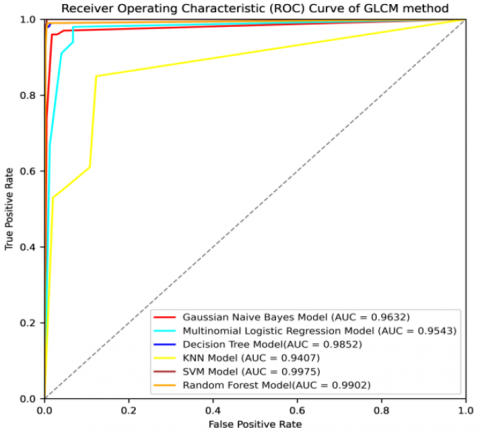
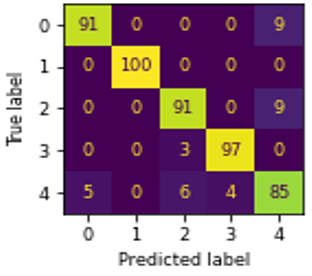
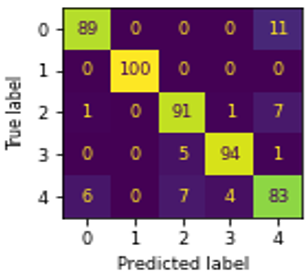
The confusion matrix, and ROC curve of six algorithms NB, MLR, DT, KNN, SVM, and RF using GLCM are shown in Figures 3(a)-(f), and Figure 4 respectively.
Table 1. Performance analysis of all classifiers
|
Sl. No. |
Classifiers |
Method/Parameter |
Parameters Used |
Accuracy of Methods |
|
|
GLCM |
GLHA |
||||
|
1. |
NB |
Complement NB |
var_smoothing=1e-09 |
55.0 |
56.8 |
|
Multinomial NB |
68.0 |
79.4 |
|||
|
Gaussian NB |
91.0 |
85.8 |
|||
|
2. |
KNN |
Number of neighbours |
1 |
63.8 |
91.4 |
|
2 |
61.6 |
80.9 |
|||
|
3 |
67.0 |
91.4 |
|||
|
4 |
65.6 |
91.0 |
|||
|
3. |
MLR |
Solver |
saga |
24.4 |
85.0 |
|
sag |
30.6 |
84.6 |
|||
|
lbfgs |
64.2 |
84.0 |
|||
|
newton-cg |
83.8 |
92.0 |
|||
|
4. |
DT |
Criterion |
gini |
97.0 |
91.8 |
|
entropy |
97.2 |
93.2 |
|||
|
5. |
RF |
Criterion |
gini |
96.0 |
91.6 |
|
entropy |
97.4 |
93.4 |
|||
|
6. |
SVM |
Kernel |
rbf |
77.0 |
97.0 |
|
poly |
93.8 |
92.8 |
|||
|
linear |
98.4 |
93.4 |
|||
Table 2. Performance analysis using GLCM, and GLHA
|
Sl. No. |
Classifiers (Method/Parameter Chosen) |
Precision |
Recall |
F1-Score |
Accuracy |
||||
|
GLCM |
GLHA |
GLCM |
GLHA |
GLCM |
GLHA |
GLCM |
GLHA |
||
|
1. |
Naïve Bayes (Gaussian NB) |
91.4 |
85.6 |
91.0 |
85.8 |
90.8 |
86.0 |
91.0 |
85.8 |
|
2. |
KNN (n=3) |
67.4 |
91.4 |
67.0 |
91.4 |
67.2 |
91.4 |
67.0 |
91.4 |
|
3. |
Multinomial Logistic Regression (newton-cg) |
84.0 |
92.0 |
83.8 |
92.0 |
83.4 |
92.2 |
83.8 |
92.0 |
|
4. |
Decision Tree (entropy) |
97.2 |
93.4 |
97.2 |
93.2 |
97.2 |
93.2 |
97.2 |
93.2 |
|
5. |
Random Forest (entropy) |
97.4 |
93.2 |
97.4 |
93.4 |
97.4 |
93.4 |
97.4 |
93.4 |
|
6. |
SVM (linear) |
98.4 |
93.4 |
98.4 |
93.4 |
98.4 |
93.4 |
98.4 |
93.4 |
(a)
(b)
(c)
(d)
(e)
(f)
Figure 3. Confusion matrix of ML algorithms using GLCM: (a) NB, (b) MLR, (c) DT, (d) KNN, (e) SVM, (f) RF
Figure 4. ROC curve of ML algorithms using GLCM
(a)
(b)
(c)
(d)
(e)
(f)
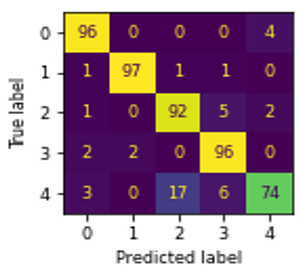
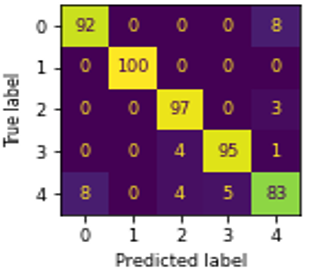
Figure 5. Confusion matrix of ML algorithms using GLHA: (a) NB, (b) MLR, (c) DT, (d) KNN, (e) SVM, (f) RF
In Figure 3, ‘0’, ‘1’, ‘2’, ‘3’, and ‘4’ represents the educational credentials of CBCS, Computerized, Degree, Hand-written, and Non-CBCS respectively. The SVM outperformed well in classifying CBCS, Hand-written marks card, and degree certificates well than other algorithms. The computerized marks card classified well when using the both DT, and RF. The Non-CBCS marks cards classified well using DT.
The confusion matrix, and ROC curve of six algorithms NB, MLR, DT, KNN, SVM, and RF using GLHA are shown in Figures 5(a)-(f), and Figure 6 respectively. In Figure 5, ‘0’, ‘1’, ‘2’, ‘3’, and ‘4’ represents the educational credentials of CBCS, Computerized, Degree, Hand-written, and Non-CBCS respectively. The CBCS marks cards classified well in RF than other algorithms. The computerized marks card classified well with all algorithms except NB. The degree certificates, and hand-written marks card classified well in RF, and SVM respectively. DT outperformed well in classifying Non-CBCS marks card than other algorithms.
Figure 6. ROC curve of ML algorithms using GLHA
4.3 Comparative results of ML algorithms
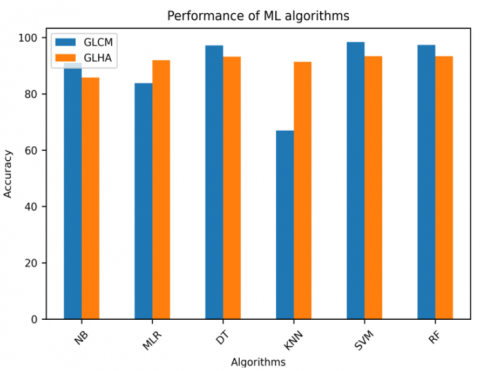
The performance of six ML algorithms has been independently analyzed using GLCM, and GLHA feature extraction methods, and the merits and demerits of all hyper-parameters are summarized in Table 3. We have analyzed the ML algorithms’ performance for each category, and their overall performance with priority. The performance of all algorithms with both GLCM and GLHA is illustrated in Figure 7.
Figure 7. Performance analysis
Table 3. Performance analysis of ML algorithm
|
Sl. No. |
Classifiers (Method/Parameter Chosen) |
Category-Wise Performance |
Priority of Performance |
Remarks |
||
|
GLCM |
GLHA |
GLCM |
GLHA |
|||
|
1. |
Naïve Bayes (Gaussian NB) |
|
|
6 |
|
Complement NB, and Multinomial NB provided less accuracy than Gaussian NB. Bernoulli NB, and Categorical NB suitable for discrete features. |
|
2. |
Multinomial Logistic Regression (newton-cg) |
|
Computerized |
|
4 |
The solver methods ‘newton-cg’, ‘lbfgs’ ‘sag’, and ’saga’ are suitable to multiclass, and ‘liblinear’, and ‘newton-cholesky’ are suitable to binary class. |
|
3. |
Decision Tree (entropy) |
Computerized, Non-CBCS |
Computerized |
3 |
|
The criterion ‘entropy’ works well when compared with ‘gini’. |
|
4. |
KNN (n=3) |
|
Computerized |
|
5 |
Performance of KNN decreases when n value is even number, and increases when n value is odd number. |
|
5. |
SVM (linear) |
CBCS, Degree, Hand-written |
Computerized |
1 |
|
The kernel ‘linear’ performs better than ‘rbf’ and ‘poly’, and the kernel ‘sigmoid’ and ‘precomputed’ are unsuitable. |
|
6. |
Random Forest (entropy) |
|
Computerized |
2 |
|
The criterion ‘entropy’ works well when compared with ‘gini’. |
The features were extracted using GLCM, and GLHA methods to recognize the educational credentials. The performance of six ML algorithms was analyzed along with hyper-parameters. In the context of document recognition, using the GLCM method, the following algorithms performed well: SVM with ‘linear’ kernel outperformed well than others, and got 98.4% accuracy. RF and DT with ‘entropy’ criterion achieved accuracies of 97.4%, and 97.2% respectively. Naïve Bayes performed well with Gaussian NB, and got accuracy of 91.0%. When using the GLHA method, Multinomial Logistic Regression with ‘newton-cg’ got an accuracy of 92.0%, while KNN with n=3 achieved an accuracy of 91.4%. The educational credentials were effectively recognized using SVM, particularly with the hand-written templates. The GLCM method outperformed the GLHA method. This research will be valuable for the automated recognition of various educational credentials held by institutions globally, before verifying their authenticity. The machine learning models developed here can be utilized in organizations and industries to address real-world challenges related to document recognition. In the current approach, the image dataset was converted to grayscale for feature extraction using GLCM and GLHA, with the extracted features subsequently stored in a database to train the ML models. Convolutional Neural Networks (CNNs) facilitate automatic feature extraction from image datasets in both grayscale and RGB channels. Texture features are better emphasized in the RGB channel compared to grayscale. Therefore, in future work, the CNN model will be employed to address the limitations of the current methodology for recognizing educational credentials in RGB format without the need to store the features.
The authors thank Bangalore University for providing the scanned datasets of marks cards and degree certificates for this research work. The author Sarala M acknowledges the Department of Science and Technology (DST), Karnataka Science and Technology Promotion Society (KSTePS), Government of Karnataka, India for receiving the fellowship support (Award letter No.: DST/KSTePS/Ph.D. Fellowship/PHY-06: 2022 – 23/472) for research work.
[1] Alnuaimi, A.F., Albaldawi, T.H. (2024). An overview of machine learning classification techniques. BIO Web of Conferences, 97: 00133. https://doi.org/10.1051/bioconf/20249700133
[2] Sarker, I.H. (2021). Machine learning: Algorithms, real-world applications and research directions. SN Computer Science, 2(3): 160. https://doi.org/10.1007/s42979-021-00592-x
[3] Sekeroglu, B., Dimililer, K., Tuncal, K. (2019). Student performance prediction and classification using machine learning algorithms. In Proceedings of the 2019 8th International Conference on Educational and Information Technology, Cambridge, United Kingdom, pp. 7-11. https://doi.org/10.1145/3318396.3318419
[4] Nieto, Y., García-Díaz, V., Montenegro, C., Crespo, R.G. (2019). Supporting academic decision making at higher educational institutions using machine learning-based algorithms. Soft Computing, 23: 4145-4153. https://doi.org/10.1007/s00500-018-3064-6
[5] Ersozlu, Z., Taheri, S., Koch, I. (2024). A review of machine learning methods used for educational data. Education and Information Technologies, 29: 22125-22145. https://doi.org/10.1007/s10639-024-12704-0
[6] Shah, P.K., Joshiara, H.A., Mundanad, M., Patel, C., Padheriya, H., Bhatt, D. (2024). Machine learning advancements in education: An in-depth analysis and prospective directions. International Journal of Intelligent Systems and Applications in Engineering, 12(3): 3229-3237.
[7] Onyema, E.M., Almuzaini, K.K., Onu, F.U., Verma, D., Gregory, U.S., Puttaramaiah, M., Afriyie, R.K. (2022). Prospects and challenges of using machine learning for academic forecasting. Computational Intelligence and Neuroscience, 2022(1): 5624475. https://doi.org/10.1155/2022/5624475
[8] Alzubi, J., Nayyar, A., Kumar, A. (2018). Machine learning from theory to algorithms: An overview. Journal of Physics: Conference Series, 1142: 012012. https://doi.org/10.1088/1742-6596/1142/1/012012
[9] Gowri, S.G., Devi, R., Sethuraman, K., Phil, M. (2019). Machine learning. International Journal of Research and Analytical Reviews, 6(2): 197-208.
[10] Dey, A. (2016). Machine learning algorithms: A review. International Journal of Computer Science and Information Technologies, 7(3): 1174-1179.
[11] Loussaief, S., Abdelkrim, A. (2016). Machine learning framework for image classification. In 2016 7th International Conference on Sciences of Electronics, Technologies of Information and Telecommunications (SETIT), Hammamet, Tunisia, pp. 58-61. https://doi.org/10.1109/SETIT.2016.7939841
[12] El-Sofany, H., El-Seoud, S.A., Karam, O.H., Abd El-Latif, Y.M., Taj-Eddin, I.A. (2024). A proposed technique using machine learning for the prediction of diabetes disease through a mobile app. International Journal of Intelligent Systems, 2024(1): 6688934. https://doi.org/10.1155/2024/6688934
[13] Yuvalı, M., Yaman, B., Tosun, Ö. (2022). Classification comparison of machine learning algorithms using two independent CAD datasets. Mathematics, 10(3): 311. https://doi.org/10.3390/math10030311
[14] Behera, B., Kumaravelan, G. (2020). Performance evaluation of machine learning algorithms in biomedical document classification. Performance Evaluation, 29(5): 5704-5716.
[15] Chowdhury, S., Schoen, M.P. (2020). Research paper classification using supervised machine learning techniques. In 2020 Intermountain Engineering, Technology and Computing (IETC), Orem, UT, USA, pp. 1-6. https://doi.org/10.1109/IETC47856.2020.9249211
[16] Miric, M., Jia, N., Huang, K.G. (2023). Using supervised machine learning for large-scale classification in management research: The case for identifying artificial intelligence patents. Strategic Management Journal, 44(2): 491-519. https://doi.org/10.1002/smj.3441
[17] Krasnyanskiy, M.N., Obukhov, A.D., Solomatina, E.M. (2019). The algorithm of document classification of research and education institution using machine learning methods. In 2019 International Science and Technology Conference "EastConf", Vladivostok, Russia, pp. 1-6. https://doi.org/10.1109/EastConf.2019.8725319
[18] Rashid, F., Gargaare, S.M., Aden, A.H., Abdi, A. (2022). Machine learning algorithms for document classification: comparative analysis. International Journal of Advanced Computer Science and Applications, 13(4): 260-265. https://doi.org/10.14569/IJACSA.2022.0130430
[19] Ling, X., Gao, M., Wang, D. (2020). Intelligent document processing based on RPA and machine learning. In 2020 Chinese Automation Congress (CAC), Shanghai, China, pp. 1349-1353. https://doi.org/10.1109/CAC51589.2020.9326579
[20] Guha, A., Samanta, D. (2020). Real-time application of document classification based on machine learning. In Intelligent Computing Paradigm and Cutting-edge Technologies: Proceedings of the First International Conference on Innovative Computing and Cutting-edge Technologies (ICICCT 2019), Istanbul, Turkey, pp. 366-379. https://doi.org/10.1007/978-3-030-38501-9_37
[21] Omurca, S.I., Ekinci, E., Sevim, S., Edinç, E.B., Eken, S., Sayar, A. (2023). A document image classification system fusing deep and machine learning models. Applied Intelligence, 53(12): 15295-15310. https://doi.org/10.1007/s10489-022-04306-5
[22] Singh, S., Srivastava, D., Agarwal, S. (2017). GLCM and its application in pattern recognition. In 2017 5th International Symposium on Computational and Business Intelligence (ISCBI), Dubai, United Arab Emirates, pp. 20-25. https://doi.org/10.1109/ISCBI.2017.8053537
[23] Ranjan, S., Garhwal, P., Bhan, A., Arora, M., Mehra, A. (2018). Framework for image forgery detection and classification using machine learning. In 2018 2nd International Conference on Trends in Electronics and Informatics (ICOEI), Tirunelveli, India, pp. 1-9. https://doi.org/10.1109/ICOEI.2018.8553924
[24] Sathiya, M.U., Jasmine, M.P., Ebenezar, L., Cephas, S. (2021). Detecting forged scan of educational certificates using GLCM and SVD algorithm. International Journal of Creative Research Thoughts, 9(2): 4791-4803.
[25] Barburiceanu, S., Terebes, R., Meza, S. (2021). 3D texture feature extraction and classification using GLCM and LBP-based descriptors. Applied Sciences, 11(5): 2332. https://doi.org/10.3390/app11052332
[26] Ankita, R., Kumari, C.U., Mehdi, M.J., Tejashwini, N., Pavani, T. (2019). Lung cancer image-feature extraction and classification using GLCM and SVM classifier. International Journal of Innovative Technology and Exploring Engineering, 8(11): 2211-2215. https://doi.org/10.35940/ijitee.K2044.0981119
[27] Liu, C., Hu, Y., Chen, Y., Fang, J., et al. (2024). Improvements to a GLCM-based machine-learning approach for quantifying posterior capsule opacification. Journal of Applied Clinical Medical Physics, 25(2): e14268. https://doi.org/10.1002/acm2.14268
[28] Kumar, D. (2020). Feature extraction and selection of kidney ultrasound images using GLCM and PCA. Procedia Computer Science, 167: 1722-1731. https://doi.org/10.1016/j.procs.2020.03.382
[29] Mall, P.K., Singh, P.K., Yadav, D. (2019). GLCM based feature extraction and medical X-RAY image classification using machine learning techniques. In 2019 IEEE Conference on Information and Communication Technology, Allahabad, India, pp. 1-6. https://doi.org/10.1109/CICT48419.2019.9066263
[30] Malik, F., Baharudin, B. (2013). The statistical quantized histogram texture features analysis for image retrieval based on median and Laplacian filters in the DCT domain. The International Arab Journal of Information Technology, 10(6): 616-624.