Hawra’a A. Yassin*![]() | Abdul Hassan K. Al-Shukur
| Abdul Hassan K. Al-Shukur![]()
© 2025 The authors. This article is published by IIETA and is licensed under the CC BY 4.0 license (http://creativecommons.org/licenses/by/4.0/).
OPEN ACCESS
The impact of pier shapes, spacing, skew angle, and non-uniform sediment on local scour brought on by clear-water flow around three side-by-side (rectangular and lenticular) bridge piers was investigated experimentally. The experiments varied the spacing between piers' and four different pier skew angles ($0^{\circ}, 30^{\circ}, 45^{\circ}$, and $60^{\circ}$), the sediment has mean particle size $\left(\mathrm{d}_{50}=0.873 \mathrm{~mm}\right)$, and a flow depth of 5 cm , and $\mathrm{S} / \mathrm{D}_{\mathrm{p}}=1$ and 3. The results show that under all flow conditions, Maximum Scour Depth (MSD) were found in front of the bridge piers, regardless of the size of the piers. Because of the extensive exposed area, the rectangular form has the largest $\mathrm{MSD}=10.6,8.8$, and 6.5 for $\mathrm{P}_1, \mathrm{P}_2$, and $\mathrm{P}_3$, respectively at a skew angle of $30^{\circ}$ and $\mathrm{S} / \mathrm{D}_{\mathrm{p}}=1$, otherwise, the lenticular shapes are the best for piers Since they reduce scour depth by $30 \%$ compared to rectangular shapes when the skew angle increased from $\left(0^{\circ}-30^{\circ}\right)$ the scour depth increased, but when the skew-angle was more than $30^{\circ}$ the scour depth decreased for the same $\mathrm{S} / \mathrm{D}_{\mathrm{p}}$. When $\alpha \geq 45$, the scour downstream increases. The scour depth decreases when the spacing increases $\left(\alpha=0^{\circ}\right.$ and $\left.30^{\circ}\right)$. On the other hand, for the skew angle of $45^{\circ}$, the scour depth is greater when $\left(\mathrm{S} / \mathrm{D}_{\mathrm{p}}=1\right)$ compared to $\left(\mathrm{S} / \mathrm{D}_{\mathrm{p}}=3\right)$ when the skew angle is $\left(0^{\circ}-30^{\circ}\right)$, but when the skew angle is more than $30^{\circ}$, the scour depth increased as the spacing between the piers increased. Additionally, it shows the MSD decreased as the armor layer's grain size increased.
bridge piers, local scour, horseshoe vortex, side-by-side, pier spacing
Most bridge collapses globally are caused by local scour, which is probably the most common danger to bridge piers and foundations [1].
Recently, several studies have investigated the impact of different factors on the creation of vortex systems around bridge piers. These factors can be classified into three groups: (1) flow parameters, such as approach velocity and flow depth; (2) sediment parameters, including median size, size distribution, and sediment density; and (3) pier characteristics, including shape, type, and dimensions [2-7]. A significant factor that increases the scour danger of bridges is the pier geometry. The pier geometry significantly influences the development and resistance of the vortex system [1, 6, 8-12].
The vertical shape of the pier at the riverbed substantially affected the flow structure. This leads to significant variations in the flow field based on the pier shape, resulting in different scour patterns. The most important variables in the scour process are the vortices generated from the pressure differentials when the water velocity profile encounters an obstruction. The scouring mechanism occurs because of the complex vortex of a system. This system includes a horseshoe vortex, wake vortex, trailing vortex, and bow-wave vortex [12, 13].
According to the study conducted by Namaee and Sui [14], the horseshoe vortex, which is mainly caused by the downflow, is located on the pier's upstream face. The horseshoe vortex and fast flow close to the piers increased the bed shear stress, resulting in localized scour formation around the piers. Then, the horseshoe and wake vortices gradually subsided, the scouring process decreased, and the bed shear stress decreased. Consequently, the bed shear stress exceeds the critical shear stress, causing the scour hole to reach an equilibrium state where the sediment particles are no longer transported or moved into suspension. There are two types of vortices: wake vortices caused by the separation area at the sides and downstream of the pier, and horseshoe vortices at the front side of the pier [15].
Two different situations related to sediment transport may cause scour: (1) clear water, which refers to the absence of sediment transport in the approach channel bed, and (2) live beds, which refers to the transport of bed sand in the approach flow. In the first condition, at the start of the sediment motion, the shear stress at the bed is less or, most likely, equal to the critical shear stress at the bed; in the second condition, the shear stress at the bed exceeds the critical shear stress. Localized and general scours are the two main types of scour. The combination of contraction and local scour results in localized scour rather than general scour owing to the presence of the bridge. Ignoring the local scour phenomena in the pier design may lead to a high mortality rate or significant financial loss. Sediment particle movement is related to the creation of an armor layer in the scour hole surrounding piers. As a result, coarser grains remain behind while finer sediment particles move. The remaining finer grains are concealed by the bigger grains, and the coarser grains to greater flow [16]. Armoring is primarily caused by selective erosion, wherein the critical shear stress for movement (τ*c) exceeds the shear stress at the bed of finer sediment particles (τ). When there is clear water flow, scour at bridge piers can take a long time to stabilize, mainly if the flow velocity is close to the threshold for the first sediment movement. This is because of the removal of the entire volume of sediment particles from the scour hole and the interaction of flowing water with the pier under the influence of vortices, which determine the equilibrium scour depth. When the scour depth is at equilibrium, it ceases to fluctuate over time [17].
Based on the literature review above, pier erosion is a complicated phenomenon that can have serious repercussions, including the whole or partial collapse of bridges. In the coming decades, there will be a significant increase in flood occurrences and unanticipated variations in river flow as a consequence of warming [18], uneven distribution of rainwater [19], caused by water pollution [20], and human activities [21]. Several studies involving deep lab tests have been conducted to examine pier scours. In most of these tests, the scour at the pier was examined under conditions of uniform sediment. Based on a review of the literature, it was discovered that there has yet to be much research done on scour surrounding side-by-side piers, and there have not been enough studies published on when sediment conditions are non-uniform and with varying spacings between side-by-side bridge piers.
This study aims to employ different pier shapes (rectangular and lenticular) and skew angles α=0°, 30°, 45°, and 60° with specific flow conditions. The manufactured hypothetical piers with Dp=4.5 cm, L=40 cm, and h=50 cm. The pier models have a constant length-to-width ratio of 8.88 and a steady flow depth of Yo=5 cm. According to Melville’s study [13], the pier diameter is carefully selected to avoid the impact of contraction on scour depth (reduce blockage effects, often referred to as sidewall effects) The flume width must be at least ten times the Dp. Experiments were conducted with three (rectangular and lenticular) piers arranged in one row, the piers were positioned at the flume centerline when the flow direction was vertical or angled relative to the pier alignment. Figure 1 shows the pier models for all shapes.
Figure 1. Pier-shape model: (a) lenticular shape and (b) rectangular shape
3.1 Material of bed
The amount of natural sediment can vary greatly, depending on the geology and stream strength of the area. Sediment size is crucial because it affects sediment settling velocity and specific gravity. Particle characteristics influence the scour depth. Cohesionless sediment (i.e., non-uniform Iraqi soil) was used as the bed material for each experiment to achieve the MSD. As shown in Figure 2, a soil-grading test (sieve analysis) was performed by Arneson et al. [22] to determine the types and characteristics of the sand used in this investigation. The bed material specifications are listed in Table 1.
Figure 2. Distribution curves of non-uniform sediments
Table 1. The specification of bed material
|
Parameters |
Value |
|
d50 |
0.873 mm |
|
ρ |
1637 kg/m3 |
|
σg |
2.81 > 1.3 |
The starting velocity of coarse particles in non-uniform materials is less than that of uniform materials with identical particle sizes, and the starting velocity of finer particles in non-uniform materials is higher than that of uniform materials with identical particle sizes, as seen in the study of Xu et al. [23]. Because coarse grains are more likely to be exposed to flow while transporting non-uniform soil, they are easier to entrain than uniform sediment particles of the same particle size.
3.2 Experimental setup and measurement
The tests were conducted at a private hydraulic laboratory in Babylon. The flume was made of a steel frame constructed with glass walls. It is horizontally non-tilting, 8.5 m long, 0.98 m wide, and 0.6 m deep. The work section was 2.1 m long and 0.204 m deep. Located 2.5 m upstream from the flume inlet section, the section has been filled with cohesion-less soil d50=0.873 mm Additionally, water is pumped from the main reservoir tank into an overhead tank located upstream of the flume. A wooden gate suppressor was used in the upstream approach section, and baffles (two screens) were positioned every 50 cm from the flume entrance to smooth the flow (steady continuous flow) into the bed section. A rectangular gate 0.98×0.6 m was supplied at the flume outlet section to make the water depth at the head and end of the flume equal and hence to control the flow velocity. The water utilized from the flume was then discharged into the outlet tank. The pump extracts water from the reservoir at the downstream terminus of the flume and conveys it to the upstream terminus via a 4-inch-diameter pipeline that runs parallel to the flume. Four reservoir tanks exist, one located in the outflow flume with dimensions 1×0.98×0.55 m, separated by a rectangular gate, and three parallel to the flume with a size 1.25×1.25×0.5 m. A centrifugal pump positioned at the end of the downstream of the flume delivered the flow rate via a 3-inch-diameter pipe. An ultrasonic flow meter was employed to quantify the water discharge, and all depths were gauged using a movable point gauge affixed to a brass rail at the upper section of the flume side with an accuracy of - 0.1 mm, as shown in Figure 3.
Figure 3. The experimental flume
3.3 General experiment procedures
3.4 Scour conditions
In the series of tests, fourteen experiments were shown in terms of flow skew-angle $\alpha=0^{\circ}, 30^{\circ}, 45^{\circ}, 60^{\circ}$, the corresponding steady discharge was $12.5 \mathrm{lit} / \mathrm{sec}$, approach velocity, $V$, critical velocity, $V_c$, Armor peak velocity are valid only for $\sigma_g>1.3$ (non-uniform sediments), $V_a$, flow density, $\left(\left[V-\left(V_a-V_c\right)\right]\right) / V_c<1$ for non-uniform sediments, clear water scours conditions are present, maximum scour depth, ds, and Froude number, $F r<1$ (subcritical for all cases), with soil (sand $d_{50}=0.873 \mathrm{~mm}, d_{50 a}=1.267 \mathrm{~mm}$), and approach flow depth $Y_o=0.05 \mathrm{~m}$, pier diameter $\left(\mathrm{D}_{\mathrm{p}}\right)$, and pier spacing $(\mathrm{S})$.
$d_{50 a}=\frac{d \max }{1.8}$
$d_{\max }=$maximum particle size
The critical shear velocities in the armored beds were obtained from Eqs. (1) and (2) [13]:
$\begin{gathered}0.1 \mathrm{~mm}<d_{50 a}<1 \mathrm{~mm} \\ V_{* c a}=0.0115+0.0125 d_{50 a}^{1.4}\end{gathered}$ (1)
$\begin{gathered}1 \mathrm{~mm}<d_{50 a}<100 \mathrm{~mm} \\ V_{* c a}=0.0305 d_{50 a}^{0.5}-0.0065 d_{50 a}^{-1}\end{gathered}$ (2)
The mean critical velocity on the armored bed was:
$\frac{V c}{V * c a}=5.75 \log \left[5.53 \frac{Y o}{d_{50 a}}\right]$ (3)
$V_{* c a}$: mean critical velocity in armored bed.
Finally, $V_a=0.8 V_{c a}$.
$\frac{\left[V-\left(V_a-V_c\right]\right.}{V_f}<1$ (for non-uniform sediment) (4)
Then $Q=V A$.
The impact of non-uniform bed material, pier shape, and pier spacing on the scour development around three side-by-side pier arrangements was studied in the laboratory. The experimental results describe the scour patterns around three (rectangular and lenticular) side-by-side bridge piers arranged in one row of 45 mm width, with the spacing ratio between piers to the width pier (S/Dp=1 and 3). After twenty-four hours of continuous operation, the point of the MSD is situated directly in front of the piers.
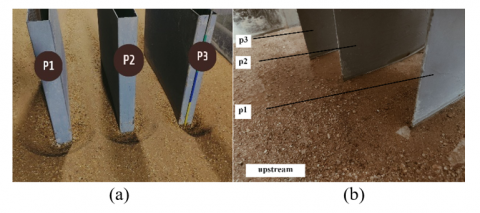
Figure 4 shows the rectangular and lenticular side-by-side bridge pier spacing ratio (S/Dp=1) with three side-by-side piers arranged vertically in the flow direction (α=0°).
Figure 4. Experimental details when (S/Dp=1 and α=0°) for (a) rectangular piers and (b) lenticular piers
Because of the large exposed area for a rectangular shape, the point of the MSD is always directly in front of the piers and extends approximately 2/3 of the piers from the upstream side. The middle pier (P2) had a lower MSD than the side piers, whereas the MSDs at the P1 and P3 bridge piers were almost equal, and each pier had a unique scour hole. The representation of scour depth variation with time shows that scour development stops after only 150 min, as shown in Figure 5.
Figure 5. Scour depth development with time for rectangular piers (α=0° and S/Dp=1)
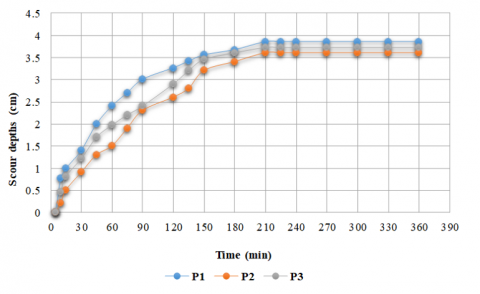
The results of the lenticular experiment show that the scour depth patterns are the same for rectangular shapes when (S/Dp=1), and the piers had a scour-like one-hole approximately.
The representation of the scour depth variation with time ensures that the scour development stops after 210 min, as shown in Figure 6.
Figure 7 shows the rectangular and lenticular side-by-side bridge-pier spacing ratios (S/Dp=3 and α=0°).
Figure 8 shows the time-varying development of scour depth at the scour depth for rectangular and lenticular shapes. For each pier shape, the scour depth initially grew, attaining a maximum value, and subsequently approached observations indicate that approximately 75% of the maximum scour depth had been achieved within the initial three hours of the experiment.
Figure 6. Scour depth development over time for lenticular piers (α=0° and S/Dp=1)
Figure 7. Experimental details when (S/Dp=3 and α=0°) for (a) rectangular piers and (b) lenticular piers
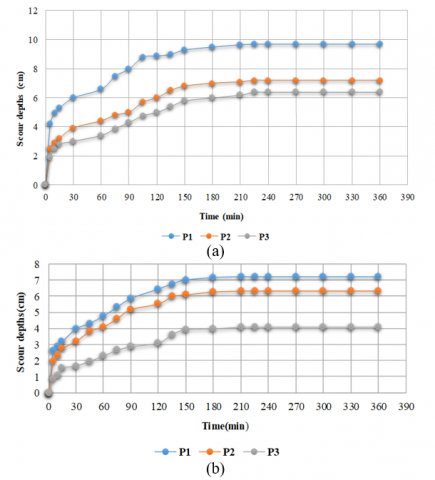
Figure 8. Scour depth variation with time when (α=0° and S/Dp=3) for (a) rectangular and (b) lenticular piers
The results show the same scour depth pattern of (S/Dp=1). The scour depth when (S/Dp=1) is large compared to (S/Dp=3), which means that when S/Dp decreases, the scour depths increase owing to the blockage resulting from sediments between the side-by-side bridge piers, which causes difficulty in transporting the sediments; therefore, the side-by-side bridge piers act as one pier, which means an increase in the exposed area that intercepts the flow, which results in a greater scour depth, and the scour is like a hole.
The geometry of the lenticular piers significantly reduces the formation of a horseshoe, wake vortices are generated, and subsequently minimizes the scour depth, which may be the reason why lenticular piers performed better in terms of scour depth than rectangular piers [24].
Figure 9 shows the effects of the skewness angles (30°, 45°, and 60°) on the rectangular and lenticular side-by-side bridge pier spacing ratios (S/Dp=1).
Figure 9. The experiment details the rectangular and lenticular shapes for (a) when S/Dp=1, and α=30° (b) when S/Dp=1, and α=45° (c) when S/Dp=1, and α=60°
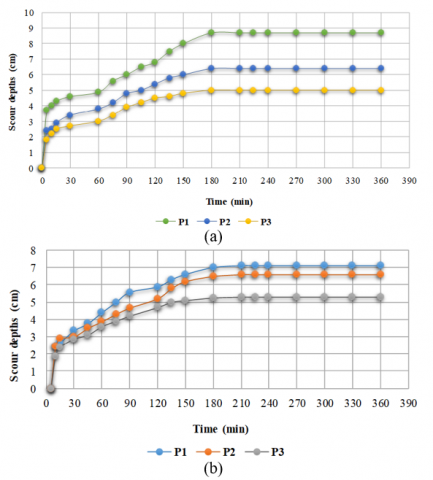
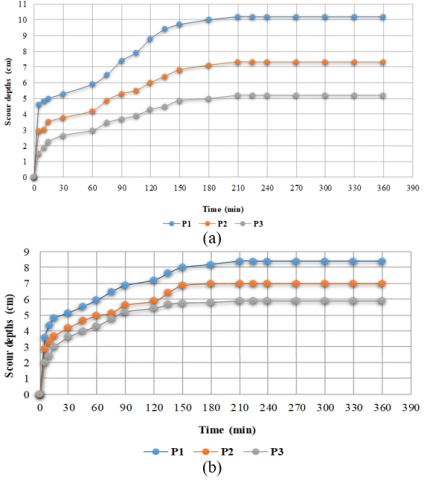
The maximum scour depth for (30°, 45°, and 60°) was found near the flume wall in the P1, P2, and P3 corners, respectively, owing to the short distance between P1 and the sidewall of the flume, and the piers had a roughly scour-like one-hole. The maximum scour depths were found along the entire upstream region from the P1 side. The time-varying development of scour depth at the position of scour depth for rectangular and lenticular shapes. For skew angles of 30°, 45°, and 60° for each pier shape, approximately 95% of the maximum scour depth was achieved within 180 min. As shown in Figures 10-12.
Figure 10. Scour depth development with time when α=30° and S/Dp=1 for (a) rectangular and (b) lenticular piers
Figure 11. Scour depth development with time when α=45° and S/Dp=1 for (a) rectangular and (b) lenticular piers
Figure 12. Scour depth development with time when α=60° and S/Dp=1 for (a) rectangular and (b) lenticular piers
The data obtained, shown in Figure 13, indicate that the scour depth increases when (α) increases from 0° to 30°. For the same S/Dp ratio, the scour depth decreased from 30° to 60°. Figure 13 compares MSD and (α) when S/Dp=1.
Figure 13. Comparison between MSD and skewness angle when S/Dp=1 for (a) rectangular piers and (b) lenticular piers
Figure 14 shows the effects of the skewness angles 30°and 45° when the pier spacing ratio S/Dp=3 was used.
MSD is located in the P1, P2, and P3 corners near the flume wall; however, it has a smaller MSD from S/Dp=1, and each pier has its own scour hole approximately, and MSD occurs along the whole upstream from the side of P1. The time-varying development of scour depth at the position of scour depth for rectangular and lenticular shapes. For skew angles of 30° and 45° with S/Dp=3 for each pier shape, the equilibrium scour depth was reached at 180 min, as shown in Figures 15 and 16.
Figure 14. The experiment details the rectangular and lenticular shapes for (a) when S/Dp=3, and α=30° (b) when S/Dp=3, and α=45°
Figure 15. Scour depth development with time when α=30° and S/Dp=3 for (a) rectangular and (b) lenticular piers
Figure 16. Scour depth development with time when α=45° and S/Dp=3 for (a) rectangular and (b) lenticular piers
α=45° shows the opposite for α=0°, and 30°, where the scour depth is greater when (S/Dp=3) than (S/Dp=1), when α=45°, the flow fails to move the sediment between the piers due to the more skewness, resulting in a blockage, the exposed area to the flow when S/Dp=3 is greater than S/Dp=1, and the spacing between the pier and sidewall is smaller when S/Dp=3 than S/Dp=1, and (α=60°) shows the same pattern.
However, the experiment could not be carried out for a skew angle of 60° when (S/Dp=3) because it did not meet the criteria owing to the spacing between the pier and sidewall (referred to as sidewall effects), as shown in Figure 17.
Figure 17. Spacing ratio for rectangular side-by-side bridge piers when S/Dp=3 and α=60°
The data showed that the rectangular piers experienced the greatest scour depth (10.6, 8.8, 6.5) cm for P1, P2, and P3, respectively, at (α=30° and S/Dp=1). Numerous earlier studies have produced comparable findings [25].
Table 2 shows that the lenticular pier was the most resistant to local scour. All the investigated parameters had a considerable impact on the scour depth, according to the obtained data. It has also been discovered that by using lenticular piers and maintaining the flow intensity, the scour depth can be reduced. In summary, the results showed that each parameter under study had a considerable impact on scour depth.
Table 2. A summary of the series of experimental data
| Run | Pier-Shape | α° | Q (l/s) | Yo (m) | S/Dp | V (m/s) | Vc (m/s) | Va |
$\frac{\left(\left[V-\left(V_a-V_c\right)\right]\right)}{V_c}$ |
Max. Scour Depth | Fr | ||
| (cm) | |||||||||||||
| P1 | P2 | P3 | |||||||||||
| 1 | Rectangular | 0° | 12.5 | 0.05 | 1 | 0.258 | 0.392 | 0.314 | 0.85 | 5.4 | 4.1 | 5.2 | 0.364 |
| 2 | Rectangular | 0° | 12.5 | 0.05 | 3 | 0.258 | 0.392 | 0.314 | 0.85 | 4.4 | 3.7 | 4.2 | 0.364 |
| 3 | Rectangular | 30° | 12.5 | 0.05 | 1 | 0.258 | 0.392 | 0.314 | 0.85 | 10.6 | 8.8 | 6.5 | 0.364 |
| 4 | Rectangular | 30° | 12.5 | 0.05 | 3 | 0.258 | 0.392 | 0.314 | 0.85 | 8.7 | 6.4 | 5 | 0.364 |
| 5 | Rectangular | 45° | 12.5 | 0.05 | 1 | 0.258 | 0.392 | 0.314 | 0.85 | 7.4 | 5.8 | 4.4 | 0.364 |
| 6 | Rectangular | 45° | 12.5 | 0.05 | 3 | 0.258 | 0.392 | 0.314 | 0.85 | 10.2 | 7.3 | 5.2 | 0.364 |
| 7 | Rectangular | 60° | 12.5 | 0.05 | 1 | 0.258 | 0.392 | 0.314 | 0.85 | 9.7 | 7.2 | 6.4 | 0.364 |
| 8 | Lenticular | 0° | 12.5 | 0.05 | 1 | 0.258 | 0.392 | 0.314 | 0.85 | 3.85 | 3.6 | 3.72 | 0.364 |
| 9 | Lenticular | 0° | 12.5 | 0.05 | 3 | 0.258 | 0.392 | 0.314 | 0.85 | 1.6 | 1.4 | 1.55 | 0.364 |
| 10 | Lenticular | 30° | 12.5 | 0.05 | 1 | 0.258 | 0.392 | 0.314 | 0.85 | 8.87 | 8.3 | 7.2 | 0.364 |
| 11 | Lenticular | 30° | 12.5 | 0.05 | 3 | 0.258 | 0.392 | 0.314 | 0.85 | 7.1 | 6.6 | 5.3 | 0.364 |
| 12 | Lenticular | 45° | 12.5 | 0.05 | 1 | 0.258 | 0.392 | 0.314 | 0.85 | 6.5 | 5.66 | 3.9 | 0.364 |
| 13 | Lenticular | 45° | 12.5 | 0.05 | 3 | 0.258 | 0.392 | 0.314 | 0.85 | 8.4 | 7 | 5.9 | 0.364 |
| 14 | Lenticular | 60° | 12.5 | 0.05 | 1 | 0.258 | 0.392 | 0.314 | 0.85 | 7.2 | 6.35 | 4.1 | 0.364 |
Fourteen experiments were conducted to investigate the local scour pattern in a horizontal open channel under clear water flow conditions utilizing different shapes, skew angles, and spacing between piers around three side-by-side rectangular and lenticular bridge piers.
| α | Pier alignment angle (Skew angle) | |
| d50 | Mean particle size | |
| d50a | Armor peak mean particle size | |
| Dp | Pier diameter | |
| ds | Scour depth | |
| Fr | Froude number | |
| h | Pier height | |
| L | Pier length | |
| Q | Flow discharge | |
| S | Pier spacing | |
| V | Mean flow velocity | |
| Va | Armor peak velocity | |
| Vc | Critical velocity | |
| Yo | Approach flow depth | |
|
$\rho$ |
Density | |
|
$\sigma_{\mathrm{g}}$ |
Geometric standard deviation | |
[1] Vijayasree, B.A., Eldho, T.I., Mazumder, B.S., Ahmad, N. (2019). Influence of bridge pier shape on flow field and scour geometry. International Journal of River Basin Management, 17(1): 109-129. https://doi.org/10.1080/15715124.2017.1394315
[2] Salamatian, S.A., Zarrati, A.R. (2021). Reliability study on uncertainty parameters and flood duration on scouring around unprotected and protected bridge piers. ISH Journal of Hydraulic Engineering, 27(sup1): 11-19. https://doi.org/10.1080/09715010.2019.1570360
[3] Zarrati, A.R., Nazariha, M., Mashahir, M.B. (2006). Reduction of local scour in the vicinity of bridge pier groups using collars and riprap. Journal of Hydraulic Engineering, 132(2): 154-162. https://doi.org/10.1061/(ASCE)0733-9429(2006)132:2(154)
[4] Singh, U.K., Ahmad, Z., Kumar, A. (2017). Turbulence characteristics of flow over the degraded cohesive bed of clay–silt–sand mixture. ISH Journal of Hydraulic Engineering, 23(3): 308-318. https://doi.org/10.1080/09715010.2017.1313144
[5] Pandey, M., Ahmad, Z., Sharma, P.K. (2015). Flow-characteristics around circular pier model. Proceedings of the HYDRO, p. 15.
[6] Melville, B.W. (1997). Pier and abutment scour: Integrated approach. Journal of hydraulic Engineering, 123(2): 125-136. https://doi.org/10.1061/(ASCE)0733-9429(1997)123:2(125)
[7] Melville, B.W. (1984). Live-bed scour at bridge piers. Journal of Hydraulic Engineering, 110(9): 1234-1247. https://doi.org/10.1061/(ASCE)0733-9429(1984)110:9(1234)
[8] Dargahi, B. (1990). Controlling mechanism of local scouring. Journal of Hydraulic Engineering, 116(10): 1197-1214. https://doi.org/10.1061/(ASCE)0733-9429(1990)116:10(1197)
[9] Yanmaz, A.M., Ustun, I. (2001). Generalized reliability model for local scour around bridge piers of various shapes. Turkish Journal of Engineering and Environmental Sciences, 25(6): 687-698.
[10] Zarrati, A.R., Gholami, H., Mashahir, M.B. (2004). Application of collar to control scouring around rectangular bridge piers. Journal of Hydraulic Research, 42(1): 97-103. https://doi.org/10.1080/00221686.2004.9641188
[11] Fael, C., Lança, R., Cardoso, A. (2016). Effect of pier shape and pier alignment on the equilibrium scour depth at single piers. International Journal of Sediment Research, 31(3): 244-250. https://doi.org/10.1016/j.ijsrc.2016.04.001
[12] Lee, C.H., Xu, C., Huang, Z. (2019). A three-phase flow simulation of local scour caused by a submerged wall jet with a water-air interface. Advances in Water Resources, 129: 373-384. https://doi.org/10.1016/j.advwatres.2017.07.017
[13] Melville, B.W. (2000). Bridge Scour. Water Resources Publications, Highlands Ranch, USA.
[14] Namaee, M.R., Sui, J. (2020). Velocity profiles and turbulence intensities around side-by-side bridge piers under ice-covered flow condition. Journal of Hydrology and Hydromechanics, 68(1): 70-82. https://doi.org/10.2478/johh-2019-0029
[15] Karimaee, T.M., Zarrati, A.R. (2012). Effect of collar on time development and extent of scour hole around cylandrical bridge piers. International Journal of Engineering, 25(1(C)): 11-17. https://doi.org/10.5829/idosi.ije.2012.25.01c.02
[16] Mao, L., Cooper, J.R., Frostick, L.E. (2011). Grain size and topographical differences between static and mobile armour layers. Earth Surface Processes and Landforms, 36(10): 1321-1334. https://doi.org/10.1002/esp.2156
[17] Yang, Y., Melville, B.W., Macky, G.H., Shamseldin, A.Y. (2020). Temporal evolution of clear-water local scour at aligned and skewed complex bridge piers. Journal of Hydraulic Engineering, 146(4): 04020026. https://doi.org/10.1061/(ASCE)HY.1943-7900.0001732
[18] Hashim, K.S., Ali, S.S.M., AlRifaie, J.K., Kot, P., Shaw, A., Al Khaddar, R., Idowu, I., Gkantou, M. (2020). Escherichia coli inactivation using a hybrid ultrasonic—Electrocoagulation reactor. Chemosphere, 247: 125868. https://doi.org/10.1016/j.chemosphere.2020.125868
[19] Zanki, A.K., Mohammad, F.H., Hashim, K.S., Muradov, M., Kot, P., Kareem, M.M., Abdulhadi, B. (2020). Removal of organic matter from water using ultrasonic-assisted electrocoagulation method. IOP Conference Series: Materials Science and Engineering, 888(1): 012033. https://doi.org/10.1088/1757-899X/888/1/012033
[20] Alhendal, M., Nasir, M.J., Hashim, K.S., Amoako-Attah, J., Al-Faluji, D., Muradov, M., Kot, P., Abdulhadi, B. (2020). Cost-effective hybrid filter for remediation of water from fluoride. IOP Conference Series: Materials Science and Engineering, 888(1): 012038. https://doi.org/10.1088/1757-899X/888/1/012038
[21] Hashim, K.S., Adeola Idowu, I., Jasim, N., Al Khaddar, R., Shaw, A., Phipps, D., Kot, P., Ortoneda Pedrola, M., Alattabi, A.W., Abdulredha, M., Alwash, R., Teng, K.H., Joshi, K.H., Hashim Aljefery, M. (2018). Removal of phosphate from river water using a new baffle plates electrochemical reactor. MethodsX, 5: 1413-1418. https://doi.org/10.1016/j.mex.2018.10.024
[22] Arneson, L.A., Zevenbergen, L.W., Lagasse, P.F., Clopper, P.E. (2012). Hydraulic engineering circular No. 18: Evaluating scour at bridges. US Department of Transportation.
[23] Xu, H.T., Lu, J.Y., Liu, X.B. (2008). Non-uniform sediment incipient velocity. International Journal of Sediment Research, 23(1): 69-75. https://doi.org/10.1016/S1001-6279(08)60006-2
[24] Helmy, A., Ali, M., Ahmed, H. (2017). An experimental study of local scour around piers in the curved channels. Journal of Multidisciplinary Engineering Science and Technology, 4(1): 6448-6453. https://www.jmest.org/wp-content/uploads/JMESTN42351988.pdf.
[25] Al-Shukur, A.H.K., Hussein, N.S. (2021). Effects of shape and skew-angle of bridge piers on local scour. Journal of Engineering Science and Technology, 16(3): 2748-2762.
[26] Ahmad, N., Melville, B., Mohammad, T., Ali, F., Yusuf, B. (2017). Clear-water scour at long skewed bridge piers. Journal of the Chinese Institute of Engineers, 40(1): 10-18. https://doi.org/10.1080/02533839.2016.1259021
[27] Namaee, M.R., Sui, J., Wu, P. (2019). Experimental study of local scour around side-by-side bridge piers under ice-covered flow conditions. Current Practice in Fluvial Geomorphology-Dynamics and Diversity. IntechOpen. https://doi.org/10.5772/intechopen.86369