Mathematical Modeling of Ecological Associations and Spatial Distribution of Nepenthes Tobaica in Ria-Ria Village, North Sumatra: Implications for Conservation and Management

Esther Sorta Mauli Nababan* | Ridahati Rambey | Rahmawaty | Mohd Nazip Suratman | Abdul Rauf | Mohd Hasmadi Ismail | Muhammad Romi Syahputra | Erwin | Muhammad Hadi Saputra
© 2025 The authors. This article is published by IIETA and is licensed under the CC BY 4.0 license (http://creativecommons.org/licenses/by/4.0/).
OPEN ACCESS
Nepenthes tobaica (N. tobaica) is a unique carnivorous plant with distinctive shapes, sizes, and color patterns. Sumatra is a global center for Nepenthes diversity. This study analyzes the population structure and plant associations of N. tobaica in Ria-Ria Village Forest, Humbang Hasundutan. Using purposive sampling with 20×20m plots, 36 vegetation species were identified. The highest Importance Value Index (IVI) was recorded for Laplacean sp. (91.23) at location 1, Macadamia integrifolia (151.03) at location 2, and Pinus merkusii (13099.68) at location 3. Positive associations were found between N. tobaica and Laplacean sp. (1.34) at location 1, Pteridium aquilinum (0.78) at location 2, and Pinus merkusii (96.33) at location 3. Zone 1 had the highest diversity, richness, and evenness indices, indicating favorable environmental conditions. These findings highlight key species influencing N. tobaica habitat suitability. Understanding these associations aids in habitat management and restoration, where indicator species can be used for conservation planning. The integration of mathematical models in this study provides a quantitative foundation for ecosystem assessments and future conservation strategies for N. tobaica.
nepenthes tobaica, association, mathematical model, biodiversity, ecological balance
Indonesia is one of the world's richest biodiversity hotspots, with at least 47 distinct natural ecosystems teeming with plant and animal life, including numerous endemic species [1, 2]. Among these, Nepenthes, a genus of carnivorous plants, is particularly notable. Indonesia harbors approximately 15.5% of the world's flora, and its archipelago, especially Kalimantan and Sumatra, represents the global center of Nepenthes diversity [3, 4].
Nepenthes tobaica, an endemic species in Sumatra, is adapted to various ecological niches, often found in nutrient-poor environments where it relies on carnivory for nutrient acquisition [5, 6]. Despite its ecological significance, nepenthes tobaica faces increasing threats due to habitat fragmentation, land-use change, and environmental degradation, which have led to population declines [7]. Conservation efforts for this species are hindered by limited quantitative studies on its ecological interactions and habitat preferences, particularly in terms of its associations with other plant species and how these relationships influence its distribution and survival [8, 9].
While previous studies have primarily focused on the taxonomy, morphology, and habitat characteristics of Nepenthes, there is a lack of research that quantitatively analyzes the ecological relationships of nepenthes tobaica within its plant community. Understanding these associations is crucial for conservation strategies, as plant species interactions can influence habitat stability, species resilience, and potential reintroduction efforts. This study advances the understanding of nepenthes tobaica ecology by integrating mathematical models and ecological indices to quantify species associations and distribution patterns. The application of quantitative methods in studying Nepenthes ecology remains underexplored, making this approach novel in several ways. Unlike traditional qualitative descriptions, this study employs mathematical models to measure species diversity, distribution, and association. The use of the Ochiai index allows for precise determination of association strength between nepenthes tobaica and coexisting species. By identifying key species interactions and environmental conditions supporting nepenthes tobaica, this study provides actionable data for habitat conservation and management [10, 11].
To address these gaps, this study aims to analyze the population structure of nepenthes tobaica in the Ria-Ria Village Forest, Pollung District, Humbang Hasundutan Regency and quantify its ecological associations with other plant species using mathematical models and ecological indices. The study employs a robust quantitative framework, incorporating vegetation analysis metrics such as density, relative density, frequency, relative frequency, dominance, and the Importance Value Index (IVI) [12, 13]. The Ochiai index is used to measure species co-occurrence, while several diversity indices, including the Shannon-Wiener diversity index (H’), Margalef’s species richness index, species evenness index, and Morisita’s index, are applied to assess species diversity and spatial distribution. Additionally, the Basal Field Area (BFA) formula is used to quantify tree stem coverage.
By integrating these mathematical models, this research establishes a reproducible, quantitative foundation for ecological studies on nepenthes tobaica. The findings will not only enhance conservation strategies but also serve as a reference for future ecological research on Nepenthes and other carnivorous plant species.
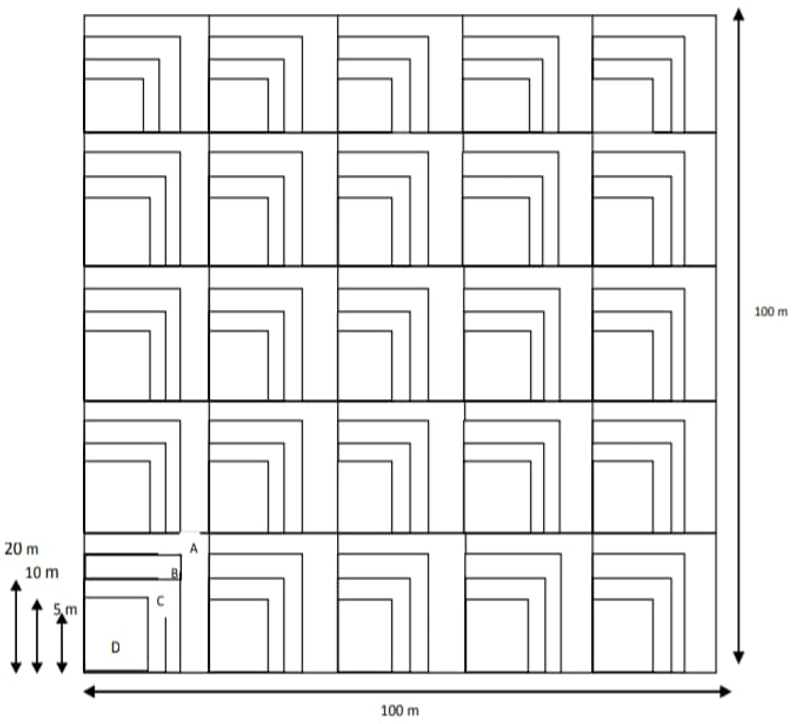
This research was conducted in Ria-Ria Village Forest, Pollung District, Humbang Hasundutan Regency. The method used to determine habitat conditions and their associations uses a purposive sampling method by making plots measuring 20×20 meters. Tree level vegetation in measuring plots 20×20m, pole level in measuring plots 10×10m, sapling level in measuring plots 5×5m, seedling level and lower plants are counted in measuring plots 2×2m. The nested plot shown in Figure 1 was designed to analyze the vegetation present in the study area.
Figure 1. Shape of nested plot
Data Analysis
Density $=\frac{\text { the number of individuals of a species }}{\text { Area of sample unit }}$
Relative Density (RD) $=\frac{\text { Density of the species }}{\text { Density of Total Spesies }} \times 100 \%$
Frequency $=\frac{\text { Number of Plots Found of a Species }}{\text { Total Number of Plot }}$
Relative Frequency $(\mathrm{RF})=\frac{\text { Frequency of a Type }}{\text { Total Frequency }} \times 100 \%$
Domination $=\frac{\text { Base Field Area of a Species }}{\text { Area of sample unit }}$
$\begin{aligned} & \text { Relative Domination }(\mathrm{RDO})=\frac{\text { Dominance o a a pecies }}{\text { Dominance of the entire plot }} \times 100 \%\end{aligned}$
$\mathrm{BFA}=\frac{\pi * R^2}{\sum { all~sample~sub }- \text { plots }}$
where, R is the radius of the circle of the stem diameter; D is DBH. The BFA obtained is then converted m2.
For both pole and tree level: $I V I=R D+R F+R D O$
For seedling and sapling levels: $I V I=R D+R F$
Vegetation in non-nepenthes and nepenthes plots can be calculated using the Similarity Index [14].
$\frac{2 C}{A+B}$
$H^{\prime}=\sum_{I=1}^N\left[\frac{N i}{N} {In} \frac{N i}{N}\right]$
H’=Σpi in pi
Pi=$\frac{\mathrm{Ni}}{\mathrm{N}}$
where,
H’=Shannon-Wiener diversity
Ni=number of individuals of the nth species
N=total number of individuals
The value of H 'is as follows:
H’<1=low level of species diversity
H’1-3=moderate level of species diversity
H’>3=high level of species diversity [15, 16]
Vegetation species richness was determined by using the richness index [14].
$R=\frac{S-1}{{In}(N)}$
where,
R=Index of species richness
S=Number of species
N=Total number of individuals
$E=\frac{H^{\prime}}{{In}(S)}$
where,
E=Index of species evenness
H’=Index of species diversity
S=number of species
Analysis of nepenthes distribution patterns using the standardized Morisita index [17].
The index is calculated with the equation:
$I_D=\left[\frac{\sum X^2-\sum X}{\left(\sum\right) x^2-\sum X}\right]$
where,
$I_D$=Morisita's dispersion index
N=The number of plots
X=The number of individuals found on each plot
The analysis of N. tobaica's spatial distribution using the Morisita index provides insights into the species' ecology. Understanding these patterns is crucial for predicting the species' response to environmental changes and for designing effective conservation strategies.
Association determined using Ochiai index [14].
(a) Ochiai Index (OI)$=\frac{A}{\sqrt{A=b \sqrt{A+c}}}$
where,
A=Number of plots where both associated species (A and B) were found
B=Number of plots where type A but not type B was found
C=Number of plots where type B was found but not type A
The association value occurs in the interval 0 to 1. The closeness of association relationship from the association index interval is shown in Table 1.
Table 1. Association on vegetation (association index)
|
No. |
Association Index |
Remark |
|
1 |
1.00-0.75 |
Very High (ST) |
|
2 |
0.74-0.49 |
High (T) |
|
3 |
0.48-0.23 |
Low (R) |
|
4 |
≤0.23 |
Very Low (SR) |
Identification of Plant Species in the Habitat of Toba Semar Bag (Nepenthes Tobaica) in Ria-Ria Village
Based on the results of the research that has been carried out, 21 species of lower plant level vegetation were found in location 1, 13 species in location 2 and 8 species of lower plant level vegetation in location 3 around the habitat of the toba semar bag (nepenthes tobaica) in Ria-Ria Village, Pollung District, Humbang Hasundutan Regency. The growth of these vegetation in the village in all three locations is very good and is still very much found, indicating that the environment at the research site still supports the sustainability of the species. However, for this level of growth, eradication or burning is often carried out because the local community is dominant in their livelihoods as farmers. The lower plant level vegetation found in the three research locations in detail can be seen in Table 2.
Table 2. Undergrowth plant community around nepenthes tobaica in Ria-Ria Village, Pollung District, Humbang Hasundutan Regency
|
Local Name |
Latin Name |
Family |
Loc-1 |
Loc-2 |
Loc-3 |
|
Andaliman |
Zanthoxylum acanthopodium |
Rutaceae |
- |
+ |
- |
|
Adulpak |
Homalanthus populneus |
Euphorbiaceae |
+ |
- |
- |
|
Andor Andor |
Jasminum pubescens |
Oleaceae |
+ |
+ |
- |
|
Appapaga |
Centella asiatica |
Mackinlayaceae |
+ |
- |
- |
|
Arsam |
Pteridium aquilinum |
Dennstaedtiaceaae |
+ |
+ |
- |
|
Attalobung |
Pennisetum purpereum |
Poaceae |
+ |
- |
- |
|
Bunga Paet |
Eupatorium perfoliatum |
Asteraseae |
+ |
- |
- |
|
Bunga Pansur |
Russelia equisetiformis |
Balsaminaceae |
+ |
- |
- |
|
Hail Hail |
Elaeagnus trifloral roxb |
Elaeagnaceae |
+ |
- |
- |
|
Hari Moting |
Clidemia hirta |
Melastomaceae |
+ |
+ |
- |
|
Haure |
- |
- |
- |
- |
- |
|
Holpu Holpu |
Arundina graminifolia |
Orchidaceae |
+ |
+ |
- |
|
Ilalang |
Imperata cylindrica |
Poaceae |
+ |
+ |
+ |
|
Karamunting |
Rhodomyrtus tomentosa |
Myrtaceae |
- |
- |
+ |
|
Keladi |
Caladium sp. |
Araceae |
+ |
+ |
- |
|
Markisa Siuh |
Passiflora edulis |
Passifloraceae |
- |
+ |
- |
|
Pagit-Pagit |
|
|
- |
- |
+ |
|
Pakis |
Diplazium esculentum |
Athyriaceae |
+ |
+ |
- |
|
Pakis Keras |
Struthiopteris spicant |
Blechnaceae |
- |
- |
+ |
|
Pakis Bunga Danau |
Polypodiophyta sp. |
Polypodiaceae |
- |
- |
+ |
|
Pengusir Tikus |
|
|
- |
- |
+ |
|
Petiper |
|
|
- |
- |
+ |
|
Podom Podom |
Mimosa pudica |
Fabaceae |
+ |
- |
- |
|
Resam |
Dicranopteris sp. |
Gleicheniaceae |
- |
+ |
- |
|
Ria Ria |
Carex sp. |
Poaceae |
+ |
- |
- |
|
Rumput Manis |
Hierochloe odorata |
Poaceae |
+ |
+ |
- |
|
Sae Sae |
Gaultheria leucocarpa |
Ericaceae |
+ |
+ |
- |
|
Sijukkot |
Lactuca indica |
Asteraceae |
- |
+ |
- |
|
Simarbadak Badak |
Platycerium Bifurcatum |
Polypodiaceae |
+ |
- |
- |
|
Sanggar |
Themeda gigantea |
Poaceae |
+ |
- |
- |
|
Sapilpil |
Cyperus rotundus |
Cyperaceae |
+ |
- |
- |
|
Sanduduk |
Melastoma melabathricum |
Melastomataceae |
+ |
- |
+ |
At the tree growth level, 10 tree species were found in Site 1, 4 tree species in Site 2, and 1 tree species in Site 3 that grew around the habitat of the toba semar bag (nepenthes tobaica) in Ria-Ria Village, Pollung District, Humbang Hasundutan Regency. These species grow well in the research location and coexist with the toba semar bag (nepenthes tobaica). The vegetation at the tree level found in detail can be seen in Table 3.
Table 3. Tree community around nepenthes tobaica in Ria-Ria Village, Pollung District, Humbang Hasundutan Regency
|
Local Name |
Latin Name |
Family |
Loc-1 |
Loc-2 |
Loc-3 |
|
Alpukat |
Persea americana |
Lauraceae |
- |
+ |
- |
|
Api api |
Laplacean sp. |
Acanthaceae |
+ |
- |
- |
|
Bane |
Basillicum polystachyon |
Verbenaceae |
+ |
- |
- |
|
Bintatar |
Celtis tetrandra |
Cannabaceae |
+ |
- |
- |
|
Hapas |
Exbulandia populnea |
Malvaceae |
+ |
- |
- |
|
Haumbang |
Morinda tinctoria roxb |
Rubiaceae |
+ |
- |
- |
|
Ingus ingus |
Macaranga gigantea |
Euphorbiaceae |
+ |
- |
- |
|
Kaliandra merah |
Calliandra calothyrsus |
Fabaceae |
- |
+ |
- |
|
Mabar |
- |
- |
+ |
- |
- |
|
Makadamia |
Macadamia integrifolia |
Proteaceae |
- |
+ |
- |
|
Pinus |
Pinus merkusii |
Pinaceae |
+ |
+ |
+ |
|
Simartolu |
Schima wallichii |
Theaceae |
+ |
- |
- |
|
Suhul suhul |
Macaranga gigantea |
Euphorbiaceae |
+ |
- |
- |
Vegetation found around nepenthes tobaica habitat, both at the understorey and tree level, plays an important role in supporting the survival of this species. Understory plants such as Arsam (Pteridium aquilinum) and Appapaga (Centella asiatica) can help maintain soil moisture in nepenthes tobaica habitats. This is important considering that the pouch plant needs a moist environment to grow optimally. On the other hand, trees such as Pinus (Pinus merkusii) and Simartolu (Schima wallichii) provide shade that protects the pouch semar from direct sunlight, while creating a microclimate that supports its growth [18-20].
Environmental factors are factors that greatly affect the growth of toba semar bags (nepenthes tobaica) in a habitat. In this study, toba semar pouches (nepenthes tobaica) were found in 3 locations with altitude variations between 1443.6 to 1528 meters above sea level. The temperature at the research site ranged from 20.98℃ to 22.16℃ with humidity ranging from 50% to 86%. Temperature and humidity conditions in this location are within the normal range of Nepenthes growth. Nainggolan et al. [6] stated that this plant can survive in air temperature and air humidity of 20-32℃ and 67-93% respectively. Light intensity at the sites ranged from 188 to 197 lux, the soil type at the three sites had a clay texture, which could affect drainage. Nepenthes generally grows on nutrient-poor soils but with high moisture [16]. The extreme slope level (46.63-62.15%) indicates that this habitat is located in a steep area, which is in accordance with the ecological characteristics of Nepenthes in the wild, especially on cliffs and mountains. All sites were in agroforestry areas, which provided partial shading benefits while minimizing habitat disturbance. The environmental factors in which the toba antlered pouch (nepenthes tobaica) was found can be seen in detail in Table 4.
Table 4. Environmental factors of the Toba Semar Pockets Habitat (nepenthes tobaica)
|
Sites |
Location 1 Ria-Ria |
Location 2 Ria-Ria |
Location 3 Ria-Ria |
|
Altitude (mdsl) |
1468.8 |
1528.0 |
1443.6 |
|
Lux |
197 |
188 |
|
|
T (°C) |
22.16 |
20.98 |
21.33 |
|
RH (%) |
86.00 |
78.00 |
50.00 |
|
Soil texture |
Clay |
Clay |
|
|
Slope (%) |
46.63 |
62.15 |
|
|
Slope category |
Extreme slopes |
Extreme slopes |
|
|
Land use |
Agroforestry |
Agroforestry |
Agroforestry |
Vegetation Analysis and Association of Nepenthes Tobaica at Understory, Seedling, Sapling, Pole, and tree Levels
The results of vegetation analysis show that the vegetation composition at the research site consists of 36 species. The many types of species found at the research site indicate that the research site still has a balanced ecosystem, so it still has quite abundant diversity. The results of vegetation analysis and associations with the highest IVI value in the plant community around the habitat in Ria-Ria Village in detail can be seen in Table 5.
Table 5. IVI and association of nepenthes tobaica in plant communities surrounding habitat in Ria-Ria Village, Humbang Hasundutan Regency, North Sumatra, Indonesia
|
Scientific Name |
Family |
IVI |
OI |
Association Category |
Association |
|
Location-1 Undergrowth |
|||||
|
Pteridium aquilinum |
Dennstaedtiaceaae |
63.95 |
0.96 |
S |
+ |
|
Nepenthes tobaica |
Nepenthaceae |
18.93 |
0.21 |
NS |
+ |
|
Gaultheria leucocarpa |
Poaceae |
15.25 |
0.51 |
NS |
+ |
|
Themeda gigantea |
Polypodiaceae |
22.26 |
0.21 |
NS |
+ |
|
Cyperus rotundus |
Cyperaceae |
43.9 |
0.86 |
NS |
- |
|
Location-2 |
|
|
|
|
|
|
Nepenthes tobaica |
Nepenthaceae |
22 |
0.62 |
S |
+ |
|
Dicranopteris sp. |
Gleicheniaceae |
74.65 |
0.61 |
NS |
+ |
|
Imperata cylindrica |
Poaceae |
17.07 |
0.47 |
NS |
+ |
|
Melastoma melabathricum |
Melastomataceae |
11.85 |
0 |
S |
+ |
|
Pteridium aquilinum |
Dennstaedtiaceaae |
20.6 |
0.78 |
S |
+ |
|
Location-3 |
|
|
|
|
|
|
Nepenthes tobaica |
Nepenthaceae |
162.65 |
|||
|
Melastoma melabathricum |
Melastomaceae |
35.78 |
0.5 |
NS |
+ |
|
Pagit-Pagit |
17.89 |
0.35 |
NS |
+ |
|
|
Imperata cylindrica |
Poaceae |
134.84 |
0.54 |
NS |
+ |
|
Struthiopteris spicant |
Blechnaceae |
216.84 |
0.84 |
NS |
+ |
|
Location-1 Seedling |
|||||
|
Avicennia germinans |
Acanthaceae |
58.23 |
0.67 |
NS |
+ |
|
Basillicum polystachyon |
Verbenaceae |
20.42 |
0.43 |
NS |
+ |
|
Macaranga gigantea |
Euphorbiaceae |
33.04 |
0.15 |
NS |
- |
|
- |
- |
18.5 |
0.15 |
NS |
- |
|
Saurauia blumeana Spreng |
Gigantea blume |
46.04 |
0.15 |
NS |
- |
|
Location-2 |
|
|
|
|
|
|
Pinus merkusii |
Pinaceae |
98.1 |
0.29 |
NS |
+ |
|
Macadamia integrifolia |
Proteaceae |
151.03 |
0.12 |
NS |
- |
|
Calliandra calothyrsus |
Fabaceae |
30.2 |
0 |
NS |
- |
|
Persea americana |
Lauraceae |
20.67 |
0 |
NS |
+ |
|
Location-3 |
|
|
|
|
|
|
Saurauia blumeana Spreng |
Actinidiaceae |
128.28 |
0.35 |
NS |
+ |
|
Schima wallichii |
Theaceae |
36.67 |
0.46 |
NS |
+ |
|
Silum |
49.6 |
0.62 |
NS |
- |
|
|
Location-1 Stakes |
|||||
|
Avicennia germinans |
Acanthaceae |
61.24 |
0.75 |
NS |
- |
|
Celtis tetrandra |
Cannabaceae |
20.69 |
0.38 |
NS |
- |
|
Morinda tinctoria roxb |
Rubiaceae |
22.01 |
0.43 |
NS |
+ |
|
Syzygium myrtifolium |
Myrtaceae |
19.69 |
0.37 |
NS |
+ |
|
Leptospermum javanicum |
Myrtaceae |
19.63 |
0.53 |
NS |
- |
|
Location-2 |
|
|
|
|
|
|
Macadamia integrifolia |
Proteaceae |
37.57 |
0.08 |
NS |
- |
|
Homalanthus populneus |
Euphorbiaceae |
8.47 |
0 |
NS |
+ |
|
- |
- |
14.02 |
0.08 |
NS |
+ |
|
Leptospermum javanicum |
Myrtaceae |
103.17 |
0.82 |
NS |
+ |
|
Neonauclea calycina. |
Rubiaceae |
15.08 |
0 |
NS |
+ |
|
Location-3 |
|
|
|
|
|
|
Antiapi |
15.08 |
0.29 |
NS |
+ |
|
|
Erythrina variegata |
Fabaceae |
14.02 |
0.2 |
NS |
+ |
|
Obat Gula |
60.32 |
0.2 |
NS |
+ |
|
|
Helicteres hirsute |
Malvaceae |
15.08 |
0.29 |
NS |
+ |
|
Pinus merkusii |
Pinaceae |
65.61 |
0.71 |
NS |
- |
|
Location-1 Pole |
|||||
|
Laplacean sp. |
Acanthaceae |
84.04 |
0.84 |
NS |
- |
|
Morinda tinctoria Roxb |
Rubiaceae |
32.04 |
0.48 |
NS |
+ |
|
- |
- |
25.72 |
0.3 |
NS |
+ |
|
Pinus merkusii |
Pinaceae |
29.53 |
0.52 |
NS |
+ |
|
Quersus salicina |
Fagaceae |
28.45 |
0.48 |
NS |
+ |
|
Location-2 |
|
|
|
|
|
|
Macadamia integrifolia |
Probaceae |
52.96 |
0.16 |
NS |
- |
|
Pinus merkusii |
Pinaceae |
27.67 |
0.5 |
NS |
+ |
|
- |
- |
28.85 |
0.2 |
NS |
+ |
|
Calliandra calothyrsus |
Fabaceae |
28.22 |
0 |
NS |
+ |
|
Coffea canephora pierre |
Rubiaceae |
109.79 |
0 |
NS |
+ |
|
Location-3 |
|
|
|
|
|
|
Pinus merkusii |
13099.68 |
0.58 |
NS |
+ |
|
|
Location-1 Tree |
|||||
|
Laplacean sp. |
Acanthaceae |
91.23 |
1.34 |
S |
+ |
|
Exbulandia populnea |
Malvaceae |
17.54 |
0.5 |
S |
+ |
|
- |
- |
21.05 |
0.35 |
NS |
+ |
|
Pinus merkusii |
Pinaceae |
14.04 |
1.04 |
S |
+ |
|
Schima wallichii |
Theaceae |
17.54 |
0.8 |
S |
+ |
|
Location-2 |
|
|
|
|
|
|
Pinus merkusii |
Pinaceae |
98.1 |
0.29 |
NS |
+ |
|
Macadamia integrifolia |
Proteaceae |
151.03 |
0.12 |
NS |
- |
|
Calliandra calothyrsus |
Fabaceae |
30.2 |
0 |
NS |
- |
|
Persea americana |
Lauraceae |
20.67 |
0 |
NS |
+ |
|
Location-3 |
|
|
|
|
|
|
Pinus merkusii |
Pinaceae |
96.33 |
0.58 |
NS |
+ |
Note: S: Significant, NS: Not Significant
Table 5 presents the IVI and Association of nepenthes tobaica in Plant Communities Surrounding Habitat in Ria-Ria Village, Humbang Hasundutan Regency, North Sumatra, Indonesia. The table is divided into multiple locations and vegetation types (undergrowth, pole, and tree).
Nepenthes tobaica, the focus species, is present in all three locations within the undergrowth category, with its Importance Index varying across locations and being highest in Location-3. While most species exhibit a positive association with N. tobaica, the majority of these relationships are not statistically significant. However, there are a few significant associations, both positive and negative. The dominant species differ among locations, with Pteridium aquilinum, Dicranopteris sp., and Struthiopteris spicant having the highest IVI in Location-1, Location-2, and Location-3 undergrowth, respectively. The comprehensive data provided in the table includes vegetation layers (undergrowth, pole, and tree), showcasing the rich plant community structure and biodiversity in the study area, with the varying associations and importance indices suggesting a complex ecological relationship between N. tobaica and other plant species within its habitat.
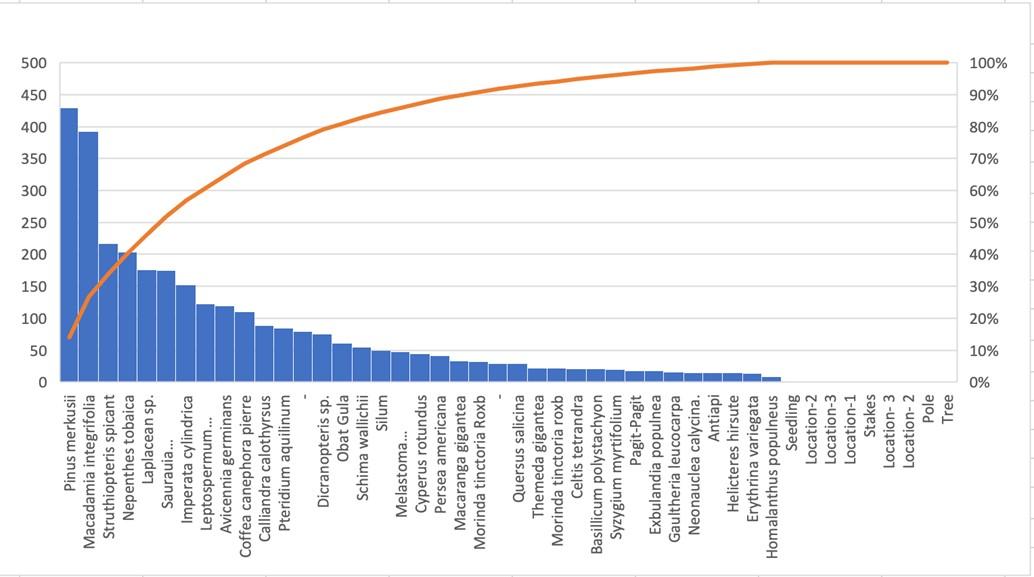
A Pareto diagram at Figure 2, visually represents the IVI and association of nepenthes tobaica with other plant species. The bars represent IVI values for different species in descending order, while the line shows the cumulative percentage of IVI values. This helps identify the most important species and demonstrates the potential application of the Pareto principle (80/20 rule).
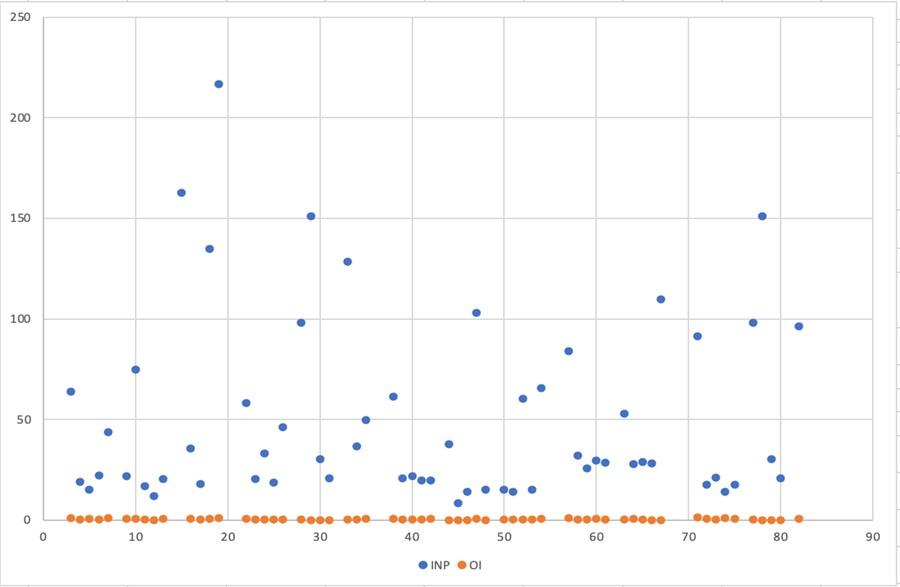
Figure 3 displays the relationship between the Importance Value Index and the Ochiai Index for plant species associated with nepenthes tobaica. It shows how a species' ecological importance correlates with its association strength with N. tobaica, reveals species distribution patterns, identifies key species with high IVI and OI values, highlights unusual species (outliers), and may indicate groups of species with similar ecological roles. The range of IVI and OI values shown reflects the diversity of ecological importance and association strengths within the community.
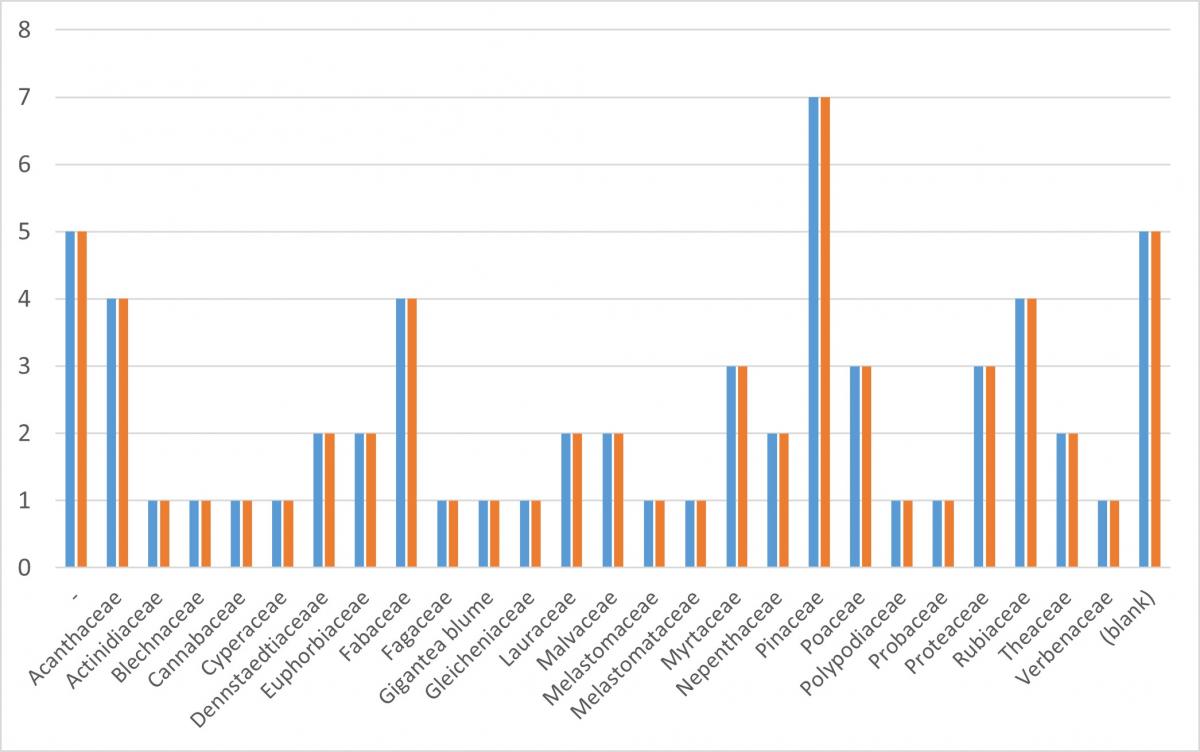
Pareto diagram in Figure 4 showing the IVI and association of nepenthes tobaica. The diagram visually represents the relative importance and association of different factors related to nepenthes tobaica, a species of pitcher plant. These frequencies are compared across the three study locations and broken down by the plants' growth stages (understory, seedling, sapling, pole, and tree).
Figure 2. Pareto diagram of the IVI and association of nepenthes tobaica
Figure 3. Scatter plot to visualize the relationship between IVI and OI values for different species
Figure 4. Diagram of count of association
Vegetation and Association Analysis of N. Tobaica at the Undergrowth Level
In the population at Site 1, 5 species of understory plants were found with the highest IVI values, namely Pteridium aquilinum (63.95), Cyperus rotundus (43.90), Themeda gigantea (22.26), Nepenthes tobaica (18.93), and Gaultheria leucocarpa (15.25). At the understory level, Pteridium aquilinum species from the Dennstaedtiaceaae family had the highest association value with a value of 0.96, which was positive and real. The lowest association value was found in Cyperus rotundus species with an association value of 0.86, negative and not real.
The highest Index of Importance (IVI) in the understory population at Site 2 was found in Dicranopteris sp. (74.65), Nepenthes tobaica (22.00), Pteridium aquilinum (20.60), Imperata cylindrica (17.07) and Melastoma melabathricum (11.85). Based on the calculation results, the highest association value was found in the Pteridium aquilinum species with a value of 0.78, which was positive and not real.
The highest IVI value in the population at Site 3 for the lower plant level was found in the species Struthiopteris spicant (216.84), Nepenthes tobaica (162.65), Imperata cylindrica (134.84), Melastoma melabathricum (35.78) and Pagit-pagit (17.89). At the lower plant level, species with the highest association value were found in Struthiopteris spicant with a value of 0.84, positive and not significant.
Vegetation and Association of N. Tobaica at Seedling Level
The highest IVI value at the seedling level in location 1 was found in Avicennia germinans (58.23), Saurauia blumeana Spreng (46.04), Macaranga gigantea (33.04), Basillicum polystachyon (20.42) and sp1 (18.50). Based on the calculation results, it was found that the species with the highest association value was Avicennia germinans with an association value of 0.67, positive and not real. The lowest association value was found in 3 species, one of which was Macaranga gigantea with a value of 0.15, was negative and not real.
The highest IVI value at the seedling level in the population at Site 2 was found in the species Macadamia integrifolia (151.03), Pinus merkusii (98.10), Calliandra calothyrsus (30.20) and Persea americana (20.67). At the seedling level, 2 species were found to be associated and 2 species were not associated with N. tobaica. The species with the highest association value was found in Pinus merkusii species with a value of 0.29, positive and not significant, while the species with the lowest value was found in Macadamia integrifolia species with a value of 0.12, negative and not significant.
The highest IVI value at the seedling level in the population at Site 3 was found in the species Saurauia blumeana Spreng (128.28), Silum (49.60) and Schima wallichii (36.67). At the seedling level population in location 3, the highest association value was found in Silum species with a value of 0.62, negative and not real. The lowest association value was found in Saurauia blumeana Spreng species with a value of 0.35, positive and not significant.
Vegetation and Association Analysis of N. Tobaica at Stake level
In the population at location 1, the highest IVI value at the sapling level was found in the species Avicennia germinans (61.24), Morinda tinctoria Roxb (22.01), Celtis tetrandra (20.69), Syzygium myrtifolium (19.69) and Leptospermum javanicum (19.63). Based on the calculation results, the highest association value was found in Avicennia germinans species with a value of 0.75, negative and not real. The lowest association value was found in Syzygium myrtifolium species with a value of 0.37, positive and not significant.
The highest IVI values at the sapling level in the population at Site 2 were found in the species Leptospermum javanicum (103.17), Macadamia integrifolia (37.57), Neonauclea calycina (15.08), sp2 (14.02) and Homalanthus populneus (8.47). In the sapling level population at Site 2, the highest association value was found in the species Leptospermum javanicum with a value of 0.82, positive and not significant. The lowest association value was found in 3 species, one of which was Macadamia integrifolia with a value of 0.08, negative and not significant.
The highest IVI value at the sapling level in the population at location 3 was found in Pinus merkusii species (65.61), sugar medicine (60.32), Helicteres hirsute (15.08), Antiapi (15.08) and Erythrina variegata (14.02). In the sapling level population at Site 3, the highest association value was found in Pinus merkusii species with a value of 0.71, which was negative and not significant.
Vegetation and Association Analysis of N. Tobaica at Pole level
In the population at location 1, the highest IVI value at the pole level was found in Laplacean sp. (84.04), Morinda tinctoria Roxb (32.04), Pinus merkusii (29.53), Quersus salicina (28.45) and sp3 (25.72). Based on the calculation of the highest association value found in Laplacean sp. with a value of 0.84, is negative and not real. The highest IVI value at the pole level in the population at location 2 was found in the species Coffea canephora pierre (109.79), Macadamia integrifolia (52.96), sp4 (28.85), Calliandra calothyrsus (28.22), and Pinus merkusii (27.67). At the pole level population in location 2, the highest association value was found in Pinus merkusii and Leptospermum javanicum species with a value of 0.50, positive and not significant. The lowest association value was found in Macadamia integrifolia species with a value of 0.16, negative and not significant.
In the population at location 3 at the pole level, 1 species was found, namely Pinus merkusii with an IVI value of 13099.68. At location 3 for the pole level, 1 species was found to be associated with N. tobaica with a value of 0.58, which is positive and not real.
Vegetation and Association Analysis of N. Tobaica at Tree Level
In the population at location 1, the highest IVI value at the tree level was found in Laplacean sp. (91.23), sp5 (21.05), Exbulandia populnea (17.54), Schima wallichii (17.54) and Pinus merkusii (14.04). Based on the calculation results, the highest association value was found in Laplacean sp. species with a value of 1.34, positive and real.
The highest IVI values at the tree level in the population at Site 2 were found in the species Macadamia integrifolia (151.03), Pinus merkusii (98.10), Calliandra calothyrsus (30.20) and Persea americana (20.67). In the tree-level population at Site 2, 2 species were found to be associated with N. tobaica and 2 species were not associated with N. tobaica. The highest association value was found in Pinus merkusii species with a value of 0.29, positive and not significant. The lowest association value was found in Macadamia integrifolia with a value of 0.12, negative and not significant.
In the population at location 3 at the tree level, 1 species was found, namely Pinus merkusii with an IVI value of 96.33. At location 3 for the tree level, 1 species was found to be associated with N. tobaica with a value of 0.58, which is positive and not significant.
Index of Diversity, Richness, Evenness of Species, and Morisita Index in Ria-Ria Village
Based on the calculation results, the values of the Diversity Index, Richness, Evenness of Species, and Morisita Index were found in the three research locations. The values obtained in the three locations are different, this shows that the three locations have different environmental conditions such as lighting, humidity, and soil structure that support the growth of diverse species. The values of Diversity Index, Richness, Evenness of Species, and Morisita Index in Ria-Ria Village in detail can be seen in Table 6.
Table 6. Values of diversity index, richness, evenness of species, and Morisita index in Ria-Ria Village
|
Understory |
Seedling |
Stake |
Pole |
Tree |
|
|
Location 1 |
|||||
|
Total Type |
22 |
7 |
10 |
10 |
10 |
|
H’ |
2 |
1.6 |
1.52 |
1.33 |
1.81 |
|
Category |
Medium |
Medium |
Medium |
Medium |
Medium |
|
Dmg |
2.45 |
5.15 |
5.09 |
2.35 |
4.04 |
|
Category |
Low |
High |
High |
Low |
Medium |
|
J |
2.56 |
1.95 |
0.3 |
0.58 |
0.2 |
|
Category |
High |
Sedang |
Low |
Low |
Low |
|
Morisita |
0 |
0.23 |
0.37 |
0.42 |
0.2 |
|
Category |
Random |
Clump |
Clump |
Clump |
Clump |
|
Location 2 |
|||||
|
Total Type |
16 |
5 |
7 |
9 |
4 |
|
H’ |
1.66 |
1.03 |
1.34 |
1.73 |
1.15 |
|
Category |
Medium |
Medium |
Medium |
Medium |
Medium |
|
Dmg |
2.38 |
1.25 |
1.76 |
2.24 |
1.19 |
|
Category |
Low |
Low |
Low |
Low |
Low |
|
J |
0.61 |
0.74 |
0.75 |
0.83 |
1.04 |
|
Category |
Low |
Low |
Low |
Low |
Medium |
|
Morisita |
0.33 |
0.45 |
0.36 |
0.25 |
2.49 |
|
Category |
Clump |
Clump |
Clump |
Clump |
Clump |
|
Location 3 |
|||||
|
Total Type |
9 |
3 |
6 |
1 |
1 |
|
H’ |
1.08 |
0.91 |
1.15 |
0 |
0 |
|
Category |
Medium |
Low |
Medium |
Low |
Low |
|
Dmg |
1.5 |
0.72 |
1.58 |
0.35 |
0.43 |
|
Category |
Low |
Low |
Low |
Low |
Low |
|
J |
0.52 |
1.31 |
0.72 |
0 |
0 |
|
Category |
Low |
Medium |
Low |
Low |
Low |
|
Morisita |
6.88 |
11.53 |
11.32 |
25 |
25 |
|
Category |
Clump |
Clump |
Clump |
Clump |
Clump |
In the population of location 1, all growth stages have moderate diversity, namely understorey (2.00), seedling (1.60), sapling (1.52), pole (1.33), and tree (1.81) (Table 6). The species richness value in the Site 1 population at the understory (2.45) and pole (2.35) levels was low. At the tree level (4.04) is medium and at other levels, namely seedlings and saplings, is high. The species evenness index at the lower plant level (2.56) is high. At the seedling level (1.95) is categorized as low and at other levels, namely saplings, poles and trees are categorized as low. In the location 1 population, almost all growth levels have a clump growth pattern, namely at the seedling level (0.23), sapling (0.37), pole (0.42) and tree (0.20), only at the lower plant level (0.00) including random.
In the population of location 2, all growth stages have moderate diversity, namely understorey (1.66), seedling (1.03), sapling (1.34), pole (1.73), and tree (1.15). The value of species richness in the population of location 1 at all growth stages is in the low category. The species evenness index at almost all levels is in the low category, namely understory (0.61), seedling (0.74), sapling (0.75) and pole (0.83). At the tree level (1.04) is medium. Growth pattern of all growth stages including clumps.
In the population of location 3, the diversity value at the lower plant level (1.08) and saplings (1.15) is medium. The other levels were low, namely seedlings, poles and trees. Species richness at all growth stages is low. The species evenness index at almost all levels is low, namely at the lower plant level (0.52), saplings (0.72), poles (0.00) and trees (0.00). Growth pattern at all growth levels including clumps.
Based on Table 6, it can be concluded that location 1 has the highest H' value at the lower plant level (2.00) which indicates higher diversity than other locations. Similarly, species richness (Margalef Index) shows the highest species richness at Site 1, especially at the seedling level (5.15), while the lowest species richness is at Site 3 with a value of 1.19 at the tree level. This may be due to environmental pressure or human disturbance. Mansur et al. [20] stated that changes in land functions into agricultural land, settlements and other functions besides reducing the habitat area of a species can also affect changes in surrounding environmental factors so that many vegetation species are unable to survive. The highest species evenness index was also found at the lower plant level in location 1 (2.56), which indicates a more even distribution of species than other locations.
This study identified 36 species of vegetation across three research locations. The highest Importance Value Index (IVI) at location 1 was recorded at the pole level for Laplacean sp. (91.23), while in location 2, Macadamia integrifolia exhibited the highest IVI at both the seedling and tree levels (151.03). At location 3, Pinus merkusii had the highest IVI (13099.68). Positive and significant species associations were found in Laplacean sp. (1.34) at location 1 and Pteridium aquilinum (0.78) at location 2, whereas no significant positive associations were observed at location 3. The highest species diversity, richness, and evenness indices were recorded in zone 1, suggesting that the environmental conditions in this zone are more favorable for vegetation growth.
The findings align with previous studies highlighting the role of specific plant associations in shaping Nepenthes habitats. Prior research has demonstrated that Nepenthes species often thrive in nutrient-poor environments, where their interactions with surrounding vegetation can influence competition and resource availability. This study builds on those findings by providing a quantitative framework for assessing such associations. The absence of significant associations at location 3 suggests that habitat degradation may disrupt ecological networks, reinforcing previous conclusions that land-use changes can negatively impact Nepenthes populations. Future research should further examine how habitat disturbances alter plant community dynamics and whether certain species serve as indicators of habitat quality.
The study underscores the importance of sustainable land-use practices for N. tobaica conservation. The identification of key associated species provides valuable insight for habitat restoration efforts. Specifically, conservation strategies should prioritize the preservation of Laplacean sp. and Pteridium aquilinum, as their strong associations with N. tobaica suggest that they may contribute to habitat stability. Additionally, maintaining high species diversity, as observed in zone 1, could support ecosystem resilience and ensure favorable growth conditions for N. tobaica. Given the increasing threats from habitat modification, conservation policies should integrate ecological data into land management plans, emphasizing the protection of vegetation structures that sustain Nepenthes populations.
Beyond N. tobaica, this study demonstrates the broader applicability of mathematical models in conservation research. By integrating ecological indices with quantitative analysis, the approach offers a replicable method for assessing plant associations, species interactions, and habitat quality. Future research should expand this framework to other Nepenthes species and examine long-term ecological trends, particularly in response to climate change and anthropogenic pressures. Investigating how environmental variables such as soil composition and hydrology influence species associations would further enhance conservation strategies.
Overall, this research provides essential ecological insights into N. tobaica, offering a robust foundation for habitat management and conservation planning. The use of mathematical models to quantify ecological relationships enhances our ability to predict species distributions and assess habitat quality, ultimately informing more effective conservation strategies for N. tobaica and other vulnerable plant species.
This research article is the output of Talenta Government collaboration research scheme 2024 Universitas Sumatera Utara, contract No.: 17/UN5.4.10.S/PPM/KP-TALENTA/B-II/2024.
[1] Gilbert, K.J., Bittleston, L.S., Tong, W., Pierce, N.E. (2020). Tropical pitcher plants (Nepenthes) act as ecological filters by altering properties of their fluid microenvironments. Scientific Reports, 10(1): 4431. https://doi.org/10.1038/s41598-020-61193-x
[2] Susanti, T.S., Kencanawati, I. (2017). The Composition of Plants in Nepenthes Spp. Community in Customary Forest of Lingkat Lake Kerinci. https://api.semanticscholar.org/CorpusID:196649854.
[3] Mansur, M., Salamah, A., Mirmanto, E., Brearley, F.Q. (2022). Nutrient concentrations in three nepenthes species (Nepenthaceae) from North Sumatra. Reinwardtia, 21(2): 55-62. http://doi.org/10.55981/reinwardtia.2022.4391
[4] Setiawan, H. (2017). Nepenthes as tourism flagship species: The conservation strategies in Dayak Seberuang Settlements Area. Journal of Indonesian Tourism and Development Studies, 5(2): 113-120. http://doi.org/10.21776/ub.jitode.2017.005.02.07
[5] Hernawati, H., Am Zuhud, E.R.V.I.Z.A.L., Prasetyo, L.B., Soekmadi, R. (2022). Synopsis of sumatran nepenthes (Indonesia). Biodiversitas Journal of Biological Diversity, 23(8). https://doi.org/10.13057/biodiv/d230848
[6] Nainggolan, L., Gultom, T., Silitonga, M. (2020). Inventory of pitcher plant (Nepenthes sp.) and its existence in North Sumatra Indonesia. Journal of Physics: Conference Series, 1485(1): 012013. https://doi.org/10.1088/1742-6596/1485/1/012013
[7] Setiawan, H., Hakim, L., Fernandes, A.A.R., Retnaningdyah, C. (2022). Prey composition and correlation between morphometry and prey biomass weight of the endemic nepenthes bicalcarata in Kalimantan, Indonesia. Biodiversitas Journal of Biological Diversity, 23(10). https://doi.org/10.13057/biodiv/d231057
[8] Rizki, M., Wardhana, V.W.W., Mawardin, M., Sunariyati, S. (2021). Diversity of semar pockets (Nepenthes sp.) at Palangka Raya University. Bioeduscience, 5(2): 159-165. https://doi.org/10.22236/j.bes/526495
[9] Rizqiani, S., Ariyanti, N.S. (2018). Diversity of lowland nepenthes (Pitcher Plants) in Bangka belitung Islands. IOP Conference Series: Earth and Environmental Science, 197(1): 012021. https://doi.org/10.1088/1755-1315/197/1/012021
[10] Tarigan, M.R.I.M.A., Azis, S., Tanjung, I.F., Pary, C., Adlini, M.N., Jayanti, U.N.A.D., Ardianto, Ulfa, A.Y. (2023). Morphology and pitcher’s color nepenthes in Batu Lubang Sibolga Area, North Sumatra Province, Indonesia. Biodiversitas Journal of Biological Diversity, 24(4). https://doi.org/10.13057/biodiv/d240403
[11] Victoriano, M. (2021). A new species of Nepenthes (Nepenthaceae) and its natural hybrids from Aceh, Sumatra, Indonesia. Reinwardtia, 20(1): 17-26. http://doi.org/10.14203/reinwardtia.v20i1.3932
[12] Lestariningsih, N., Setyaningsih, D. (2017). Explorative study of tropical pitcher plants (Nepenthes sp.) types and insects that trapped inside in Sebangau National Park Palangka Raya Central Kalimantan. Journal of Physics: Conference Series, 795(1): 012062. https://doi.org/10.1088/1742-6596/795/1/012062
[13] Saidon, N.A., Wagiran, A., Samad, A.F.A., Mohd Salleh, F., Mohamed, F., Jani, J., Linatoc, A.C. (2023). DNA barcoding, phylogenetic analysis and secondary structure predictions of nepenthes ampullaria, nepenthes gracilis and nepenthes rafflesiana. Genes, 14(3): 697. https://doi.org/10.3390/genes14030697
[14] Ludwig, J.A., Reynolds, J.F. (1988). Statistical Ecology: A Primer in Methods and Computing. John Wiley & Sons, Vol. 1. https://doi.org/10.5962/p.356161
[15] Araina, E., Mashabhi, S., Adam, C., Fahrina, R. (2022). The diversity of nepenthes spp. in multipurpose forest, green campus area of university of palangka raya, central kalimantan, Indonesia. Nusantara Science and Technology Proceedings, 74-79. https://doi.org/10.11594/nstp.2022.2511
[16] Fitmawati, S., Juliantari, E. (2023). Diversity of pitcher plants (Nepenthes spp.) in Riau Archipelago Province, Indonesia. SABRAO Journal of Breeding and Genetics, 55(3): 927-939. http://doi.org/10.54910/sabrao2023.55.3.27
[17] Krebs, C.J. (1972). Ecology, the Experimental Analysis of Distribution and Abundance. New York: Harper and Row Publisher. https://doi.org/10.2307/1296598
[18] Yudaputra, A., Astuti, I.P., Handayani, T., Siregar, H., Robiansyah, I., Wahyuni, S., Rachmadiyanto, A.N., Purnomo, D.W., Kurniawan, V., Isnaini, Y., Damayanti, F., Zulkarnaen, R.N., Witono, J.R., Fijridiyanto, I.A., Yuzammi, Hidayat, A., Siregar, M., Munawaroh, E., Wardhani, F.A., Raharjo, P.D., Widiana, A., Cropper Jr, W.P. (2023). Comprehensive approaches for assessing extinction risk of endangered tropical pitcher plant nepenthes talangensis. PlOS One, 18(8): e0289722. https://doi.org/10.1371/journal.pone.0289722
[19] Mansur, M., Brearley, F.Q., Esseen, P.J., Rode-Margono, E.J., Tarigan, M.R.I.M.A. (2021). Ecology of nepenthes clipeata on gunung kelam, Indonesian Borneo. Plant Ecology & Diversity, 14(3-4): 195-204. https://doi.org/10.1080/17550874.2021.1984602
[20] Mansur, M., Salamah, A., Mirmanto, E., Brearley, F.Q. (2023). Diversity, ecology and conservation status of Nepenthes in West Sumatra province, Indonesia. Biotropia, 30(2): 220-231. https://doi.org/10.11598/btb.2023.30.2.1896