Raad F. Hasan*![]() | Mohsen Seyedi
| Mohsen Seyedi![]() | Riyadh Alsultani
| Riyadh Alsultani![]()
© 2024 The authors. This article is published by IIETA and is licensed under the CC BY 4.0 license (http://creativecommons.org/licenses/by/4.0/).
OPEN ACCESS
The purpose of this study is to assess Haditha Dam's catchment area and accessible surface area in order to guarantee that these regions can hold water without being at risk of floods. Using topographic data, the study simulated the two-dimensional catchment area and flow area below the dam. The monthly increase in water storage was then computed using the water balance equation and HEC RAS software. These increments were used to determine the required flow that might be utilized to run the dam more efficiently. Significant outflows were found at the start of the operational year. These volumes will probably cause water to accumulate, water levels to increase quickly, and heights to climb. In order to make sure that these regions can store water without running the danger of flooding, the goal of this study is to assess the catchment area of a contemporary dam and its accessible surface area. The study generated a two-dimensional catchment region and flow area below the dam using topography data. The water balance equation and HEC RAS software were then used to determine the monthly increase in water storage. The necessary flow that could be utilized to run the dam as effectively as possible was calculated using these increments. This assessment provides a comprehensive analysis of the dam's capacity to manage water storage efficiently and mitigate flood risks, contributing to sustainable water management practices.
water quantity, overtopping, flood, Haditha Dam, sustainable model
Within a nation or region's hydrological system, dams play a significant role. By lowering the danger of flooding and increasing the amount of energy that can be generated, they aid in the irrigation of vast tracts of land with surface water and aid in the urbanization of regions downstream [1]. The function of dams in Iraq is seen in the way they store water, control river flow, and supply water for a variety of uses, including irrigation [2].
Although dams and reservoirs are naturally occurring, numerous man-made structures are built to regulate them. Landslides, volcanic eruptions, and rising ground pressure are examples of geological phenomena that can construct mountains and create rock dams that stop lakes from forming [3]. Iraq's hydrological system is mostly dependent on the Euphrates and Tigris rivers, however there are other sources of water that are used for diverse purposes. Along these rivers, several dams have been constructed to regulate reservoir capacity and water outflow [4]. One of the most significant dams constructed in Iraq on the Euphrates River, Haditha Dam is used for flood risk reduction, irrigation, and water storage [5].
River flooding may have negative effects on the economy, society, and environment. The inadequate knowledge of regional differences in flooding has, however, resulted in a number of poorly understood flood patterns and hazy projections of future floods. Studying the lack of reaction to floods benefits greatly from an understanding of the underlying mechanisms. It is crucial to concentrate on evaluating floods over big regions, especially repeated occurrences like yearly peaks. Rarely researched [6] are several catastrophic flood alterations that only sometimes occur at a tiny number of locations having records of continuous monitoring. In summary, flooding happens when water builds up and floods wide regions, much like flowing water.
Heavy rainfall or a rise in the amount of water that is greater than the capacity of typical watercourses, such as lakes, rivers, or reservoirs, might cause it to be channeled to storage zones. Most flooding is dangerous and results in home devastation [7].
All storage alternatives are estimated to be affected by the effects of environment change. Longer droughts, less precipitation, and efforts to keep soil water levels constant are a few examples of this. These elements help to raise the soil's moisture content, which has an impact on crops [8]. Groundwater recharge brought on by increasing sea levels may be lessened if the leakage rate declines. As a result, there is a major danger that coastal aquifers will be exposed to a significant amount of saltwater intrusion [9].
Various external elements connected to different forms of storage are also impacted by climate change. For instance, areas where there is extensive water storage serve as breeding grounds for insects like mosquitoes, which may spread a variety of harmful waterborne infections [10-13].
In addition to serving several other purposes, the primary objective of many dams constructed for the purpose of generating power or storing water is to reduce the danger of flooding. One of the major long-term effects of groundwater recharge and dams is the provision of water for several municipal and local uses. In order to provide water, dams hold water when it is at its lowest point.
This allows for the irrigation of several farmed regions, particularly during dry seasons. Dams increase water, particularly on the lower side, while decreasing the usage of groundwater [14-19]. The features of surface flow, as well as how it interacts with surface water and groundwater, are mostly influenced by the reservoir's management. This is where the connection between drainage and recharge changes [20-24].
From the above, it can be inferred that the water surface and the watershed's size influence numerous modifications that transpire at the water sheet's level, particularly with regard to the quantity of water that is utilized by people. It is anticipated that groundwater levels between the source and the downstream will be directly impacted by contemporary dams. Furthermore, groundwater rises on reservoir surfaces in several natural scenarios.
2.1 Area of study
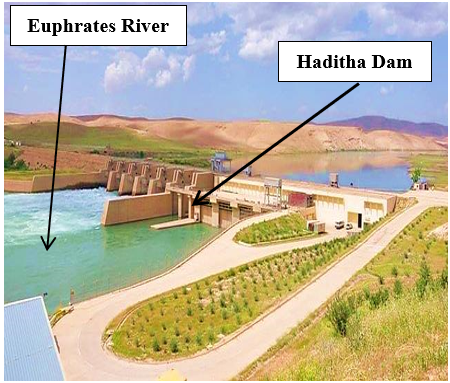
The western Iraqi regions connected to Ana and Rawa are entirely submerged under the reservoir of the Haditha Dam. The dam is situated near Haditha's boundaries on the Euphrates River. Lake Al-Qadisiyah forms as a result of the dam's restriction on the water flow behind it [14, 25-28]. The Haditha Dam is situated in a confined area on the Euphrates River, as seen in Figure 1.
Figure 1. Haditha Dam photographic [19]
It is situated several kilometers downstream from the city [16]. The topography, geology, and the presence of karst rocks in the dam supports all contributed to the choice of this location, which offers ideal conditions for construction and the procurement of regional building materials. The dam is approximately 9,064 meters long overall. Measuring from the deepest point in the river channel, which is influenced by topography and hydrological conditions, the dam's height is 57 meters [10].
2.2 Methodology
Analyzing the volumetric rate of water occupied by the catchment area is part of the technique since it influences how much water can be discharged downstream and how well the dam can supply water for other uses, such as irrigation.
The water balance equation was used to assess the hydrological activities resulting from the movement and direction of the water body in order to initiate the analytical process. The following is the mass balance equation that connects the downstream area with the storage area:
$\mathrm{V}_{\mathrm{t}}=\mathrm{V}_{\mathrm{t}-1}+\mathrm{Q}_{\mathrm{C}}+\mathrm{Q}_{\text {in }}-\mathrm{Q}_{\text {out }}-\mathrm{U}_{\mathrm{RL}}+(\mathrm{P}-\mathrm{E}) * \mathrm{~A}_{\mathrm{RL}}$ (1)
where,
Vt: Volume of storage (in m3) of reservoir at time t
Vt-1: Volume of storage (in m3) of reservoir before change
Qc: The inflow toward the storage area (in m3)
Qin: The lateral inflow from other up streams toward the storage area (in m3)
Qout: The outflow from the storage area (in m3)
URL: Water withdrawal (in m3) at time t
P: Participation (in m)
E: Evaporation (in m)
ARL: Reservoir area (in m2)
2.3 HEC RAS work
The (HEC-RAS) model from the "US army Corps of Engineers River Analysis System" was utilized in this study's simulations. An elaborate graphic with many capabilities is used to display program outputs. This model's sediment load component was created to replicate the one-dimensional deposition of sedimentation and river erosion [15]. In this version of the model, some of the analyses are based on the following hypotheses:
(1). Flow is constant and varies gradually (except from a hydraulic structures).
(2). Flow is unidirectional, meaning that velocity components in directions other than the flow direction are ignored.
(3). River channels have "small" slopes, at 1:10 or less.
(4). Treating the river's bend as a straight, while ignoring its effects.
(5). Ignoring the wash load's value because it is so little.
There are several ways to determine fall velocity, thus the researcher must select the best approach. There are four techniques in the fall velocity editor in HEC-RAS. The Ruby formula was used in this investigation. The "Stokes law" (for tiny particles susceptible only to viscous resistance) and an impact formula (for huge particles outside of the Stokes region) are used to provide an analytical link between the sediment characteristics, fluid, and the fall velocity [21].
Figure 2. Identifying the program's 2D downstream region
HEC-RAS software was used to evaluate the areas above and below Haditha Dam. The 2D catchment area and flow region below the dam were simulated by the program using topography data. Refer to Figure 2. This simulation was run to look at the likelihood of overtopping failure that might happen when the dam's uniform flow rate is disturbed. Utilizing the program, the first stage was to assess the necessary data, which included flow rate and dam height, two factors that have an impact on water storage capacity.
The following Tables 1-4 provide a summary of the necessary data utilized in the HEC RAS program:
Table 1. Haditha Dam initial data obtained from the Iraqi Ministry of Water Resources
|
Elevation of Dam Crest (m) |
154 |
|
Length of dam (m) |
9 |
|
Height of dam (m) |
57 |
Table 2. Volume of storage-elevation data of Haditha Dam reservoir obtained from the Iraqi Ministry of Water Resources
|
Elevation (m) |
Volume of Storage (*107 m3) |
|
102 |
0 |
|
120 |
77 |
|
140 |
532 |
|
145 |
765 |
|
147 |
827 |
|
150 |
966 |
|
152 |
1042 |
Table 3. The inflow of the storage area of Haditha Dam (m3/s) annual discharge
|
Year Month |
2018 |
2019 |
2020 |
2021 |
|
1 |
688 |
684 |
680 |
676 |
|
2 |
675 |
668 |
660 |
662 |
|
3 |
500 |
490 |
480 |
470 |
|
4 |
319 |
302 |
297 |
286 |
|
5 |
439 |
437 |
435 |
439 |
|
6 |
385 |
384 |
383 |
381 |
|
7 |
500 |
503 |
506 |
508 |
|
8 |
672 |
681 |
691 |
690 |
|
9 |
476 |
472 |
479 |
481 |
|
10 |
322 |
313 |
314 |
295 |
|
11 |
432 |
423 |
413 |
403 |
|
12 |
506 |
495 |
484 |
483 |
Table 4. The anticipated monthly water balance following application of the water balance calculation
|
Month |
Qc (m3/sec) |
P (mm) |
E (mm) |
Change in Vt (m3/sec) |
|
1 |
676 |
21.9 |
61.1 |
1710692000 |
|
2 |
662 |
5.8 |
103.8 |
1661104000 |
|
3 |
470 |
0 |
147.6 |
1144440000 |
|
4 |
286 |
0 |
176.5 |
653062000 |
|
5 |
439 |
0 |
176.9 |
1049438000 |
|
6 |
381 |
0 |
136.2 |
919452000 |
|
7 |
508 |
5.4 |
81.6 |
1273236000 |
|
8 |
690 |
10.2 |
30.8 |
1767980000 |
|
9 |
481 |
22.4 |
13.6 |
1228752000 |
|
10 |
295 |
18.2 |
7.8 |
751640000 |
|
11 |
403 |
16.3 |
12.9 |
1029976000 |
|
12 |
483 |
20.7 |
26.3 |
1228436000 |
For the four years between 2018 and 2021, the study's monthly storage space flow was determined.
The formula of water balance is mainly based on the inflow towards the reservoir area. The volume of water in a catchment region is also significantly influenced by the intensity of the rainfall and possible evaporation. The initial storage volume before any changes is equal to 827×107m3. Figure 3 demonstrates the variation of monthly outflow in Haditha Dam. According to this figure, the highest amount of outflow was observed in January. Once the water balance equation with the imposed variables were calculated, the outputs were shown in Table 5.
Figure 3. Variation of monthly outflow in Haditha Dam
Table 5. The determined catchment with respect to water elevation, after applying the water balance equation with the imposed variables
|
Elevation |
Area (*1000m2) |
|
147 |
415000 |
|
147.5 |
839010 |
|
148 |
1263020 |
|
148.5 |
1687030 |
|
149 |
2111040 |
|
149.5 |
2535050 |
|
150 |
2959060 |
|
150.5 |
3383070 |
|
151 |
3807080 |
|
151.5 |
4231090 |
|
152 |
4655100 |
|
152.5 |
5079110 |
|
153 |
5503120 |
|
153.5 |
5927130 |
|
154 |
6351140 |
3.1 Model evaluation
The water quantity balance equation can serve as the foundation for the applied model that can be utilized to manage Haditha Dam's water capacity. If we assume that there are variables x1, x2, x3, and so on, we may write the equation like this:
$x 1-x 2+(x 3-x 4) A=x 5$ (2)
where,
x1 = rate of inflow (m3/sec),
x2 = rate of outflow (m3/sec),
x3 and x4: rainfall intensity and the evaporation (in mm),
x5 = the current storage rate,
A = area of reservoir.
By assigning other parameters as M and EL
where,
M= month number 1 for January, 2 for February and so on
EL = Elevation (m. s. l.)
The equation that represented the occupation of water quantity in storage zone between two elevations is:
$\mathrm{A} \times\left(\mathrm{EL}_2-\mathrm{EL}_1\right)=\mathrm{x}_1 * \mathrm{t}$ (3)
where,
t= time to occupy the storage zone
From two equations:
$\frac{\mathrm{A} *(\mathrm{EL} 2-\mathrm{EL} 1)}{t}=x 1-x 2+(x 3-x 4) \mathrm{A}$ (4)
t = f(M),
A = f(EL).
3.2 Model results
The elevation of the water surface can be calculated by subtracting the depth to water from the ground surface elevation. Then, comparisons of water elevations can be made between monitoring well locations and the direction and gradient of water flow can be determined.
Dam water is referred to as retained or stored water. One of two units of measurement is available: "Cusecs" or "Tmcft." Cusec is the colloquial shorthand for "cubic feet per second." The conversion to 28,317 liters per second is possible. Outflow is the water volume that leaves a reservoir per second by the spillway of Hadith dam; and withdrawal is the water volume that leaves a reservoir per second only when it is specifically withdrawn.
Given the knowledge of the relationships S=S(h) and Q=Q(h), one can calculate the height of the tank and, consequently, the discharge at the end of the time step using (S2+Q2 ∆t/2). To cover the whole flow hydrograph, repeat this process.
Table 6 tabulates the predicted monthly outflow of the dam with respect to current elevation for the first four month of the studied year.
In summary, the findings demonstrated that the carefully regulated lowered flows of the dam and clear water discharge created significant modifications to the channel and its flow regime, and that the water surface height was decreased as a result of the reduced water releases and low flow under the Haditha Dam's quantity design. The intermediate lands in the research region emerged as a result of this.
The study calculated the amount of time needed for water to reach a specific height using the water balance equation and the data that was gathered. The water level rose from 147 meters to 154 meters in the least amount of time, 10.7 hours, in January. The longest brief time occurred in January and lasted 10.7 hours. Each month's data was displayed in graphs by the research.
A significant volume of flow was sent downstream in January to sustain the dam without any concerns, indicating a very urgent condition. HEC RAS was used to model the flood. About 15.4 km were covered by the wave 40 hours after the flood began.
Table 6. Predicted monthly outflow (m3/s) with respect to current elevation
|
Elevations |
January |
February |
March |
April |
|
147.5 |
661.2 |
641 |
440.3 |
245.6 |
|
148 |
662.2 |
640.8 |
438.9 |
238.9 |
|
148.5 |
663.0 |
640.6 |
437.4 |
232.2 |
|
149 |
663.9 |
640.3 |
435.9 |
225.4 |
|
149.5 |
664.7 |
640 |
434.4 |
218.7 |
|
150 |
665.5 |
639.7 |
432.9 |
212 |
|
150.5 |
666.3 |
639.4 |
431.4 |
205.2 |
|
151 |
667.1 |
639.1 |
429.9 |
198.5 |
|
151.5 |
667.9 |
638.7 |
428.4 |
191.8 |
|
152 |
668.7 |
638.4 |
426.9 |
185 |
|
152.5 |
669.5 |
638.1 |
425.4 |
178.3 |
|
153 |
670.3 |
637.8 |
423.9 |
171.6 |
|
153.5 |
671.1 |
637.5 |
422.4 |
164.8 |
|
154 |
671.9 |
637.1 |
420.8 |
158.1 |
Figure 4. Dam breach due to flood wave (time=40 hours)
When the rainfall increased, the overall load in the study region rose. This process causes large amounts of sediment to be transported across river cross-sections together with runoff water from the valleys. The amount of silt transported depends on a number of variables, including bed slop, the amount of water released from Haditha Dam, and the manning coefficient.
The spatial wavelength increase in the HEC RAS simulation occurs 10, 20, 30, and 40 hours after the initial bypass condition, covering 3.8, 5.1, 11.3, and 15.4 kilometers in length (Figure 4).
Flood control dams have two options: they may hold onto floodwater and use it for other reasons, or they can discharge floodwater downstream in regulated proportions. Flood control dams have two options: they may hold onto floodwater and use it for other reasons, or they can discharge floodwater downstream in regulated proportions. Dams not only provide safe drinking water and safeguard against increasing river and sea levels, but they also produce energy, supply irrigation water for farming, offer pleasant recreational areas, and improve the environment.
The factors that must be considered in selected dam are topography and geological conditions of Haditha dam site and the need to be able to cope with conditions of extreme flood. The value of sediment load of this study at selected station was not taken in consideration. The study's findings point to the necessity of having a more vigorous conversation about dams' detrimental effects on the environment and human well-being, including population relocation, altered water and sediment flows, and disruption of ecosystem services and means of subsistence.
The information covers monthly flow volumes towards the catchment region behind Haditha Dam, as well as the topographic behavior of the areas above and downstream. The research looked at the year-round impacts of evaporation and rainfall.
Water storage variations were evaluated all year round, with the greatest variations being noted in the early and late phases of the operative year. After then, the data is utilized for outflow analysis, which may help regulate dam operations more effectively and avoid floods. The catchment area's average water level has been established at 147 meters above sea level.
Based on the contour lines behind the dam, the study looked at how the catchment area's possible size increased. From a height of 147 meters to the summit of the dam, which is located at 154 meters, calculations of volume and surface area were performed. The study calculated the accessible surface area with regard to altitudes ranging from 147 to 154 meters by establishing a regression correlation.
The study calculated the amount of time needed for water to reach a specific height using the water balance equation and the data that was gathered. The water level rose from 147 meters to 154 meters in the least amount of time, 10.7 hours, in January. In the study, these temporal values were thought to be crucial for controlling flood hazards brought on by transgression. Using HEC-RAS software, flood simulations were run, and the results showed that 40 hours after incursion, a flood wave with a wavelength of around 15.4 km appeared.
[1] Sönmez, M.E., Kılıç, Z. (2014). Benefits of dams for the ecosystem: The sample of Karkamiş dam (Turkey). In 2nd International Conference-Water Resources and Wetlands, pp. 11-13.
[2] Abdullah, M., Al-Ansari, N., Laue, J. (2019). Water resources projects in Iraq: Medium and small storage dams. Journal of Earth Sciences and Geotechnical Engineering, 9(4): 283-289.
[3] Alsultani, R., Khassaf, S.I. (2022). Nonlinear dynamic response analysis of coastal pile foundation bridge pier subjected to current, wave and earthquake actions: As a model of civilian live. RES MILITARIS, 12(2): 6133-6148.
[4] Al-Ansari, N. (2021). Water resources of Iraq. Journal of Earth Sciences and Geotechnical Engineering, 11(2): 15-34. https://doi.org/10.47260/jesge/1122
[5] Adamo, N., Sissakian, V.K., Al-Ansari, N., Elagely, M., Knutsson, S., Laue, J. (2018). Comparative study of Mosul and Haditha dams in Iraq: Different construction materials contribute to different designs. Journal of Earth Sciences and Geotechnical Engineering, 8(2): 71-89.
[6] Arai, O., Baba, K., Hirose, T. (2009). Selection of type of dams and reservoirs. Water Storage, Transport, and Distribution, 1: 103. https://www.eolss.net/sample-chapters/c07/E2-12-01-03.pdf.
[7] Alsultani, R., Karim, I.R., Khassaf, S.I. (2022). Mathematical formulation using experimental study of hydrodynamic forces acting on substructures of coastal pile foundation bridges during earthquakes: As a model of human bridge protective. Resmilitaris, 12(2): 6802-6821.
[8] dos Anjos Luis, A., Cabral, P. (2021). Small dams/reservoirs site location analysis in a semi-arid region of Mozambique. International Soil and Water Conservation Research, 9(3): 381-393. https://doi.org/10.1016/j.iswcr.2021.02.002
[9] Lehner, B., Liermann, C.R., Revenga, C., Vörösmarty, C., Fekete, B., Crouzet, P., Döll, P., Endejan, M., Frenken, K., Magome, J., Nilsson, C., Robertson, J.C., Rödel, R., Sindorf, N., Wisser, D. (2011). High‐resolution mapping of the world's reservoirs and dams for sustainable river‐flow management. Frontiers in Ecology and the Environment, 9(9): 494-502. https://doi.org/10.1890/100125
[10] Alsultani, R., Karim, I.R., Khassaf, S.I. (2022). Dynamic response of deepwater pile foundation bridge piers under current-wave and earthquake excitation. Engineering and Technology Journal, 40(11): 1589-1604. http://doi.org/10.30684/etj.2022.135776.1285
[11] Sall, M., Poussin, J.C., Bossa, A.Y., Ndiaye, R., Cissé, M., Martin, D., Bader, J.C., Sultan, B., Ogilvie, A. (2020). Water constraints and flood-recession agriculture in the Senegal River Valley. Atmosphere, 11(11): 1192. https://doi.org/10.3390/atmos11111192
[12] Wang, Y., Tian, Y., Cao, Y. (2021). Dam siting: A review. Water, 13(15): 2080. https://doi.org/10.3390/w13152080
[13] Sissakian, V.K., Adamo, N., Al-Ansari, N., Leaue, J., Knutsson, S. (2021). Karstification problems in the haditha dam, West Iraq. UKH Journal of Science and Engineering, 5(1): 111-118. https://doi.org/10.25079/ukhjse.v5n1y2021.pp111-118
[14] Salahaldain, Z., Naimi, S., Alsultani, R. (2023). Estimation and analysis of building costs using artificial intelligence support vector machine. Mathematical Modelling of Engineering Problems, 10(2): 405-411. https://doi.org/10.18280/mmep.100203
[15] Dai, X. (2016). Dam site selection using an integrated method of AHP and GIS for decision making support in Bortala, Northwest China. Master's Thesis, University of Twente.
[16] Othman, A.A., Al-Maamar, A.F., Al-Manmi, D.A.M.A., Liesenberg, V., Hasan, S.E., Obaid, A.K., Al-Quraishi, A.M.F. (2020). GIS-based modeling for selection of dam sites in the Kurdistan Region, Iraq. ISPRS International Journal of Geo-Information, 9(4): 244. https://doi.org/10.3390/ijgi9040244
[17] Kim, J., Park, J., Jang, S., Kim, H., Kang, H. (2018). Improving reservoir operation criteria to stabilize water supplies in a multipurpose dam: Focused on Nakdong river basin in Korea. Water, 10(9): 1236. https://doi.org/10.3390/w10091236
[18] Deng, M.J. (2012). Ground reservoir: A new pattern of groundwater utilization in arid north-west China-a case study in Tailan River basin. Procedia Environmental Sciences, 13: 2210-2221. https://doi.org/10.1016/j.proenv.2012.01.210
[19] Hason, M.M., Abbas, M.R., Ahmad, B.B., Abbas, T.R. (2020). Monitoring of water surface change of Haditha dam’s lake using satellite data technique. In IOP Conference Series: Materials Science and Engineering. IOP Publishing, 928(2): 022018. https://doi.org/10.1088/1757-899X/928/2/022018
[20] Alfatlawi, T.J.M., Alsultani, R.A.A. (2019). Characterization of chloride penetration in hydraulic concrete structures exposed to different heads of seawater: Using hydraulic pressure tank. Engineering Science and Technology, An International Journal, 22(3): 939-946. https://doi.org/10.1016/j.jestch.2019.02.001
[21] Alsultani, R., Karim, I.R., Khassaf, S.I. (2023). Dynamic response analysis of coastal piled bridge pier subjected to current, wave and earthquake actions with different structure orientations. International Journal of Concrete Structures and Materials, 17(1): 9. https://doi.org/10.1186/s40069-022-00561-5
[22] Alfatlawi, T.J., Mansori, N.J., Alsultani, R.A. (2020). Stability assessment of diaphram cellular cofferdams subjected to severe hydro-structural conditions. The Open Civil Engineering Journal, 14(1): 44-55. http://doi.org/10.2174/1874149502014010044
[23] Alfatlawi, T.J., Alsultani, R.A. (2018). Numerical modeling for long term behavior of chloride penetration in hydraulic concrete structures. Global Scientific Journal of Civil Engineering, 1.
[24] Thair, J.M., Imad, A.D., Riyadh, A.A. (2018). Experimental determination and numerical validation of the chloride penetration in cracked hydraulic concrete structures exposed to severe marine environment. In IOP Conference Series: Materials Science and Engineering. IOP Publishing, 454(1): 012099. http://doi.org/10.1088/1757-899X/454/1/012099
[25] Alfatlawi, T.J.M., Alsultani, R.A.A. (2018). Determination of the degree of saturation and chloride penetration in cracked hydraulic concrete structures: Using developed electrical conductivity technique. Indian Journal of Science and Technology, 11: 37.
[26] Seyedi-Viand, S.M., Eseller-Bayat, E.E. (2021). An alternative empirical function to predict air-water mixture bulk modulus for numerical modeling of liquefaction behavior of induced partially saturated sands. Bulletin of Earthquake Engineering, 19(5): 1987-2011. https://doi.org/10.1007/s10518-021-01058-4
[27] Khan, M.S.A., Seyedi, M. (2023). Dynamic responses of embankment dams, constituted from varied soil types, to seismic activity. Acadlore Transactions on Geosciences, 2(3): 177-187. https://doi.org/10.56578/atg020305
[28] Alsultani, R., Khassaf, S.I. (2022). Nonlinear dynamic response analysis of coastal pile foundation bridge pier subjected to current, wave and earthquake actions: As a model of civilian live. Res Militaris, 12(2): 6133-6148.