Fitri Damayanti![]() | Eko Mulyanto Yuniarno
| Eko Mulyanto Yuniarno![]() | Yoyon Kusnendar Suprapto*
| Yoyon Kusnendar Suprapto*![]()
© 2024 The authors. This article is published by IIETA and is licensed under the CC BY 4.0 license (http://creativecommons.org/licenses/by/4.0/).
OPEN ACCESS
Manuscript binarization is used to convert each pixel in the script image into text and background. Many manuscript binarization methods have been proposed, such as the Otsu, Bernsen, Sauvola, Niblack, Phansalkar and Singh methods. These methods only focus on one problem of a degraded manuscript. In this research, a deep learning approach based on the U-Net method is applied for binarization of degraded ancient manuscripts. Adding layers to the U-Net architecture can cause more parameters and excessive computational calculations. Residual U-Net (ResUNet) is a development of the U-Net method. ResUNet, with its residual blocks, enables efficient and effective feature extraction, capturing fine details of degraded documents. This is important for identifying and distinguishing text from various artifacts and noise in the document. ResUNet can handle various types of image degradation thanks to its residual blocks that prevent gradient loss and strengthen features over the network. Convolutional Long Short-Term Memory (ConvLSTM) is a variant of LSTM (Long Short-Term Memory) designed for spatial data such as images. ConvLSTM combines the ability of LSTM to learn long-term dependencies with the power of CNN in processing spatial data. The combination of ResUNet and ConvLSTM for binarization of degraded documents is a powerful strategy that leverages the power of both architectures to improve quality and accuracy in separating text from degraded background. The aim of this research is to determine the performance evaluation results of the combination of ResUNet and ConvLSTM architectures on the binarization of degraded ancient Javanese manuscripts. The trial was conducted using datasets taken from several museums. The dataset consists of 1200 images of Javanese ancient manuscripts that were damaged in the form of perforated paper, ink bleed through from the previous page, and red or brownish spots. The proposed method produces a loss value of 0.0559, F-Measure 92.89%, PSNR 18.52 dan IoU 0.85.
ancient manuscript, binarization, ConvLSTM, degraded, Javanese, Residual U-Net
Extracting useful information from ancient manuscripts is a challenging problem because these ancient manuscripts usually undergo various degradations [1], such as faded ink, red or brown spots, perforated paper, translucent ink from previous pages, and paper crease marks, and crumpled paper [2]. For optimal performance, the majority of script analysis techniques require an input script that has been cleared of noise [3, 4]. Text and paper segmentation, known as binarization, pre-processing the manuscript analysis process. Script binarization is the process of separating each pixel of text (foreground) and background [1].
While other manuscript binarization techniques have been presented in the literature, the majority of them concentrate on a single issue, like thin or faded ink or red or brown blotches [5-7]. The simplest is the Otsu method [8], which is an automatic threshold selection technique for binary grayscale imagery that is nonparametric and requires no supervision. The computing complexity of this approach is linear since it uses a grayscale histogram to determine a global threshold (global thresholding) without prior knowledge. When it comes to degraded script images with non-uniform backgrounds, the Otsu technique performs poorly. However, it performs admirably on clean, uniform images. Local adaptive threshold techniques, including those by Sauvola and Pietikäinen [9], Niblack [10], Pai et al. [11], and AdOtsu [12, 13], have been presented as solutions to this issue.
Research that uses Javanese script as a dataset to image document binarization has been carried out by Mahandi et al. [14]. In this study using the local adaptive threshold method. This method produces good accuracy only for ancient manuscripts with ink bleed through from the previous page [14]. With F-Measure value of 91.211%, PSNR of 17.326 dB, DRD and MSE of 3.257 and 1.227, respectively. This method failed to perform the Javanese script and paper segmentation process for ancient manuscripts that contained spots or ancient manuscripts with perforated paper conditions.
Several studies that apply U-Net architecture for binarization in manuscripts have been carried out [15-18]. In research [15], the datasets used for the experiment were DIBCO, Nabuko, and LiveMemory. Research conducted by Kang et al. [16] in their experiments using the COCO-Text and DIBCO 2017 dataset. Limonova et al. [17] and Kang et al. [18] used the DIBCO dataset in their experiments. The U-Net architecture has a weakness in its small number of layers, so it is not enough to get a better performance increase from the existing layers [19]. Adding layers directly to the U-Net architecture can make the parameters used more and more, and computations are redundant, so the execution time during the training process is very long.
ResUNet is a development of the U-Net method. The advantages of ResUNet compared to U-Net mainly lie in the integration of residual blocks which provides some significant improvements in terms of architecture and performance, especially for applications requiring complex image processing. With residual blocks, ResUNet can extract features at multiple levels more effectively, which means it can capture more complex information from the processed image, thereby increasing accuracy in tasks such as image segmentation [20]. Research using the ResUNet architecture for segmentation has been done by Mique and Malicdem [21]. This research is applied in the field of lung segmentation. In addition, there is a study to predict the land cover semantic segmentation of satellite images using ResUNet, carried out by Pollatos et al. [22]. Another research in Road Extraction was carried out by Zhang et al. [20].
Convolutional Long Short-Term Memory (ConvLSTM) is a variant of LSTM (Long Short-Term Memory) designed for spatial data such as images. ConvLSTM combines the ability of LSTM to learn long-term dependencies with the power of CNN in processing spatial data. The ConvLSTM structure consists of four gates, namely input gate, forget gate, input modulation gate, and output gate. These four function to determine which information from the input image should be stored [23]. This architecture has a strong ability to store memory for a long period of time, so it can learn more features [24]. Several studies use the ConvLSTM architecture for segmentation, namely researches [25, 26]. This research is applied to cell segmentation.
Based on the advantages of each of the ResUNet and Convolutional LSTM architectures, this study combines the ResUNet and Convolutional LSTM architectures to obtain a new architecture that can produce better binarization in ancient manuscript by looking at the results of architectural performance evaluation based on F-Measure, PSNR and IoU. The contributions of this research are:
Part 1 of the introduction, which describes the research background and relevant research, is where the methodical writing process for this essay starts. Talking about the literature review in Section 2. The dataset and suggested methodology are covered in Section 3. How to perform assessment measurements is covered in Section 4. The results and discussion are explained in Section 5. The results and suggestions for further research are included in Section 6.
Within the previous two decades, research on document image binarization has been documented in the literature. Binarization aims to produce text or a background with two gray levels from each pixel in the provided document image. Semantic segmentation methods grounded in deep learning and conventional non-machine learning algorithms are the two main groups of document binarization methodologies. U-Net is one of the picture segmentation techniques utilized by the deep learning community. In 2015, U-Net was first created for image segmentation applications in the biomedical field. It makes use of an encoder-decoder structure, in which the original resolution image is returned by the decoder and features are extracted by the encoder. Unlike FCN, which uses the feature addition approach, U-Net uses connections to integrate up- and down-sampled feature maps in order to preserve more spatial information and dimensions. The effects of network fragmentation are exacerbated by this. Thus, the structure of U-Net is ideal for document image segmentation.
Using U-Net Architecture, Bezmaternykh et al. [15] introduced U-Net-bin, a CNN-based technique that took first place in the DIBCO '17 competition. Zhao et al. [27] suggested a binarization technique for old Tibetan writings based on Attentive U-Net. In order to accomplish end-to-end training on geometry rectification and document picture binarization, Ma et al. [28] combine U-Net and Transformer models. For this, they employ layered U-Net with intermediate control.
The U-Net paradigm serves as the foundation for the LinkNet network design, which was developed by Chaurasia and Culurciello [29]. Real-time data segmentation is possible with a lightweight network built on an encoder-decoder architecture. Based on the LinkNet and D-LinkNet models [30], Xiong et al. [31] introduced DP-LinkNet, an improved semantic segmentation model. In the middle of the design, they inserted a Hybrid Dilated Convolution (HDC) module to expand the receptive field and enhance the network's capacity to extract texture and detail from images. Moreover, a series of Spatial Planning Pyramids (SPP) have been utilized to enhance the comprehension of qualities at various granularities. The results of the experiment demonstrate that the suggested method maintains high speed and accuracy while performing well on document pictures with noise, including defects and blemishes. U-Net can often assist in processing document photographs by eliminating background noise and maintaining text information.
3.1 Dataset
A collection of damaged ancient Javanese manuscripts that they assembled themselves is used in this investigation. The information was obtained from the National Library (https://khastara.perpusnas.go.id), the Tamansiswa Dewantara Kirti Griya Museum, and the Mpu Tantular Museum in Surabaya. Three types of damage were included in the Javanese manuscript dataset utilized for this study: red or brown patches, bleed-through ink from the preceding page, and perforated paper.
The Tamansiswa Dewantara Kirti Griya Museum is located in Wirogunan, Mergangsan, Yogyakarta. Until 2015 this museum has a collection of more than 1000 ancient Javanese manuscripts [32]. From this museum, several ancient Javanese manuscripts were used in the research, namely Serat Candrarini, Babul Jinazati, the first volume of the Babad Surakarta, and Serat Phurwa Wasana.
Serat Candrarini is an ancient manuscript published in 1939 consisting of 28 pages. The condition of this manuscript is damaged in the form of spots on the paper. Babul Jinazati is an ancient manuscript consisting of 39 pages and is damaged like Serat Candrarini. The first volume of the Babad Surakarta is an ancient Javanese manuscript consisting of 165 pages. This manuscript was damaged in the form of perforated paper, so that some Javanese characters were lost in writing. Serat Phurwa Wasana consists of 69 pages and was published in 1924. This ancient manuscript was damaged, namely there were holes in the paper.
The Mpu Tantular Museum is located in Buduran, Sidoarjo. This museum has a collection of 629 manuscripts. Several collections of Javanese ancient manuscripts in this museum were damaged in the form of spots on the paper that covered some of the characters and some even covered all of the characters. One of the manuscripts with this condition is the Story of the Prophets.
In this study, some of the datasets that were created used ancient texts belonging to individuals. The manuscript is damaged by a hole in the paper. The dataset used in this study was also taken from the digital collection belonging to the National Library. The manuscripts are BR608 Babad Sengkala, Serat Lampahan Ringgit Purwa Jaya Pustaka, NB285 Babad Sengkala and NB986 Babad Tanah Jawi. All of these ancient manuscripts were damaged by the condition of ink bleed through from the previous page. Table 1 details the collection of the source dataset, the old Javanese manuscript's title, and the extent of the manuscript's degradation.
The dataset was obtained from taking photos of ancient manuscript paper pages using a Canon EOS 1000D DSLR camera in the RGB color model. The method for capturing images of ancient manuscripts uses a cube box with box-shaped lighting on each side of the top of the cube. Lighting comes from LED strip lights with a diffuser on the surface, so that the light emitted is softer when it reaches the object to be photographed. Apart from that, to reflect light well, reflectors in the form of white cloth are used on each side of the cube. This reflector and lighting are used to reduce differences in light intensity that appear in the image taken. Therefore, image capture does not use a flash or flash light.
The image is taken from above the paper or perpendicular to the position of the ancient manuscript page. The distance for taking images varies, depending on the size of the manuscript and the size of the letters. However, the distance between each page is taken the same for each type of manuscript. After obtaining the image of the ancient manuscript, cutting is carried out in the desired area, namely the image area which represents the writing area on the ancient manuscript paper. The area resulting from this cutting is a new image that is used as a dataset.
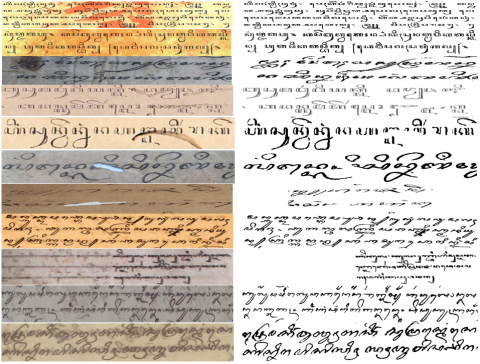
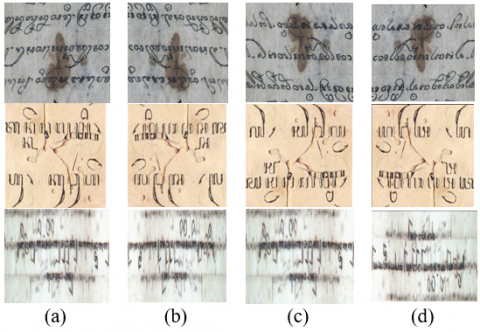
Using the image processing program GIMP (GNU Image Manipulation Program), the manuscripts were manually ground-truthed. An archaeologist verified this ground truth. Several ancient Javanese manuscripts that served as ground truth and datasets are depicted in Figure 1. The ground truth takes the shape of a binary script, with the background being white paper and the Javanese script taking the form of black-colored pixels.
Table 1. Dataset source
|
Script Condition |
Script Title |
Dataset Source |
|
Spots |
Serat candrarini |
Tamansiswa dewantara kirti griya |
|
Spots |
Babul jinazati |
Tamansiswa dewantara kirti griya |
|
Spots |
The story of the prophets |
Mpu tantular |
|
Perforated paper |
Babad surakarta |
Tamansiswa dewantara kirti griya |
|
Perforated paper |
Serat purwa wasana |
Tamansiswa dewantara kirti griya |
|
Perforated paper |
The untitled fiber manuscript |
Owned by individuals |
|
Perforated paper |
The story of the prophets |
Mpu tantular |
|
Ink bleed through from the previous page |
BR608 babad sengkala |
National library |
|
Ink bleed through from the previous page |
Serat lampahan ringgit purwa jaya pustaka |
National library |
|
Ink bleed through from the previous page |
NB285 babad sengkala |
National library |
|
Ink bleed through from the previous page |
Babad demak no 07.33 M |
Mpu tantular |
|
Ink bleed through from the previous page |
NB986 babad tanah jawi |
National library |
3.2 U-Net
U-Net developed from the conventional convolutional neural network, which Ronneberger, Fischer, and Brox initially created and used for biomedical image segmentation in 2015 [33]. There are two lanes and symmetry in the architecture. The first pathway is created via a general convolutional procedure and is known as the contraction pathway (also known as the encoder). This route is employed to obtain the image's context. A flipped 2d convolutional layer (up-sampling approach) forms the second path, which is a symmetric expansion path, also known as a decoder.
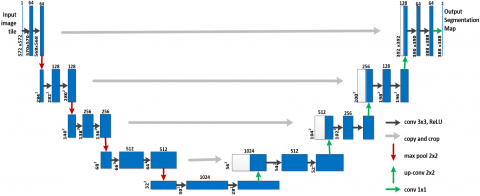
In the U-Net design, two 3×3 convolutional layers are frequently employed, with ReLU activation occurring after each one. Deep neural networks run more swiftly and steadily when batch normalization is used to normalize the input layer between the convolutional layer and ReLU. This architecture includes an encoder mechanism consisting of a convolutional layer with max pooling. In addition to the encoder process, this architecture also has a decoder process. The decoder approach consists of two steps: upsampling (convolutional transposition) and concatenation of the up-sampled results with the output of the previous convolutional layer. The general U-Net architecture is seen in Figure 2.
3.3 Residual blocks
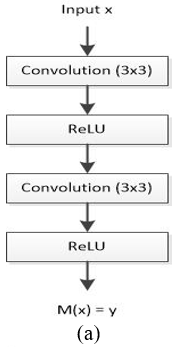
The information flow inside the network is enhanced via residual approaches. Furthermore, recast the layer in relation to the input layer as a learning residual function. As a result, it resolves the issue of a deeper network's degradation [34]. As seen in Figure 3, the deep residual network is composed of a series of block residuals, each of which is made up of stacked layers such batch normalization (BN), ReLU activation, and convolutional layers.
The neural network block is shown in Figure 3(a), where the input to the network is denoted by x. The true underlying distribution is denoted by M(x) [35]. The model studies the mapping from input x to output y and can be represented according to Eq. (1):
M(x)=y (1)
The residual function F(x) takes advantage of the difference between the mapping applied to x (i.e. M(x)) and the original input x. Which is shown in Eqs. (2) and (3):
$F(x)=M(x)-x$ (2)
$M(x)=F(x)+x$ (3)
The F(x)+x formulation in Eq. (3) can be realized using a feedforward neural network with “shortcut connections”, which is shown in Figure 3(b).
Figure 1. Javanese manuscripts as datasets and ground truth
Figure 2. U-Net architecture
Figure 3. (a) Conventional feed-forward neural network used in U-Net; (b) The residual blocks consist of the identity map used in ResUNet
3.4 Residual U-Net
ResUNet is an artificial neural network architecture that is a combination of two important architectures in deep learning: U-Net and ResNet. This architecture is specifically designed for image segmentation tasks, where the goal is to classify each pixel in an image into a specific category. ResUNet components consist of [20]:
1. U-Net: U-Net is a network architecture that has a U shape and is specifically designed for image segmentation. This architecture has two main parts: the contraction part (encoders) and the expansion part (decoders). In the shrinkage part, the image is split into features at different scale levels through convolution and pooling operations. Meanwhile, in the expansion section, the compressed information is expanded again to build segmentation output with good detail.
2. ResNet: Residual Network (ResNet) is a type of network architecture that implements residual blocks to overcome the problem of vanishing gradients that can occur in very deep neural networks. Residual blocks allow activation to be passed through the network via shortcut connections, effectively allowing gradients to flow through the network without experiencing significant degradation.
3. Combination of U-Net and ResNet: In ResUNet, the residual blocks of ResNet are integrated into the U-Net architecture. Thus, in the encoder section, residual blocks are used to capture features more efficiently, while the decoder section uses up-sampling and convolution to reconstruct the segmentation image. This integration allows ResUNet to learn deeper and more complex representations, which is especially useful in image segmentation tasks that require high detail and good accuracy.
Integration of ResNet features into U-Net brings several benefits, including improved generalization capabilities, efficiency in learning feature representations at various levels of depth, and improvements in retaining important contextual information during the segmentation process. ResUNet has demonstrated excellent performance in a variety of segmentation applications.
3.5 Convolutional Long Short-Term Memory
Convolutional LSTM (ConvLSTM) is a variation of Long Short-Term Memory (LSTM) designed specifically for spatial data. In contrast to traditional LSTMs that receive input and perform operations in vector form (1D), ConvLSTM operates on data in matrix form (2D) or higher, which makes it very suitable for data such as images or videos.
In ConvLSTM, the operations usually performed by LSTM through matrix multiplication are replaced with convolution operations. This means that the gates in the LSTM (input gate, forget gate, output gate, and cell state) perform convolution on their inputs, open matrix multiplication. The goal is to maintain spatial information from input which is characteristic of image or video data [25].
In more detail, ConvLSTM has several main components:
3.6 Proposed method
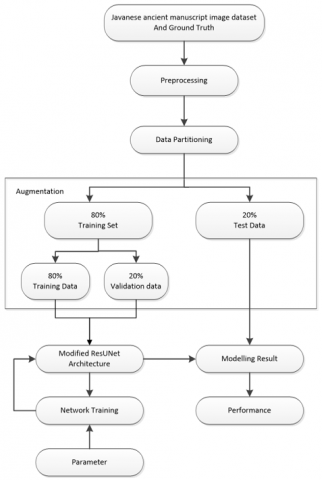
The proposed method for binarization in degraded Javanese ancient manuscripts consists of several stages. This stage starts from creating an image dataset of Javanese ancient manuscripts and ground truth. Resize is used in the pre-processing stage to determine the size of the image used as input. Then change the image format from RGB to grayscale. To conduct training, the dataset is divided into three parts, namely training data, validation data and test data. Previously, the dataset was carried out by the data augmentation process. The ResUNet modification training process begins by setting parameters, such as the number of epochs, learning rate, filter size, and batch size. This process produces an optimal model, which will then be used to calculate the performance value of the segmentation accuracy of Javanese script and paper in ancient manuscripts. Figure 4 is a block diagram of the processes carried out in this study.
Figure 4. Block diagram of research carried out
ResUNet, with its residual blocks, enables efficient and effective feature extraction, capturing fine details of degraded documents. This is important for identifying and distinguishing text from various artifacts and noise in the document. The U-Net architecture in ResUNet facilitates the segmentation process with an encoder-decoder architecture. The encoder is responsible for extracting features at various levels, while the decoder combines these features to produce an accurate segmentation map. The integration of residual learning helps in overcoming the vanishing gradient problem, allowing the model to more deeply and accurately learn complex features from degraded documents.
Once ResUNet generates an initial segmentation map, ConvLSTM takes over to analyze the data more contextually and temporally. ConvLSTM can capture spatial relationships and sequence information in images, which is crucial for understanding the structure and consistency of text in documents. ConvLSTM processes the output from ResUNet to refine the segmentation map, reduce errors and ambiguity in segmentation, and improve separation between text and background. The combination of ResUNet and ConvLSTM produces sharper and more accurate binary images, where text is clearly separated from the background, even in highly degraded document conditions.
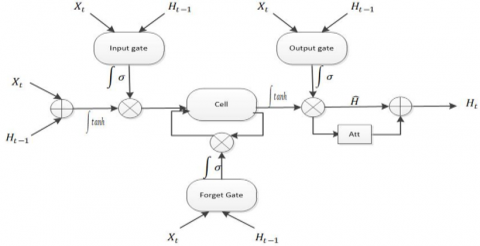
Our approach, using Convolutional LSTM on the ResUnet decoder section. The essence of Convolutional LSTM is the same as LSTM. The difference is that Convolutional LSTM adds a convolution operation. It can not only get the timing relationship, but also extract spatial features like a convolutional layer. Convolutional LSTM consists of an input gate, an output gate, a forget gate, and a cell, as shown in Figure 5. Convolutional LSTM is represented in Eqs. (4)-(8) [23], where X is input, C is cell output, H is hidden state, it is input gate, ftis forget gate, otis output gate, σ is logistic function, * is convolution operator and o is Hadamard product operator. W denotes the weights. b denotes the biases.
Figure 6 shows the architecture of the method used in this research. This architecture consists of three parts, namely encoding, bridge, and decoding. The first part encodes the input image into compact representations. The last part recovers the representations to a pixel-wise categorization, i.e. semantic segmentation. The middle part serves like a bridge connecting the encoding and decoding paths. The encoding section receives input in the form of degraded Javanese script manuscripts in RGB format. The encoder uses convolutional filters to detect basic features such as edges and texture. As the depth of the network increases, deeper layers are able to extract increasingly complex and abstract features, representing further spatial information of the objects in the image. At each stage in the encoder section, there are residual blocks. This block consists of several convolutional layers with a ReLU activation function, followed by a batch normalization operation. The ResUNet encoder integrates residual blocks, which allows direct information flow through bypass connections, ensuring that important information is not lost during the training process. This is helpful in maintaining the integrity of spatial features throughout the network. A shortcut connection that adds a block's input to its output, helps reduce the problem of vanishing gradients. After the residual blocks are processed, MaxPooling performs downsampling of the feature map, which reduces its resolution while retaining important information. This process helps consolidate spatial information and allows the network to capture a broader context of the image using fewer parameters. Downsampling and residual block structure improve computational efficiency and reduce the risk of overfitting by limiting the number of parameters. This allows the model to generalize better to never-before-seen data. Thus, the encoder in ResUNet plays a critical role in generating a rich and layered spatial feature representation of the input image, which will later be used by the decoder for the enlargement and restoration process. In this study, four residual blocks were used in the encoder section.
Between the encoder and decoder parts, there is a bridge consisting of one residual block. This section aims to process features at the lowest resolution before starting the upsampling process on the decoder. The decoder uses upsampling or transposed convolution operations to increase the spatial dimensions of the map features. Each upsampling stage is followed by a concatenate process of the corresponding encoder layer, where the feature map from the encoder is connected directly to the decoder. This helps in recovering spatial information that may be lost during downsampling. Concatenation combines local and global context which is used to refine and deepen relevant features. After the relevant features have been condensed, convolutional LSTM then operates on data that has combined spatial information from various levels of depth and detail. Convolutional LSTM extracts and processes the temporal or sequential dependencies of these features. In document binarization, through a gate mechanism (forget, input, and output gate), convolutional LSTM decides which information or features need to be maintained, updated, or ignored, so that modeling becomes effective against document degradation. In the context of document binarization, forget gates can help models ignore irrelevant details or noise from degraded documents. The input gate determines what new information will be added to the memory cell. This allows the model to decide which new features, such as character edges or certain patterns, need to be updated or added to memory based on the latest data. In the binarization process, output gating allows the model to select important features that should be retained in the final output, ensuring that important details, such as characters are retained clearly. Shown in red blocks in Figure 6. This is the part that differentiates it from the original ResUNet architecture. After LSTM convolutional processing, the model then continues to process the block residuals in the decoder. The input to the residual block in the decoder is the features resulting from the LSTM convolutional process. The block residuals include convolution layers, batch normalization, and ReLU activation functions. The goal is to enhance and smooth these features, ensuring smooth transitions and accurate restoration of detail. The decoder uses four residual blocks. After the last level of decoding path, a 1×1 convolution and a sigmoid activation layer is used to project the multi-channel feature maps into binary image.
$C_t=f_t \, o \, C_{t-1}+i_t o \tanh \left(W_{x c} * X_t+W_{h c} * H_{t-1}+b_c\right)$ (4)
$f_t=\sigma\left(W_{x f} * X_t+W_{h f} * H_{t-1}+W_{c f}\right. \, o \, \left.C_{t-1}+b_f\right)$ (5)
$o_t=\sigma\left(W_{x o} * X_t+W_{h o} * H_{t-1}+W_{c o} \, o \, C_t+b_o\right)$ (6)
$i_t=\sigma\left(W_{x i} * X_t+W_{h i} * H_{t-1}+W_{c i} \, o \, C_{t-1}+b_i\right)$ (7)
$H_t=o_t \, o \, \tanh \left(C_t\right)$ (8)
Figure 5. Convolutional LSTM which consists of input gate, forget gate, output gate, and cell
The evaluation metrics used in this study are:
(i) F-Measure (FM)
The F-Measure is an accuracy test statistic that is based on recall values and precision. Precision and recall scores are impacted by True Positive (TP), False Positive (FP), and False Negative (FN) values [36]. In this study, the phrases "True Positive," "False Positive," and "False Negative" are used to denote how foreground, background, and foreground pixels are classified as such, respectively. The F-Measure (FM) formula is found in Eq. (9), while the precision and recall formulas are found in Eqs. (10) and (11).
$F M=\frac{2 \times \text { Recall } \times \text { Precision }}{\text { Recall }+ \text { Precision }}$ (9)
$Precision =\frac{T P}{T P+F P}$ (10)
$ Recall =\frac{T P}{T P+F N}$ (11)
(ii) Peak Signal to Noise Ratio (PSNR)
The PSNR is a metric used to quantify how uniform an image is with respect to the reference image [36]. An image's similarity to the reference image increases with its PSNR value. Eq. (13), where C is the image's maximum pixel value, can be used to compute PSNR. The MSE (Mean Square Error) number is needed to compute the PSNR. The squared error number resulting from all observed pixels is known as the Mean Square Error, or MSE. You may see the MSE formula in Eq. (12).
$M S E=\frac{\sum_{x=1}^M \sum_{y=1}^N\left(e_{(x, y)}\right)^2}{M N}$ (12)
$P S N R=10 \log _{10}\left(\frac{C^2}{M S E}\right)$ (13)
(iii) Intersection over Unit (IoU)
The Intersection over Union (IoU) function is a commonly used metric in the field of computer vision, especially in object detection and segmentation tasks. IoU measures the agreement between two sets of areas: predictions generated by the model (A) and ground truth (B) [37]. This function is very important for evaluating how well a model is at predicting the location and size of objects compared to ground truth. The IoU formula can be seen in Eq. (14).
$\operatorname{IoU}(A, B)=\frac{(A \cap B)}{(A \cup B)}$ (14)
The IoU value ranges from 0 to 1. A value of 0 indicates no agreement at all (no overlap), while a value of 1 indicates perfect agreement (prediction and ground truth coincide perfectly). In object segmentation, IoU can be used to measure how accurately the model can identify pixels that are part of a particular object.
Figure 6. The architecture of the proposed method
5.1 Data augmentation
Data Augmentation is a technique used to increase the amount of data by adding slightly modified copies of existing data. Experiments conducted by Jia et al. [38] showed that the application of data augmentation to the dataset can improve the accuracy of the network model. Based on the successful implementation of the data augmentation, this study uses data augmentation on the initial dataset which consists of 300 images from Javanese ancient manuscripts (100 images with red or brown spots, 100 images with perforated paper conditions, and 100 images with ink bleed through from the previous page).
This study uses commonly used data augmentation methods, such as horizontal flip, vertical flip, and rotation. After data augmentation was performed, the number of datasets used in this study was 1200 images (400 images with red or brown spots, 400 images with perforated paper, and 400 images with ink bleed through from the previous page from the previous page). Figure 7 shows some images of the initial dataset and images of the results of data augmentation.
Figure 7. Dataset augmentation: (a) Original image; (b) Horizontal flip image; (c) Vertical flip image; (d) Rotation image
5.2 Experiment scenario
To measure the performance of the method, three groups of datasets were used and two scenarios were used. The grouping of datasets and specifications for the number of datasets used in this study are shown in Table 2. The dataset consists of three groups. The first dataset contains images from Javanese ancient manuscripts with the condition that there are red or brown spots, namely spots. The second group dataset uses images from Javanese ancient manuscripts with perforated paper conditions, namely perforated paper. While the third group dataset uses images from Javanese ancient manuscripts with the ink bleed through from the previous page, namely ink bleed. Sampling was carried out without return to obtain random data for training, validation, and testing.
The experiments were all implemented using Python scripts running on Google Colab Professional. Training procedures were conducted in the Windows system with NVIDIA Intel Core i5 laptop. Selection of hyperparameter values (optimizer, filter size, learning rate, epoch and batch size) by carrying out several trials. Accuracy results were obtained using maximum PSNR, F-Measure, and IoU, which were used as hyperparameter settings. This research was trained using the Adam optimizer with a batch size of 8. Using several filter sizes for convolution in the encoder and decoder sections, namely 32, 64, 128, 256 and 512. The learning rate used was 0.0001. Using epoch 100 and the ratio between training data and test data is 80% and 20%.
In the first scenario, each group of datasets was experimented with using the proposed method with several hyperparameters shown in Table 3. In the first scenario, experiments were also carried out on combining datasets from the three groups (spots, holes and ink bleeds). The second scenario is to compare the performance of the ResUNet-ConvLSTM method (proposed method) with traditional methods (Otsu, Niblack, Sauvola). In addition to comparing with the traditional method, the ResUNet-ConvLSTM method is also compared with the U-Net, UNet-ConvLSTM, and ResUNet methods to measure the performance of binarization results in degraded Javanese ancient manuscripts. Comparative methods, namely U-Net, UNet-ConvLSTM, ResUNet also use hyperparameters shown in Table 3.
Table 2. Distribution dataset for experimental scenarios
|
Proses |
Spots |
Perforated Paper |
Ink Bleed |
|
Training |
256 |
256 |
256 |
|
Validation |
64 |
64 |
64 |
|
Testing |
80 |
80 |
80 |
|
Total |
400 |
400 |
400 |
Table 3. Hyperparameter
|
Factor(s) |
Values |
|
Optimizer |
Adam |
|
Filter Size |
32, 64, 128, 256, 512 |
|
Learning Rate |
1×10⁻⁴ |
|
Epoch |
100 |
|
Batch Size |
8 |
5.3 Experiment results
5.3.1 First scenario experiment results
The experimental results in the first scenario, namely the Loss, F-Measure and PSNR values in the three dataset groups and also the combination of the three datasets can be seen in Table 4. In Table 4 shows that the Loss, F-Measure and PSNR values of the ResUNet-ConvLSTM method in the dataset spots of 0.0875, 92.84% and 17.65. In the perforated dataset the Loss value is 0.1038, the F-Measure value is 90.75% and the PSNR value is 17.05. Loss, F-Measure, and PSNR values in the ink bleed dataset were 0.0794, 92.79% and 18.36. And in the combined dataset the Loss value is 0.0559, the F-Measure value is 92.89% and the PSNR value is 18.52. Here it shows that the F-Measure value generated in the three datasets and the combined dataset is quite high, which is above 90%.
Table 4. Experimental results in the first scenario
|
Dataset |
Accuracy |
||
|
Loss |
F-Measure |
PSNR |
|
|
Spots |
0.0875 |
92.84% |
17.65 |
|
Perforated paper |
0.1038 |
90.75% |
17.05 |
|
Ink bleed |
0.0794 |
92.79% |
18.36 |
|
Combined |
0.0559 |
92.89% |
18.52 |
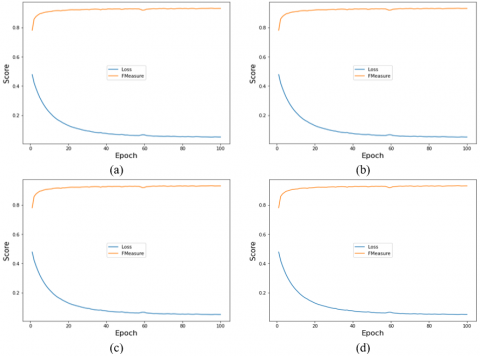
Figure 8. Comparison graph of F-Measure and loss of training results: (a) First dataset (spots); (b) Second dataset (perforated); (c) Third dataset (ink bleeds); (d) Combined dataset
Figure 8 shows a comparison graph of the F-Measure and Loss of the experimental results carried out on the three dataset groups and also the combination of the three datasets. Figure 8(a) training results from the first dataset (spots), Figure 8(b) training results from the second dataset (perforated), Figure 8(c) training results from the third dataset (ink bleed), and Figure 8(d) training results from the combination of the three datasets.
The four graphs in Figure 8 have the same characteristics. The loss value decreases gradually up to the 100th iteration. The F-Measure value increases significantly when a new iteration starts, and in the 2nd iteration the value will increase gradually until the last iteration. Neither the loss value nor the F-Measure value has decreased and increased significantly and repeatedly. Based on Table 4 and Figure 8, it can be concluded that the experiment for the combined dataset (having several variations and a large amount of data) resulted in the accuracy of the F-Measure, the highest PSNR, and the lowest Loss value.
5.3.2 Second scenario experiment results
In the second scenario, the number of trainable parameters used in each deep learning method is shown in Table 5. The U-Net method uses 14,326,275 trainable parameters, the UNet-ConvLSTM method uses 18,843,491 trainable parameters. The ResUNet method uses the least trainable parameters among the other three methods, which is 10,513,897. While the ResUNat-ConvLSTM method uses a trainable parameter of 15,889,225. The use of trainable parameters in the ResUNet-ConvLSTM method is less than the UNet-ConvLSTM method.
In deteriorated Javanese ancient manuscripts with red or brown stains, Table 6 compares the performance of the ResUNet-ConvLSTM approach with traditional methods (Otsu, Niblack, Sauvola) and Deep Learning methods (U-Net, UNet-ConvLSTM, ResUNet) for binarization. A comparison of the method's performance on old manuscripts with perforated paper conditions is presented in Table 7. Table 8, on the other hand, compares how well the technique performed on old manuscripts that had ink flow through from the previous page. Table 9 compares the ResUNet-ConvLSTM method's performance with that of the U-Net, UNet-ConvLSTM, and ResUNet techniques using a combination of the third dataset, as well as with classic approaches (Otsu, Niblack, Sauvola).
Table 5. Number of trainable parameters
|
Method |
Trainable Parameter |
|
U-Net |
14,326,275 |
|
UNet-ConvLSTM |
18,843,491 |
|
ResUNet |
10,513,897 |
|
ResUNet-ConvLSTM |
15,889,225 |
Table 6. The proposed method and previous related comparison on ancient manuscripts spotting
|
Method |
F-Measure |
PSNR |
IoU |
|
|
Traditional |
Otsu [8] |
60.96% |
12.75 |
0.45 |
|
Niblack [10] |
67.05% |
15.49 |
0.51 |
|
|
Sauvola [9] |
65.09% |
13.92 |
0.47 |
|
|
Deep Learning |
U-Net [33] |
90.07% |
17.31 |
0.69 |
|
UNet-ConvLSTM |
91.74% |
17.61 |
0.70 |
|
|
ResUNet [21] |
91.45% |
17.36 |
0.69 |
|
|
ResUNet-ConvLSTM (Proposed Method) |
92.84% |
17.65 |
0.71 |
|
Table 7. The proposed method and previous related comparison on perforated paper ancient manuscripts
|
Method |
F-Measure |
PSNR |
IoU |
|
|
Traditional |
Otsu [8] |
74.31% |
11.11 |
0.59 |
|
Niblack [10] |
83.41% |
14.50 |
0.61 |
|
|
Sauvola and Pietikäinen [9] |
81.59% |
13.53 |
0.60 |
|
|
Deep Learning |
U-Net [33] |
86.87% |
15.31 |
0.63 |
|
UNet-ConvLSTM |
89.03% |
16.53 |
0.64 |
|
|
ResUNet [21] |
88.05% |
15.69 |
0.64 |
|
|
ResUNet-ConvLSTM (Proposed Method) |
90.75% |
17.05 |
0.66 |
|
Table 8. The proposed method and previous related comparison on ink bleed ancient manuscripts
|
Method |
F-Measure |
PSNR |
IoU |
|
|
Traditional |
Otsu [8] |
58.15% |
13.12 |
0.43 |
|
Niblack [10] |
78.18% |
14.26 |
0.63 |
|
|
Sauvola [9] |
65.09% |
13.43 |
0.55 |
|
|
Deep Learning |
U-Net [33] |
91.21% |
17.49 |
0.65 |
|
UNet-ConvLSTM |
92.42% |
17.99 |
0.67 |
|
|
ResUNet [21] |
92.27% |
17.79 |
0.66 |
|
|
ResUNet-ConvLSTM (Proposed Method) |
92.79% |
18.36 |
0.68 |
|
Table 9. The proposed method and previous related comparison on the combined dataset
|
Method |
F-Measure |
PSNR |
IoU |
|
|
Traditional |
Otsu [8] |
62.45% |
14.12 |
0.54 |
|
Niblack [10] |
78.68% |
15.26 |
0.67 |
|
|
Sauvola [9] |
69.59% |
14.43 |
0.61 |
|
|
Deep Learning |
U-Net [33] |
90.82% |
17.89 |
0.79 |
|
UNet-ConvLSTM |
91.27% |
18.04 |
0.82 |
|
|
ResUNet [21] |
91.13% |
18.03 |
0.80 |
|
|
ResUNet-ConvLSTM (Proposed Method) |
92.89% |
18.52 |
0.85 |
|
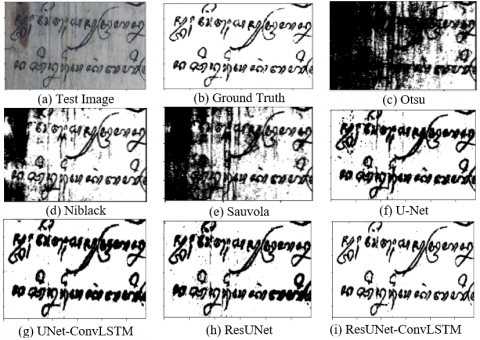
Figure 9. Image comparison of the ResUNet-ConvLSTM method's predicted outcomes with comparative approaches on ancient manuscripts with spots
From the four tables of performance comparisons between the ResUNet-ConvLSTM method (proposed method) and previous methods, it shows that the traditional thresholding method (Otsu, Niblack, and Sauvola) has lower F-Measure, PSNR, and IoU values compared to Deep Learning method (U-Net, UNet-ConvLSTM, ResUNet).
Figure 9, Figure 10, and Figure 11 show the experimental results of the ResUNet-ConvLSTM method with traditional thresholding methods (Otsu, Niblack, Sauvola) and U-Net, UNet-ConvLSTM, ResUNet methods. The images demonstrate that, when compared to the comparable approaches, the ResUNet-ConvLSTM method yields the best predicted image. Figures 9(c)-(e) demonstrate that the blots are regarded as objects or characters; the characters covered in blotches are rendered invisible by black dots. Paper folds are also considered characters. In Figures 9(f)-(h) the spots on the paper are gone, but the folds of paper are considered as objects that cause noise. Whereas in Figure 9(i) the spots on the paper are missing and the folded paper is not considered an object. It can be seen that Figure 9(i) is close to the ground truth, this is because ResUNet helps map complex features of degraded documents more effectively. Additionally, ConvLSTM can utilize spatial and temporal contextual information to make more informed decisions about whether a pixel should be white or black, especially in dealing with areas that have spots or noise. From Figure 9(i), it can be seen that the ResUNet-ConvLSTM method is able to binarization in degraded Javanese ancient manuscript with spotting conditions.
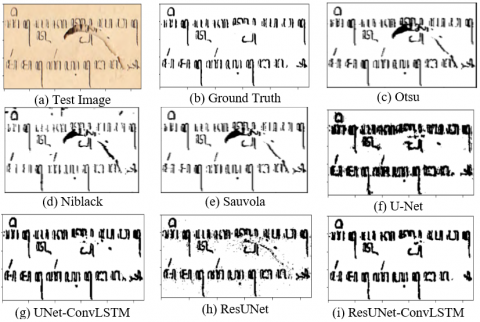
Figure 10. Image comparison of the ResUNet-ConvLSTM method's predicted outcomes with comparative approaches on ancient manuscripts with perforated paper
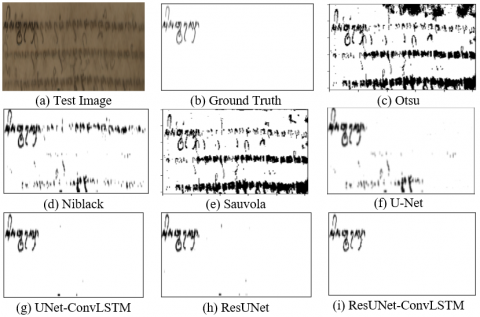
Figure 11. Image comparison of the ResUNet-ConvLSTM method's predicted outcomes with comparative approaches on ancient manuscripts with ink bleed conditions
The anticipated picture in the instance of the perforated text displaying black in the paper hole, as determined by the Otsu, Niblack, and Sauvola procedures. Figures 10(c)-(e) depict this. Therefore, these techniques are unsuitable for finishing the division of paper and Javanese script. The hole in Figure 10(f) appears to be missing from the paper and is regarded as the backdrop. However, in Figure 10(f) the letters become thicker, resulting in unclear characters. Figures 10(g) and (h) show that the holes in the paper are not visible, but there are still traces of the holes in the paper. Figure 10(i) shows the disappearance of the hole marks and the characters are clearly visible. In the case of paper holes, ResUNet can effectively differentiate between text and holes by identifying the specific contours and textures associated with the damage. Additionally, ConvLSTM helps differentiate between text areas that are disjointed due to holes and actual text, facilitating more accurate reconstruction of damaged document areas.
The ResUNet-ConvLSTM approach predicts an image better than the Otsu, Niblack, Sauvola, U-Net, UNetConvLSTM, and ResUNet methods in manuscripts with ink bleeds. This condition can be seen in Figure 11. In Figures 11(c)-(h), it can be seen that there are still spots that are ink bleed through from the previous page. In Figure 11(i) ink bleeds from the previous page is not visible. So that in Figure 11(i) it produces a clearly visible segmentation between foreground and background. The object or character is black, and the paper or background is white. This is because ResUNet takes important features from degraded documents and maps their local and global contexts. With its ability to capture details at multiple levels, ResUNet is effective for identifying degraded text regions. Next, the output from ResUNet can be fed into ConvLSTM. By leveraging ConvLSTM, the system can understand changes and spatial relationships between parts of a document that are affected by penetrating ink, enabling more accurate predictions about which parts should be binarized.
Binarization of degraded documents has very broad and important applications in the real world, especially in the fields of information digitization, archive management, and document image processing. Some examples of practical use of binarization of degraded documents, namely: institutions such as libraries, museums and national archives have large collections of documents that have degraded due to age or storage conditions. Binarization helps in the process of digitizing these documents, ensuring that the documents can be stored in digital format for long-term access and preservation. To convert text contained in document images into editable and searchable text, automatic text recognition (OCR) processes often require a binarization stage to improve recognition accuracy. Degraded documents can be very challenging for OCR. In efforts to restore historical or important documents that have experienced degradation, binarization is a crucial first step. This helps in clarifying and separating the text from damage or blemishes, allowing the restoration process to be carried out more effectively. In the humanities, binarization helps researchers access and analyze historical or linguistic documents that are not in optimal condition, facilitating the study of history, language, and culture.
The procedure of binarization used on ancient, deteriorating Javanese manuscripts is the main subject of this study. Using a self-created dataset of ancient Javanese manuscripts having holes in them, ink leaking to the following page, and red or brown stains, the attempt was made. In this article, ResUNet combined with Convolutional LSTM is used to study and evaluate the binarization process. ResUNet analyzes the document picture first in this combination, extracting significant features, then ConvLSTM processes those features to comprehend the wider spatial context and make more accurate and well-informed binarization judgments. This means that the model determines whether a pixel belongs in the text or background for each component of the document by using not just local information (from ResUNet) but also the larger context and relationships between parts (with the aid of ConvLSTM). The test results show the system's accuracy in binarizing old, deteriorating Javanese texts. The PSNR is 18,52, the loss value is 0,0559, the F-Measure is 92,89%, and IoU is 0,85. The recommended technique, ResUNet-ConvLSTM, fared better in terms of F-Measure value than the other ways (Otsu, Niblack, Sauvola, U-Net, ResUNet, UNet-ConvLSTM).
The developed model must be evaluated in more ancient manuscripts with different types of damage, such as altered contrast, fading ink, and uneven lighting at the time of data collection, in order to support future research. Before binarization in ancient texts, picture quality improvement procedures could be added to increase accuracy outcomes.
We are grateful for the support of the research from the Education Fund Management Institute (LPDP), the Mpu Tantular Museum in Surabaya, the Tamansiswa Dewantara Kirti Griya Museum in Yogyakarta, the Ministry of Finance of the Republic of Indonesia, and the Ministry of Education, Culture, Research and Technology of the Republic of Indonesia. The BUDI DN-2019 Scholarship is used for this.
[1] Ntirogiannis, K., Gatos, B., Pratikakis, I. (2013). Performance evaluation methodology for historical document image binarization. IEEE Transactions on Image Processing, 22(2): 595-609. https://doi.org/10.1109/TIP.2012.2219550
[2] Tonazzini, A. (2010). Color space transformations for analysis and enhancement of ancient degraded manuscripts. Pattern Recognition. Image Analysis, 20(3): 404-417. https://doi.org/10.1134/S105466181003017X
[3] He, S., Samara, P., Burgers, J., Schomaker, L. (2016). A multiple-label guided clustering algorithm for historical document dating and localization. IEEE Transactions on Image Processing, 25(11): 5252-5256. https://doi.org/10.1109/TIP.2016.2602078
[4] Stauffer, M., Fischer, A., Riesen, K. (2018). Keyword spotting in historical handwritten documents based on graph matching. Pattern Recognition, 81: 240-253. https://doi.org/10.1016/j.patcog.2018.04.001
[5] Moghaddam, R.F., Cheriet, M. (2010). A variational approach to degraded document enhancement. IEEE Transactions on Pattern Analysis and Machine Intelligence, 32(8): 1347-1361. https://doi.org/10.1109/TPAMI.2009.141
[6] Moghaddam, R.F., Cheriet, M. (2009). Low quality document image modeling and enhancement. International Journal of Document Analysis and Recognition (IJDAR), 11(4): 183-201. https://doi.org/10.1007/s10032-008-0076-2
[7] Sun, B., Li, S., Zhang, X.P., Sun, J. (2016). Blind bleed-through removal for scanned historical document image with conditional random fields. IEEE Transactions on Image Processing, 25(12): 5702-5712. https://doi.org/10.1109/TIP.2016.2614133
[8] Ostu, N. (1979). A threshold selection method from gray-level histograms. IEEE Transactions on Systems, Man, and Cybernetics, 7(1): 62-66.
[9] Sauvola, J., Pietikäinen, M. (2000). Adaptive document image binarization. Pattern Recognition, 33(2): 225-236. https://doi.org/10.1016/S0031-3203(99)00055-2
[10] Niblack, W. (1985). An Introduction to Digital Image Processing. Strandberg Publishing Company.
[11] Pai, Y.T., Chang, Y.F., Ruan, S.J. (2010). Adaptive thresholding algorithm: Efficient computation technique based on intelligent block detection for degraded document images. Pattern Recognition, 43(9): 3177-3187. https://doi.org/10.1016/j.patcog.2010.03.014
[12] Moghaddam, R.F., Cheriet, M. (2010). A multi-scale framework for adaptive binarization of degraded document images. Pattern Recognition, 43(6): 2186-2198.
[13] Moghaddam, R.F., Cheriet, M. (2012). AdOtsu: An adaptive and parameterless generalization of Otsu’s method for document image binarization. Pattern Recognition, 45(6): 2419-2431.
[14] Mahandi, Y.D., Yuniarno, E.M., Suprapto, Y.K., Purwaningsih, E. (2017). Ink bleed-through binarization of Javanese handwritten ancient document using local adaptive threshold based on local class width. In Proceedings of the International Seminar on Intelligent Technology and Its Application to Support the ASEAN Energy Sector, Surabaya, Indonesia, pp. 291-295. https://doi.org/10.1109/ISITIA.2017.8124097
[15] Bezmaternykh, P.V., Ilin, D.A., Nikolaev, D.P. (2019). U-Net-bin: Hacking the document image binarization contest. Computers & Optics, 43(5): 825-832. https://doi.org/10.18287/2412-6179-2019-43-5-825-832
[16] Kang, S., Iwana, B.K., Uchida, S. (2019). Cascading modular U-nets for document image binarization. In Proceedings of the International Conference on Document Analysis and Recognition, Sydney, NSW, Australia, pp. 675-680. https://doi.org/10.1109/ICDAR.2019.00113
[17] Limonova, E., Matveev, D., Nikolaev, D., Arlazarov, V.V. (2020). Bipolar morphological neural networks: convolution without multiplication. In Twelfth International Conference on Machine Vision, ICMV 2019, Amsterdam, Netherlands, pp. 962-969. https://doi.org/10.1117/12.2559299
[18] Kang, S., Iwana, B.K., Uchida, S. (2021). Complex image processing with less data—Document image binarization by integrating multiple pre-trained U-Net modules. Pattern Recognition, 109: 107577. https://doi.org/10.1016/j.patcog.2020.107577
[19] Zhang, Z., Wu, C., Coleman, S., Kerr, D. (2020). DENSE-INception U-net for medical image segmentation. Computer Methods and Programs in Biomedicine, 192: 105395. https://doi.org/10.1016/j.cmpb.2020.105395
[20] Zhang, Z., Liu, Q., Wang, Y. (2018). Road extraction by deep residual U-Net. IEEE Geoscience and Remote Sensing Letters, 15(5): 749-753. https://doi.org/10.1109/LGRS.2018.2802944
[21] Mique, E., Malicdem, A. (2020). Deep residual U-Net based lung image segmentation for lung disease detection. In IOP Conference Series: Materials Science and Engineering, Yogyakarta, Indonesia, p. 012004. https://doi.org/10.1088/1757-899X/803/1/012004
[22] Pollatos, V., Kouvaras, L., Charou, E. (2020). Land cover semantic segmentation using ResUnet. arXiv preprint arXiv:2010.06285.
[23] Shi, X., Chen, Z., Wang, H., Yeung, D.Y., Wong, W.K., Woo, W.C. (2015). Convolutional LSTM network: A machine learning approach for precipitation nowcasting. Advances in Neural Information Processing Systems, 28: 802-810.
[24] Hanson, A., Pnvr, K., Krishnagopal, S., Davis, L. (2018). Bidirectional convolutional LSTM for the detection of violence in videos. In Proceedings of the European Conference on Computer Vision (ECCV) Workshops, pp. 280-295. https://doi.org/10.1007/978-3-030-11012-3_24
[25] Shibuya, E., Hotta, K. (2020). Feedback U-Net for cell image segmentation. In Proceedings of the IEEE/CVF Conference on Computer Vision and Pattern Recognition Workshops, Seattle, WA, USA, pp. 974-975. https://doi.org/10.1109/CVPRW50498.2020.00495
[26] Arbelle, A., Raviv, T.R. (2019). Microscopy cell segmentation via convolutional LSTM networks. In 2019 IEEE 16th International Symposium on Biomedical Imaging (ISBI 2019), Venice, Italy, pp. 1008-1012. https://doi.org/10.1109/ISBI.2019.8759447
[27] Zhao, P., Wang, W., Zhang, G., Lu, Y. (2023). Alleviating pseudo-touching in attention U-Net-based binarization approach for the historical Tibetan document images. Neural Computing and Applications, 35(19): 13791-13802. https://doi.org/10.1007/s00521-021-06512-7
[28] Ma, K., Shu, Z., Bai, X., Wang, J., Samaras, D. (2018). DocUNet: Document image unwarping via a stacked u-net. In Proceedings of the IEEE Conference on Computer Vision and Pattern Recognition, Salt Lake City, UT, USA, pp. 4700-4709. https://doi.org/10.1109/CVPR.2018.00494
[29] Chaurasia, A., Culurciello, E. (2017). LinkNet: Exploiting encoder representations for efficient semantic segmentation. In 2017 IEEE Visual Communications and Image Processing (VCIP), FL, USA, pp. 1-4. https://doi.org/10.1109/VCIP.2017.8305148
[30] Zhou, L., Zhang, C., Wu, M. (2018). D-LinkNet: LinkNet with pretrained encoder and dilated convolution for high resolution satellite imagery road extraction. In Proceedings of the IEEE Conference on Computer Vision and Pattern Recognition Workshops, Salt Lake City, UT, USA, pp. 182-186. https://doi.org/10.1109/CVPRW.2018.00034
[31] Xiong, W., Jia, X., Yang, D., Ai, M., Li, L., Wang, S. (2021). DP-LinkNet: A convolutional network for historical document image binarization. KSII Transactions on Internet and Information Systems (TIIS), 15(5): 1778-1797.
[32] Hendrawati, T. (2018). Digitalisasi manuskrip nusantara sebagai pelestari intelektual leluhur bangsa. Media Pustakawan, 25(4): 21-29. https://doi.org/10.37014/medpus.v25i4.196
[33] Ronneberger, O., Fischer, P., Brox, T. (2015). U-net: Convolutional networks for biomedical image segmentation. In Medical image computing and computer-assisted intervention–MICCAI 2015: 18th International Conference, Munich, Germany, pp. 234-241. https://doi.org/10.1007/978-3-319-24574-4_28
[34] Prathiba, M., Jose, D., Saranya, R. (2019). Automated melanoma recognition in dermoscopy images via very deep residual networks. In IOP Conference Series: Materials Science and Engineering, Tamil Nadu, India, p. 012107. https://doi.org/10.1088/1757-899X/561/1/012107
[35] Khanna, A., Londhe, N.D., Gupta, S., Semwal, A. (2020). A deep Residual U-Net convolutional neural network for automated lung segmentation in computed tomography images. Biocybernetics and Biomedical Engineering, 40(3): 1314-1327. https://doi.org/10.1016/j.bbe.2020.07.007
[36] He, S., Schomaker, L. (2019). DeepOtsu: Document enhancement and binarization using iterative deep learning. Pattern Recognition, 91: 379-390. https://doi.org/10.1016/j.patcog.2019.01.025
[37] Maddalena, L., Antonelli, L., Albu, A., Hada, A., Guarracino, M.R. (2022). Artificial intelligence for cell segmentation, event detection, and tracking for label-free microscopy imaging. Algorithms, 15(9): 313. https://doi.org/10.3390/a15090313
[38] Jia, S.J., Wang, P., Jia, P.Y., Hu, S.P. (2017). Research on data augmentation for image classification based on convolution neural networks. In 2017 Chinese Automation Congress (CAC), Jinan, China, pp. 4165-4170. https://doi.org/10.1109/CAC.2017.8243510