Basil N. Merzah*![]() | Ziad M. Almakhyoul
| Ziad M. Almakhyoul![]() | Atheer Raheem Abdullah
| Atheer Raheem Abdullah![]() | Sadoon K. Ayed
| Sadoon K. Ayed![]() | Hasan Shakir Majdi
| Hasan Shakir Majdi![]()
© 2024 The authors. This article is published by IIETA and is licensed under the CC BY 4.0 license (http://creativecommons.org/licenses/by/4.0/).
OPEN ACCESS
Photovoltaic systems, a clean and renewable energy source, face challenges in optimizing efficiency due to temperature-induced performance loss. This research explores passive cooling strategies using phase change materials, which collect excess heat during peak solar irradiance, store it, and release it during less sunshine or high temperatures. This method efficiently controls panel temperature, enhancing performance and extending lifetime. The choice of cooling technique should be based on the specific requirements and constraints of the photovoltaic system. Solar panels receive 780 W/m2 of incoming solar radiation in summer and peak at noon. Convective heat transfer and air temperature of 25 degrees Celsius allow heat to escape. The stiff material, aluminum fins, and PCM have specific heat of 2000 J/kg.K and thermal conductivity of 0.2 W/m.K, respectively. Temperature distribution reveals significant reduction in surface temperatures with increasing Al2O3 concentrations. The best case was at 0.5wt%, achieving 49.896℃. Electrical efficiency increases with concentration. The distribution of temperatures at different CuO concentrations reveals lower surface temperatures due to increasing concentrations. The optimal concentration was 0.5 wt percent, where temperatures fell to 49.870℃. Increasing electrical efficiency is crucial for temperature improvement, with a peak at 9.26% at 0.5 weight percent mm. Temperature distribution decreases with ZnO concentration, with optimal 0.5wt% concentration, enhancing electrical efficiency with increasing concentrations.
PV panels, phase change material, ZnO nanoparticles, thermal management, photovoltaic cooling
Significant developments in solar photovoltaic (PV) technology have been driven by the rising worldwide need for clean and renewable energy sources. Solar panels are also showing signs of becoming a concrete possibility to harness the clean energy of the sun for a more sustainable future and less damage to the environment. Nevertheless, the fact that the efficiency of PV panels is affected by their operating temperature cannot be denied. High temperatures can compromise the conversion efficiency and the lifespan of the system through decreased electrical output and photovoltaic cell degradation. Many studies have been carried out to identify many cooling methods that may help to mitigate the effects of temperature rise in relation to the efficiency of solar panels to solve this important issue. One of these techniques is the use of phase change materials (PCM) which have received a lot of attention in recent years. The PCM is a group of materials that can switch between a solid and liquid or vice versa while also storing or dissipating latent heat. It enables heat to be stored during the hours of high solar insolation and released during other times or when temperatures are high or there is low solar radiation. This passive cooling technique seems to present a possible means of maintaining optimum working conditions for panels and enhance the efficiencies of PV systems in general.
Solar energy in the photovoltaic (PV) systems is an implementable and sustainable means for meeting the increasing energy demand in the world. The use temperatures of solar panels, however, have a substantially influence on their efficiency and output. Besides, high temperatures cut the efficiency of electrical production in the solar cells since they deteriorate faster, thus lowering the total efficiency and useful lifespan of the whole system. Many researchers have been focusing on studying several cooling methods that can effectively manage the PV panels’ temperature in a bid to overcome this problem.
Elevating the working temperature alters sun powered photovoltaic (PV) board productivity significantly; this experiment thus looked at the possibility of using a stage change material (PCM) coupled with a natural water-cooling system. To achieve this, OM 35 PCM was integrated on the teller surface of the PV board while water was allowed to flow through the base of the PCM chamber. The reference board was utilized to survey four situations in which the course and recurrence of cooling water stream were fluctuated. Results showed that PCM with normally flowing water further developed PV board execution by 11.92% as far as normal power age, electrical productivity, power improvement rate, normal temperature decrease, most extreme in general exergy yield, and exergy proficiency [1]. This article provides an environmental cost-benefit analysis of photovoltaic (PV) cooling's effect on atmospheric carbon dioxide (CO2). The importance of cooling technology has been evaluated, and researchers were able to determine the impact of cooling on the environmental cost of reducing atmospheric CO2 emissions. Results showed that increasing water pressure in the water-cooling method improves cell performance, and hybrid microchannel-jet impingement, hybrid phase-change materials, and hybrid nano-phase-change materials all boost cell electrical efficiency beyond what would be possible if just one method were utilized. It was also found that hybrid nano-PCM, hybrid PCM and hybrid PCM-water are lower than that which is obtained when employing each of these methods alone [2]. A paper examines the effects of passive and active cooling on photovoltaic (PV) cells. Passive cooling is conducted in a solar simulator at various intensities of artificial sunlight, with PCM infiltrated in a heat-conductive foam to improve thermal conductivity. Active cooling is tested independently, with the PV-PCM-composite system having the highest active cooling energy efficiency (66.8-82.6%) of all the PVT systems tested. Active cooling systems outperform passive PVT systems due to their ability to generate electricity and capture thermal energy efficiently [3]. This study analyzed the exploratory convective intensity move coefficients for unattached PV boards in the air stream. The mathematical investigation was completed, and reenactments and trial readings were differentiated. The typical distinction between estimation results and exploratory information was viewed as around 12%, demonstrating that the produced mathematical model is somewhat exact. A breeze point of 45° delivered the best PV cooling influence, while a breeze point of generally 20° created horrible. The conclusion of the trial arrangement that would be conceivable under the functional conditions of the Mediterranean environment relies upon the examination discoveries acquired in this review. The recommended thought of a novel PVT gatherer might be proper for building applications as a pivotal part of the structure energy frameworks [4]. This study assessed the energy execution of two PV frameworks containing different PCMs (PV + PCM frameworks) and a standard PV module (reference case) in Chania, Crete. Paraffins RT 27 and RT 31 were decided to act as the PCMs and the discoveries showed that utilizing 260 g of PCM27 and PCM31, separately, would bring about a pinnacle temperature diminishing of 6.4℃ and 7.5℃. The PV + PCM27 frameworks showed higher energy creation by 4.19 and 4.24 percent, separately, while the improvement in PV transformation effectiveness by PCM mix differed from 2.86 to 4.19 percent. The noticed day to day temperature profiles showed that the recommended course of action of PCM walled in areas utilized the synergistic effect of twist, even after the PCMs had totally dissolved [5]. PV boards made of silicon are delicate to working temperatures, especially when presented to serious sun radiation. This work inspected three uninvolved cooling answers for 50-W financially accessible unattached silicon PV boards and found that the PV board with cuts in the front PV board surface brought about a decline of about 4℃ for the PV board working temperature. The deliberate temperature decrease in different models was under 1.0℃, demonstrating that utilizing creative PV board outline materials was doable. Each of the recommended changes may regularly build PV board execution while involving less material in their assembling [6]. This study presents a special barrel shaped tube PCM lattice that isn't genuinely in contact with the PV module back surface. This contactless PCM grid limits warm and actual pressure by getting nuclear power by radiation and convection. To advance the space between the PV module and PCM framework, the created PCM lattice is incorporated under the PV module at specific distances of 6 mm, 9 mm, and 12 mm. A PCM network with a 6 mm dispersing brought down the TPV greatest by 2.5℃ and expanded the electrical result of the PV module by 0.2%. A dividing of 6 mm is great for the radiation source PCM lattice [7]. The ECM is a worked on one-layered numerical model that has roughly a similar exactness as CFD displaying while at the same time expecting a few significant degrees less computation time. It depends on working out the same warm conductivity that is upgraded by the convection flows inside the PCM during the liquefying and cementing processes, as well as under different points of tendency for a PV board. Examinations between the two models have been made for tendency points going from 0° to 90° and for viewpoint proportions of 2, 4, and 8. The greatest contrasts between them are 0.74 and 1.78 percent for the most minimal and most elevated viewpoint proportions, separately, and just about zero during hardening. Alexandria, Egypt's occasional PV/PTM tendency points were adapted to ideal power creation under genuine encompassing and sunlight-based energy conditions. Different PCM thicknesses impacted the reproduction all through a few days [8]. This article talks about exploratory investigations of a few photovoltaic (PV) board cooling strategies. The cooling methods utilized were stage change material (PCM), thermoelectric (TE), and aluminum balances. Surface temperatures and result powers of PV boards were tried using TE material in shifted numbers and aluminum blades in various examples. It was found that inappropriately chosen PCMs have protecting elements that increment the temperature of the PV board and decrease yield power. The PV with balance framework gave the most extreme power result of 47.88 W when assessed in similar climatic conditions, while the PV with PCM and TEM delivered the least power age of 44.26 W [9]. The need to increase Photo-Voltaic (PV) systems' efficiency is highlighted by their inevitable increase when a discernible portion of irradiance is transformed to heat. Phase Changing Material (PCM) has been successful in both PV and PV-thermal (PV/T) systems, but heat spreaders are drawn to it due to its poor thermal conductivity. A unique aluminum metal matrix with a honeycomb structure has been added to the PV/T system in the current research, which is superior due to its porous nature. Outdoor trials showed improvements in a number of energy characteristics, including open circuit voltage, short circuit current, and conversion efficiency. Due to temperature drops of 11.1 percent and 7.9 percent, respectively, the current model's conversion efficiency may increase by a maximum of 8.6 percent, compared to 3.5 percent with PCM-based PV/T [10]. This study is based on experimental investigations of the impact of COPPER (Cu), SILICON CARBIDE (Sic), and PARAFFIN WAX on the thermal behavior and electrical performance of a PV panel (Petroleum wax). Three prototypes were developed and tested before an appropriate experimental setup was created. A transient energy balance was presented for assessing the device's thermal activity and linking it to its electrical outputs. It was shown that utilizing mixed PCM enhanced electrical output of PV panels by an average of 4.3 percent and using standard increased it by 2.8 percent [11]. This study contrasted the exhibition of photovoltaic boards and stage change material/copper froth grid and 0.20 percent multi-walled carbon nanotubes to those with none. Results showed that the cell's temperature was diminished by 13.29%, its proficiency in creating power was expanded by 5.68%, and approach (3) improved productivity by 4.5% while diminishing cell temperature by 10.43%. This recommends that a copper froth network can be utilized as a latent cooling framework to control the temperature of a sunlight based cell [12]. Concentrated photovoltaic (CPV) nearby planet groups' temperature control has been made and demonstrated utilizing a mix of inactive and dynamic cooling innovations. The arrangement consolidates a shut circle water cooling framework with a stage change material (PCM) heat capacity battery. Results showed that when contrasted with the conventional direct PCM-PV and water-cooling individual frameworks, the proposed framework accomplishes a 60% decrease in the CPV normal temperature. The cell temperature is held under 78℃ at 10 focus proportion (CR) and 0.01 m/s HTF speed. The situating of the PCM plates in the water tank little affects how well the framework functions. Using nanofluid as a HTF enhancer further develops CPV proficiency by 2.7% and diminishes PCM liquefying time and PV most extreme temperature by 4℃ and 11%, individually [13]. The idea, design, installation, and testing of a photovoltaic/thermal (PV/T) system was proposed, implemented, and evaluated in this study. The findings we got indicated that the use of both nano-PCM and nanofluid improved the electrical current to 3.69 A to 4.04 to reduced and the electrical efficiency from 8.07% to 13.32%. Experimental data was used to develop three MLP, SOFM, SVM, and Artificial Neural Network (ANN) approaches, which showed that the network's output was in agreement with the outcomes of experiments and published studies [14]. This work inspects the effects of utilizing a stage change material (PCM) and a ZnO/water nanofluid at the same time as coolant vehicles for a photovoltaic (PV) liquid/nanofluid based gatherer framework. It looks at the noticed qualities for surface temperature, warm effectiveness, and electrical productivity of the frameworks contrasted and those of an ordinary sun-based module as a kind of perspective framework. The outcomes show that the typical electrical result is over 13% higher in the PVT/PCM-based gatherer framework than it is in the customary PV module. Moreover, the improvement in warm effectiveness was almost 9% with next to no extra energy utilization. Finally, the discoveries of an exergy concentrate on show that involving a Nanofluid and a PCM for the cooling framework simultaneously supports the framework's complete exergy proficiency by over 23% [15]. A study analyzed the cooling of a photovoltaic panel using heat pipes. The test rig is a photovoltaic panel with dimensions of 1200×540 mm, a copper plate base of 07 mm thickness, four thermosyphon heat pipes, and a water box heat exchanger capacity of 16.2 litter. The panels are installed south facing and tilted at a monthly tilt angle. The experiments were conducted in Baghdad from April to July 2017, using a theoretical model with electrical equations and heat balance equations. The experimental results justified the betterment in the new method of cooling that ranged between 15-20% and justified the improvement in the electrical efficiency that ranged between 11-14% [16]. Thermal performance and efficiency of photovoltaic thermal solar panels were analyzed in a study that looked at the effects of heat thermosyphon integration. Three test rigs were built: for the first one an experimental photovoltaic panel with a 0. 07mm Cooper plate base, four thermosyphon pipes, water box heat exchanger. The second system, which aimed to have cheaper economic structure, comprised of PV panel of 0. 07mm thickness of aluminum plate base, six no copper heat pipe with water cylindrical heat exchanger. The experiments were carried out in July 2017 in Baghdad for the MATLAB program for model calculations and for developing characteristic curves. The results showed that both new methods effectively cool the solar panels, with module I and II cooling significantly lower than conventional panels. Electrical efficiency was also enhanced in both systems. The theoretical and experimental studies showed a good correlation with a small discrepancy of 3-6% [17]. A research study was carried out to analyze the PCMs’ behavior in Iraqi climates. A glass beaker with a mass of PCMs of 100 g underwent the melting process through water bath and hot plate until the temperature became higher than the melting point. Preliminary readings of the temperature inside and outside the beaker were taken using a temperature data-logger. The thermal storage tank composed of the coiled tubes was modeled numerically with the help of the COMSOL Multiphysics software. The test results of the study indicated that the C component had the highest thermal storage capacity [18]. Modern architecture has ensured that thermal engineering has become commonplace with special emphasis placed on the sun as a thermal input. Thus, phase changing materials are employed to store the gained heat during the day and release it during nighttime since the solar radiation is productive only in the daytime. These materials melt the solid phase of the sun and when it is evening, the sun peels off the required liquid phase. This research paper focused on the positioning of phase-changing materials within the wall in order to regulate temperatures in rooms at night. The findings revealed that the thickness of concrete material enhances holding of heat-phase-changing materials after sunset. Gypsum material on the other hand has better provision for heat, which is conducted from materials of varying length. In the best case, the concrete must have a thickness of 100 mm with the gypsum layer having a thickness of 15 mm [19]. A research examines the effects of nanoparticle loading on the mass fraction and melting behavior of nano-enabled phase change materials (NEPCMs). They apply numerical simulations and a heat-supplying wall in the analysis of its dynamics. The results indicate that the mass fraction and the concentration of the nanoparticles present are inversely proportional where CuO has the highest melting point enhancement due to its low density and high thermal conductivity. The management and usage of thermal energy storage system have also been understood and can be applied in thermal energy conservation area in terms of the design and optimization of the system. It also emphasizes on the fact that there is a need to choose correct nanoparticle concentrations for the NEPCM based systems [20]. The aim of a work was to find out the ways to enhance efficiency of energy conversion in the systems using solar photovoltaic (PV) with storage batteries. It was concerned with the management of temperature, particularly employing an open cooling system with an active fan. It relies on a high level of battery state-of-charge to feed fans and use MATLAB simulation in order to enhance the power rate. Integrated a 62 kW Photovoltaic energy system into the building to reduce energy consumption to a large extent. The adopted approach can therefore promote energy sustainability and lower the cost of operating solar PV systems [21]. A study assessed the viability of a micro hydro/photovoltaic/battery system for road lighting in Al-Marj a mountainous and remote area 100km south of Benghazi. Based on the water potential and meteorological data of the reservoir, flow rate was estimated by taking the average value, which was 0.46 m3/s. While analyzing data for the hybrid power generation system, HOMER software was employed to develop models. The study selected 30 kW PV and 0.9 kW Hydro for the system which incurred energy cost of $ at the beginning. The cost of each experimental system is 032 per kilowatt-hour, which is lower than the network system capital cost [22]. A paper presented the analysis of two solar panels, namely CTI-80 and YHM-205-27P, for efficiency using Engineering Equation Solver software. The findings reveal that CTI-80 is more effective because of its monocrystalline solar cells that can offer more efficiency than the polycrystalline cells. Temperature is also shown to influence theoretical efficiency because not all photons possess the required energy to break the bond within the n-type layer. The conclusion reiterates the need to select the most appropriate panel for the intended purpose and suggests the utilization of monocrystalline solar cell panels to improve efficiency [23].
To improve the performance, sturdiness, and financial sustainability of solar energy harvesting systems, researchers are researching the impact of adding nanomaterials on thermal efficiency and improving solar panel cooling systems utilizing PCM. This study provides a clearer knowledge of the potential advantages and difficulties of these novel cooling methods, opening the path for more sustainable and effective solar energy consumption.
The novelty of this study resides in its integration of simulation programs across physical scientific disciplines and their evolution to provide findings that are up-to-date with progress in terms of demonstrating the veracity of the improvement that has been introduced. Where thermal findings from the simulation software were coupled to the electrical simulation in the Simulink program to demonstrate electrical efficiency. The findings on optimizing solar panel cooling systems using PCM and investigating the effect of adding nanomaterials on thermal efficiency hold significant relevance and potential impact in the field of solar energy technology. The research addresses critical challenges faced by solar panels, such as temperature-induced performance degradation, and offers innovative solutions to enhance the efficiency and longevity of PV systems.
3.1 System geometry
Solar panels as well as phase change materials were created in SolidWorks, 2019, a special program in the engineering object design with a high degree of accuracy, see Figure 1.
Figure 1. Geometry shape
3.2 Mesh
In the simulation process, an accurate mesh is made to solve the equations and this mesh has to check its parameters, because it’s found that in the process of increasing the number of elements it provides more accurate results but at certain limit only. Therefore, for making the mesh more reliable, it is possible to transfer an independency of the mesh according to the Table 1. These numbers were chosen based on program suggestion and the experience. Where the last value of elements number (98396) used to obtain simulation with accurate results because the error between the last two values of maximum temperature, which is the most important effective value, is reached about 0.03%.
Table 1. Mesh independency
|
Case |
Element |
Node |
Maximum Temperature (℃) |
|
1 |
17313 |
19537 |
55.231 |
|
2 |
21027 |
26285 |
50.215 |
|
3 |
54737 |
56217 |
49.812 |
|
4 |
98396 |
104447 |
49.795 |
This happens because the structured grids are good for complex geometries and therefore for reasons stated above, the structured hexahedron grids were employed in this study as shown in the Figure 2.
Figure 2. Mesh generated
3.3 Boundary conditions
The value of incoming solar radiation projected onto the outer surface of the solar panel is 780 W/m2 in the summer and around one o'clock in the afternoon, when the solar panel's radiative impact is at its peak. The addition of convective heat transfer at a heat transfer coefficient of 5 W/m2 and an air temperature of 25 degrees Celsius allows for heat to move and escape from the opposite side. The phase-changing material is totally stiff, and the beginning state of the various phases employed is natural temperature (25 degrees Celsius). The aluminum fins and PCM have a thermal conductivity of 0.2 W/m.K and a specific heat of 2000 J/kg.K respectively.
The following Table 2 displays the physical characteristics of nanomaterial addition concentrations (2). This concentration was chosen based on previous studies and it is the most effective through experimental trials.
Table 2. The physical properties of nanomaterials
|
Properties |
Unit |
Water |
Al2O3 |
CuO |
ZnO |
|
density |
kg/m3 |
998.2 |
3970 |
6500 |
5606 |
|
thermal conductivity |
W/m.K |
0.2 |
17.65 |
18 |
19 |
|
specific heat |
J/kg.K |
2000 |
525 |
540 |
544 |
|
properties |
unit |
water |
water+0.1 Al2O3 |
water+0.3 Al2O3 |
water+0.5 Al2O3 |
|
density |
kg/m3 |
998.2 |
1001.1718 |
1007.1154 |
1013.059 |
|
thermal conductivity |
W/m.K |
0.2 |
0.21745 |
0.25235 |
0.28725 |
|
specific heat |
J/kg.K |
2000 |
1998.525 |
1995.575 |
1992.625 |
|
properties |
unit |
water |
water+0.1 CuO |
water+0.3 CuO |
water+0.5 CuO |
|
density |
kg/m3 |
998.2 |
1003.7018 |
1014.7054 |
1025.709 |
|
thermal conductivity |
W/m.K |
0.2 |
0.2178 |
0.2534 |
0.289 |
|
specific heat |
J/kg.K |
2000 |
1998.54 |
1995.62 |
1992.7 |
|
properties |
unit |
water |
water+0.1 ZnO |
water+0.3 ZnO |
water+0.5 ZnO |
|
density |
kg/m3 |
998.2 |
1002.8078 |
1012.0234 |
1021.239 |
|
thermal conductivity |
W/m.K |
0.2 |
0.2188 |
0.2564 |
0.294 |
|
specific heat |
J/kg.K |
2000 |
1998.544 |
1995.632 |
1992.72 |
4.1 MATLAB Simulink equations
Limit of power age from photovoltaic board relies upon numerous boundaries. Two most significant boundaries, which are sunlight-based light and board temperature, are examined for this reproduction study. Changes in board voltage and power showed varying radiation and temperature advantages of the photovoltaic board. The most extensive force of the PV module was determined throughout the recreation from the exploratory and plan relations of the PV module attributes (Voc, IOS, TP). Getting boundaries from the electrical comparable chart of photovoltaic board; board yield flow (I), board dull immersion flow (IOS) and creating flow by sun-oriented light (ILG) conditions show as follows:
$\left.I=I_{L G}-I_{O S} \exp \left(\frac{q}{n k T_P}\left(V+I R_f\right)\right)-1\right]-\frac{V+I R_S}{R_{S H}}$ (1)
The equation you've provided seems to be related to the calculation of the reverse saturation current (IOS) of a diode or semiconductor device. Let's break down the components of the equation:
$I_{O S}=I_{O S}\left(\frac{T_P}{T_R}\right)^3 \exp \left[\frac{q E_{G O}}{A k}\left(\frac{1}{T_R}-\frac{1}{T}\right)\right]$ (2)
The equation you've provided relates the light-induced gate current (ILG) of a photodetector or a semiconductor device to various parameters. Let's break down the components of the equation:
$I_{L G}=\left[I_{S C R}+K\left(T_P-25\right)\right] G / 100$ (3)
The equation you've provided relates the maximum power (Pmax) of an electrical device or circuit to its maximum current (Imax) and maximum voltage (Vmax). This equation is based on the fundamental relationship for electrical power in a circuit, which is given by:
$P_{\max }=I_{\max } V_{\max }$ (4)
$P_{\max }=I_{sc} V_{o c} F F$ (5)
$F F=\frac{P_{\max }}{I_{sc} V_{o c}}$ (6)
The open circuit voltage relates to the voltage drop across the diode when being traversed by the photocurrent ILG which is equivalent to IOS when the output current is I = 0. It can be addressed for VOS.
$V_{o c}=\frac{k T_R}{e} \ln \left(\frac{I_{s c}}{I_o}-1\right)=V_t \ln \left(\frac{I_{s c}}{I_o}+1\right)$ (7)
where, Vt is thermal voltage (V) given by:
$V_t=\frac{k T_R}{e}$ (8)
Every one of the constants in the above conditions not set in stone by analyzing the producers' evaluations of the PV cluster, and afterward the distributed or estimated I-V bends of the exhibit. These plans are utilized with MATLAB/Simulink customized for acquiring this exploratory review, see Figure 3. The hypothesis of the photovoltaic cell is the photovoltaic hypothesis of semiconductor material. Photovoltaic is a quirk which semiconductor material photo sensitively absorbs solar energy, and then the electron opening originated from the photon severs and produces electric power. Since the I-V attribute of the photovoltaic cell depends on the daylight power G in W/m2 and cell temperature that is I=f(V,G,t).
Direct relapse to the test information of PV module temperature TP versus open circuit voltage VOC is found by:
$V_{O C}=22.384-0.0627 T_P$ (9)
where, TP is in ℃.
Likewise, the linearity between sun oriented radiation (G) and short out current (ISC) information is addressed by:
$I_{S C}=0.0967+0.0032 G$ (10)
where, G is in W/m2.
Figure 3. Simulink programing
4.2 ANSYS package
Controlling equation is an important principle in the study of fluid dynamics, which states the law of conservation of mass of a fluid in flow. This simply postulates that the rate at which mass is flowing into a control volume equals the rate at which mass is flowing out of the control volume and plus the rate of increase of mass within the control volume. Mathematically, the continuity equation is often expressed as:
$\frac{\partial \rho}{\partial t}+\nabla \cdot(\rho \mathbf{v})=0$ (11)
where, $\rho$ is the density of the fluid. $v$ is the velocity vector of the fluid. $t$ is time. $\nabla$. represents the divergence operator.
Energy Equation:
The energy equation is used to dictate the energy balance of a flowing substance and includes internal energy, pressure work, and heat transfer. Let me state it as a conservation law and the first law of thermodynamics for your understanding.
$\frac{\partial(\rho E)}{\partial t}+\nabla \cdot(\rho E \mathbf{v})=\nabla \cdot(\lambda \nabla T)+\dot{q}-\dot{W}_s$ (12)
where, $\rho$ is the density of the fluid. $E$ is the total energy per unit mass of the fluid. $v$ is the velocity vector of the fluid. $t$ is time. $\lambda$ is the thermal conductivity. $T$ is the temperature. $\dot{q}$ is the rate of heat addition per unit volume. $\dot{W}_s$ is the rate of shaft work per unit volume.
Momentum Equation:
The momentum equation is one of the basic equations in the discussion on movement of fluids and is a statement of the law of conservation of momentum in a fluid. This is a brief description of how the speed of the fluid changes with respect to the pressure forces, viscous forces and other forces that affect a fluid.
Mathematically, the momentum equation for fluid flow can be written as:
$\frac{\partial(\rho \mathrm{v})}{\partial t}+\nabla \cdot(\rho \mathrm{v} \otimes \mathrm{v})=-\nabla p+\nabla \cdot \tau+\rho \mathrm{g}+\mathrm{f}$ (13)
where, $\rho$ is the density of the fluid. $v$ is the velocity vector of the fluid. $t$ is time. $p$ is pressure. $\tau$ is the viscous stress tensor. $g$ is the acceleration due to gravity. $f$ represents any other external forces.
For modelling fluid dynamics in an orthogonal CFD simulation, the following equation for the flow rate, also known as Darcy’s equation is used. The equation for Darcy's law is:
$Q=-A \cdot k \cdot \frac{\Delta P}{\mu \cdot L}$ (14)
where, $Q$ is the volumetric flow rate of the fluid through the porous medium ( $\left.\mathrm{m}^3 / \mathrm{s}\right) . A$ is the cross-sectional area of the porous medium perpendicular to the flow direction $\left(\mathrm{m}^2\right) . k$ is the permeability of the porous medium $\left(\mathrm{m}^2\right) . \Delta P$ is the pressure drop across the porous medium (Pa). $\mu$ is the dynamic viscosity of the fluid (Pa.s or $\mathrm{N} . \mathrm{s} / \mathrm{m}^2$ ). $L$ is the length of the porous medium in the flow direction $(\mathrm{m})$.
Figure 4 shows the linking mechanism between the two programs and how to obtain results.
Figure 4. Flow chart of linking mechanism between the two programs
5.1 Effect of adding concentrations of nanomaterials on temperature and electrical efficiency
The addition of concentrations of nanomaterials to the phase changing materials increases the transfer of thermal energy and its distribution through the solar panel, as the heat discharge from the solar panel is large with the addition of these materials.
5.1.1 Adding concentrations of Al2O3 nanomaterials
Figure 5 shows the distribution of temperatures through different Al2O3 concentrations. Increasing the concentrations of Al2O3 reduces the temperatures on the surface. The concentration was 0.1wt%, and the surface temperature reached 51.088℃, while the concentration of the nanoparticle was 0.3wt%, where the surface temperature of the plate reached 50.456℃, and the best case was at a concentration of 0.5wt%, where the temperatures continued to drop to 49.896℃.
The benefit of reducing the temperatures on the surface of the solar panels is to have a higher solar panel efficiency and generate the largest possible capacity to meet the purpose for which it is working. Figure 6 shows the electrical efficiency diagram of different nanomaterials concentrations. Where the value of efficiency with increasing concentrations of nanomaterials.
The fundamental concept of comparison and appreciation of the circumstance is to enhance the electrical efficiency that forms the cornerstone for recognizing the advancement in temperature. By referring to Figure 6, it is seen that the efficiency value rises with the augment of the Al2O3 nanoparticles’ concentrations, as the enhancement attained 9.04% depending on the concentration of the solution used for the extraction. 5 wt% mm which is the highest compared to the other cases as displayed.
5.1.2 Adding concentrations of CuO nanomaterials
The distribution of temperatures at various CuO concentrations is seen in Figure 7. Where it is stated that dramatically lower surface temperatures are caused by rising CuO concentrations. The nanoparticle concentration ranged from 0.1 wt percent, where the surface temperature of the plate reached 51.080℃, to 0.3 wt percent, where it reached 50.440℃, and the best instance was at a concentration of 0.5 wt percent, where the temperatures continued to fall to 49.870℃.
Figure 5. Temperature contour at deferent concentration of Al2O3: (a) 0.1wt%, (b) 0.3wt%, (c) 0.5wt%
Figure 6. Electrical efficiency voltage diagram with varying concentration of Al2O3
Figure 7. Temperature contour at deferent concentration of CUO: (a) 0.1wt%, (b) 0.3wt%, (c) 0.5wt%
Lowering the temperature on the solar panels' surface will increase their efficiency and enable them to produce as much energy as feasible in order to fulfill their intended function. The electrical efficiency diagram of various nanomaterial concentrations is shown in Figure 8. Where it is said that efficiency increases as nanomaterial concentrations do.
Figure 8. Electrical efficiency voltage diagram with varying concentration of CuO
Increasing electrical efficiency is the fundamental tenet of comparison and situational comprehension, and it forms the cornerstone of comprehending temperature improvement. Figure 8 shows that efficiency values rise with increasing CuO nanoparticle concentrations. The efficiency peaked at 9.26 percent at a concentration of 0.5 weight percent mm, which is the greatest instance compared to the other cases.
5.1.3 Adding concentrations of ZnO nanomaterials
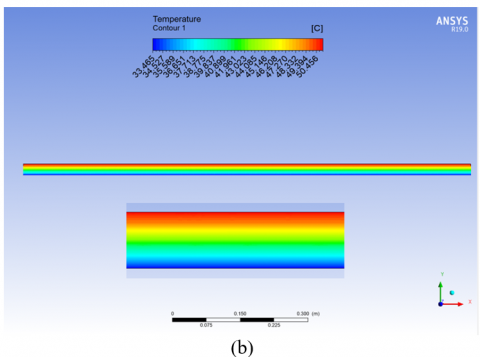
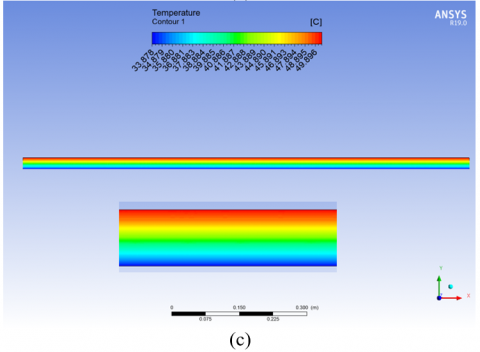
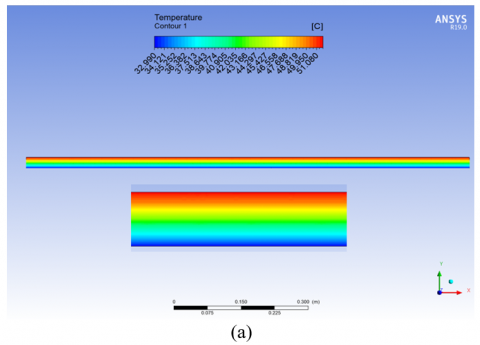
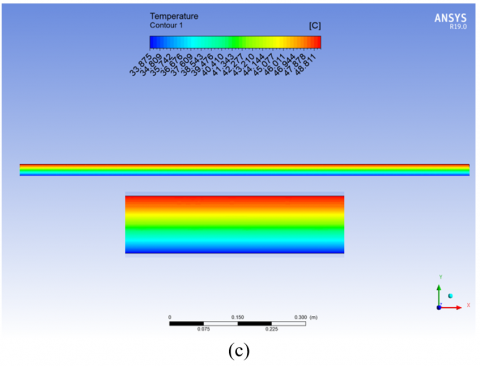
Figure 9 depicts the temperature distribution as a function of ZnO concentration. It is found that raising the quantities of ZnO greatly decreases surface temperatures. The concentration was 0.1wt percent, and the surface temperature of the plate reached 51.084℃, while the nanoparticle concentration was 0.3wt percent, and the surface temperature of the plate reached 50.389℃, and the best case was at a concentration of 0.5wt percent, and the temperatures continued to drop to 49.795℃.
Figure 9. Contours of temperature at different concentration of ZnO: (a) 0.1wt%, (b) 0.3wt%, (c) 0.5wt%
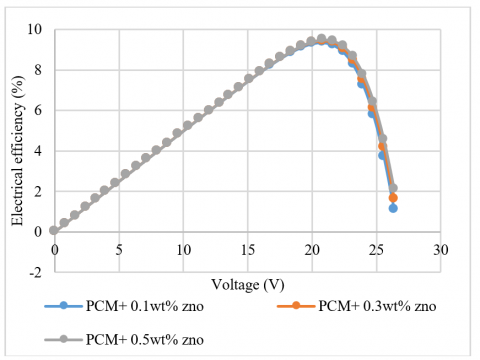
The advantage of lowering the temperatures on the surface of the solar panels is that it increases solar panel efficiency and generates the most capacity feasible to satisfy the goal for which it is operating. Figure 10 depicts an electrical efficiency diagram for various nanomaterial concentrations. Where it is observed that the value of efficiency increases with increasing nanomaterial concentrations.
Figure 10. Electrical efficiency voltage diagram with varying concentration of ZnO
Figure 11. Electrical efficiency voltage diagram with 0.5wt% concentration of nanoparticles
The primary premise of comparison and comprehension of the situation is to enhance electrical efficiency, which is the foundation for comprehending the temperature improvement. Figure 10 shows that the value of efficiency improves with increasing concentrations of ZnO nanoparticles, with the efficiency reaching 9.48 percent at 0.5wt percent mm, which is the greatest instance compared to the rest cases.
5.1.4 Comparison of the best-simulated concentrations of nanomaterials
It can be seen from Figure 11 that the best nanomaterials that can be obtained with a concentration of 0.5wt% is ZnO, in which the electrical efficiency reached 9.8%.
5.2 Effect of adding porous material on temperature and electrical efficiency
Where the best condition and the best concentration reached in the previous cases was used, which is ZnO as a nanomaterial with a concentration of 0.5wt%, and the addition of the porous material 0.5, 0.7, 0.9.
Figure 12. Temperature contour at deferent porosity: (a) 0.5; (b) 0.7; (c) 0.9
On display in Figure 12 is the temperature distribution across the various porosities. Where it has been shown that rising surface temperatures correlate positively with rising names. At a porosity of 0.5, the plate's surface temperature was 46.977℃; at a porosity of 0.7, it reached 47.685℃; and in the worst-case scenario, at a porosity of 0.9, it reached 48.811℃.
A better solar panel efficiency and the generation of the maximum feasible capacity for the purpose for which it is operating are benefits of lowering surface temperatures on the solar panels. Figure 13 is a graph depicting the effect of varying concentrations of nanomaterials on electrical efficiency. In which it is seen that the efficiency value grows with increasing nanomaterial concentrations.
Figure 13. Electrical efficiency voltage diagram with varying porosity
The improvement in temperature may be understood on the basis of a fundamental concept of comparison and understanding: increasing electrical efficiency. Figure 13 shows that when porosity is reduced, efficiency rises, with the best efficiency shown in the case with a porosity of 0.5 (9.79%).
The utilization of solar energy through photovoltaic (PV) systems has emerged as a viable and sustainable solution to meet the growing global energy demand [24]. Nonetheless, it has been discovered that the efficiency and performance of solar panels reduces when it is exposed to high temperatures [25]. High temperatures also affect the efficiency of the module electrical performance and fosters the degradation of solar cells thereby shortening the system’s life span [26]. This is a major challenge that has called for the development of several cooling methods to ensure that temperatures of the PV panels are controlled.
A comparative study on nanomaterials on solar panel cooling systems based on PCM laid down that ZnO nanoparticles provided better thermal performance to Al2O3 and CuO. This could be due to characteristics as ZnO has good thermal conductivity, larger surface area to volume ratio that enhances dispersion on the surface and increases the available surface area. The size and distribution of nanoparticles are also the factors influencing the thermal conductivity of the PCM matrix. The integration of nanoparticles with PCM matrix plays an important role in the thermal performance and PCM’s compatibility and affinity may lead to variations in thermal behavior.
1. The distribution of temperatures through different Al2O3 concentrations shows that increasing the concentrations reduces the temperatures on the surface significantly. The best case was at a concentration of 0.5wt%, where the temperatures continued to drop to 49.896℃. The principle of comparison and understanding of the situation to enhance the flow of electrical efficiency is the basic principle, which increases with increasing the concentrations of the Al2O3 nanoparticles.
2. The distribution of temperatures at various CuO concentrations shows that dramatically lower surface temperatures are caused by rising CuO concentrations. The nanoparticle concentration ranged from 0.1 wt percent, where the surface temperature of the plate reached 51.080℃, to 0.3wt% where it reached 50.440℃, and the best instance was at a concentration of 0.5 wt percent where the temperatures continued to fall to 49.870℃. Increasing electrical efficiency is the fundamental tenet of comparison and situational comprehension, and it forms the cornerstone of comprehending temperature improvement. The efficiency values rise with increasing CuO nanoparticle concentrations, with the efficiency peak at 9.26% at 0.5 weight percent.
3. The temperature distribution as a function of ZnO concentration is found to be significantly decreased, with the best case being at a concentration of 0.5wt percent mm. The primary premise of comparison and comprehension of the situation is to enhance electrical efficiency, with the value of efficiency improving with increasing concentrations of ZnO nanoparticles.
4. It can be seen that the best nanomaterials that can be obtained with a concentration of 0.5wt% is ZnO, in which the electrical efficiency reached 9.8%.
5. The temperature distribution across porosities has been shown to correlate positively with rising names. At a porosity of 0.5, the plate's surface temperature was 46.977℃, at 0.7, it reached 47.685℃, and at 0.9, it reached 48.811℃. This improvement in temperature can be explained by the concept of comparison and understanding: increasing electrical efficiency when porosity is reduced, with the best efficiency shown at 0.5 (9.79%).
The results of this research show that nanomaterial-added PCM-based cooling systems have the potential to increase the thermal efficiency of solar panels. The study highlights the significance of choosing appropriate nanomaterials and promotes future investigation of cooling systems based on nanotechnology. Although the findings are encouraging, it is important to accept the study's limitations and take steps to overcome the practical difficulties involved in integrating these cutting-edge cooling technologies into solar energy applications that are used in the real world. Future research should concentrate on overcoming these constraints and expanding our understanding in this critical area of thermal management and solar panel performance. In the end, these developments have a great deal of potential to accelerate the broad acceptance of solar energy as a sustainable and clean energy source.
[1] Sudhakar, P., Santosh, R., Asthalakshmi, B., Kumaresan, G., Velraj, R.J.R.E. (2021). Performance augmentation of solar photovoltaic panel through PCM integrated natural water circulation cooling technique. Renewable Energy, 172: 1433-1448. https://doi.org/10.1016/j.renene.2020.11.138
[2] Ghadikolaei, S.S.C. (2021). An enviroeconomic review of the solar PV cells cooling technology effect on the CO2 emission reduction. Solar Energy, 216: 468-492. https://doi.org/10.1016/j.solener.2021.01.016
[3] Ahmadi, R., Monadinia, F., Maleki, M. (2021). Passive/active photovoltaic-thermal (PVT) system implementing infiltrated phase change material (PCM) in PS-CNT foam. Solar Energy Materials and Solar Cells, 222: 110942. https://doi.org/10.1016/j.solmat.2020.110942
[4] Jurčević, M., Nižetić, S., Marinić-Kragić, I., Čoko, D., Arıcı, M., Giama, E., Papadopoulos, A. (2021). Investigation of heat convection for photovoltaic panel towards efficient design of novel hybrid cooling approach with incorporated organic phase change material. Sustainable Energy Technologies and Assessments, 47: 101497. https://doi.org/10.1016/j.seta.2021.101497
[5] Savvakis, N., Dialyna, E., Tsoutsos, T. (2020). Investigation of the operational performance and efficiency of an alternative PV+PCM concept. Solar Energy, 211: 1283-1300. https://doi.org/10.1016/j.solener.2020.10.053
[6] Nižetić, S., Marinić-Kragić, I., Grubišić-Čabo, F., Papadopoulos, A.M., Xie, G. (2020). Analysis of novel passive cooling strategies for free-standing silicon photovoltaic panels. Journal of Thermal Analysis and Calorimetry, 141: 163-175. https://doi.org/10.1007/s10973-020-09410-7
[7] Velmurugan, K., Karthikeyan, V., Korukonda, T.B., Madhan, K., Emsaeng, K., Sukchai, S., Sirisamphanwong, C., Wongwuttanasatian, T., Elavarasan, R.M., Alhelou, H.H., Subramaniam, U. (2020). Experimental studies on PV module cooling with radiation source PCM matrix. IEEE Access, 8: 145936-145949. https://doi.org/10.1109/ACCESS.2020.3012272
[8] Elsheniti, M.B., Hemedah, M.A., Sorour, M.M., El-Maghlany, W.M. (2020). Novel enhanced conduction model for predicting performance of a PV panel cooled by PCM. Energy Conversion and Management, 205: 112456. https://doi.org/10.1016/j.enconman.2019.112456
[9] Bayrak, F., Oztop, H.F., Selimefendigil, F. (2020). Experimental study for the application of different cooling techniques in photovoltaic (PV) panels. Energy Conversion and Management, 212: 112789. https://doi.org/10.1016/j.enconman.2020.112789
[10] Shastry, D.M.C., Arunachala, U.C. (2020). Thermal management of photovoltaic module with metal matrix embedded PCM. Journal of Energy Storage, 28: 101312. https://doi.org/10.1016/j.est.2020.101312
[11] Kumar, K.S., Revanth, S., Sanjeev, D., Kumar, P.S., Surya, P. (2021). Experimental investigation of improving the energy conversion efficiency of PV cell by integrating with PCM. Materials Today: Proceedings, 37: 712-716. https://doi.org/10.1016/j.matpr.2020.05.723
[12] Abdulmunem, A.R., Samin, P.M., Rahman, H.A., Hussien, H.A., Mazali, I.I. (2020). Enhancing PV Cell’s electrical efficiency using phase change material with copper foam matrix and multi-walled carbon nanotubes as passive cooling method. Renewable Energy, 160: 663-675. https://doi.org/10.1016/j.renene.2020.07.037
[13] Nasef, H.A., Nada, S.A., Hassan, H. (2019). Integrative passive and active cooling system using PCM and nanofluid for thermal regulation of concentrated photovoltaic solar cells. Energy Conversion and Management, 199: 112065. https://doi.org/10.1016/j.enconman.2019.112065
[14] Al-Waeli, A.H., Sopian, K., Kazem, H.A., Yousif, J.H., Chaichan, M.T., Ibrahim, A., Mat, S., Ruslan, M.H. (2018). Comparison of prediction methods of PV/T nanofluid and nano-PCM system using a measured dataset and artificial neural network. Solar Energy, 162: 378-396. https://doi.org/10.1016/j.solener.2018.01.026
[15] Sardarabadi, M., Passandideh-Fard, M., Maghrebi, M.J., Ghazikhani, M. (2017). Experimental study of using both ZnO/water nanofluid and phase change material (PCM) in photovoltaic thermal systems. Solar Energy Materials and Solar Cells, 161: 62-69. https://doi.org/10.1016/j.solmat.2016.11.032
[16] Habeeb, L.J., Mutasher, D.G., Abd Ali, F.A.M. (2017). Cooling photovoltaic thermal solar panel by using heat pipe at Baghdad climate. International Journal of Mechanical & Mechatronics Engineering, 17(06): 1-6.
[17] Habeeb, L.J., Mutasher, D.G., Abd Ali, F.A.M. (2018). Solar panel cooling and water heating with an economical model using thermosyphon. Jordan Journal of Mechanical and Industrial Engineering, 12(3): 1-6. https://jjmie.hu.edu.jo/vol12-3/jjmie-71-18-01.pdf.
[18] Majdi, H.S., Habeeb, L.J. (2020). Heat transfer for achieving the melting point and super cooling point of phase change materials. Journal of Green Engineering (JGE), 10(9): 5886-5901.
[19] Hussein, H.M.A., Alturaihi, M.H., AL-Musawi, S.T.M., Habeeb, L.J. (2022). Numerical investigation of a prototype phase change material construction elements. International Journal of Mechanical Engineering, 7(1): 970-980.
[20] Khazaal, M.A., Daneh-Dezfuli, A., Habeeb, L.J. (2023). Influence of nanoparticle concentrations on heat transfer in nano-enhanced phase change materials. Power Engineering and Engineering Thermophysics, 2(4): 228-237. https://doi.org/10.56578/peet020404
[21] Majdi, H.S., Mashkour, M.A., Habeeb, L.J., Sabry, A.H. (2021). Enhancement of energy transfer efficiency for photovoltaic (PV) systems by cooling the panel surfaces. Eastern-European Journal of Enterprise Technologies, 4(8-112): 83-89. https://doi.org/10.15587/1729-4061.2021.238700
[22] Fadhil, N.A., Elmnifi, M., Abdulrazig, O.D.H., Habeeb, L.J. (2021). Design and modeling of hybrid photovoltaic micro-hydro power for Al-Bakur road lighting: A case study. Materials Today: Proceedings, 49: 2851-2857. https://doi.org/10.1016/j.matpr.2021.10.072
[23] Majdi, H.S., Younis, A., Abdullah, A.R., Elmnifi, M., Habeeb, L.J. (2023). A comparative analysis of the efficiency of monocrystalline and polycrystalline photovoltaic modules: CTI-80 and YHM-205-27P. International Journal of Design & Nature and Ecodynamics, 18(4): 775-782. https://doi.org/10.18280/ijdne.180403
[24] IEA. (2020). Renewables 2020 Analysis and Forecasts to 2025. International Energy Agency.
[25] Skoplaki, E., Palyvos, J.A. (2009). On the temperature dependence of photovoltaic module electrical performance: A review of efficiency/power correlations. Solar Energy, 83(5): 614-624. https://doi.org/10.1016/j.solener.2008.10.008
[26] Alam, M.J. (2020). Impact of temperature on solar photovoltaic module efficiency: A review. Renewable and Sustainable Energy Reviews, 121: 109660.