Abdulnaser A. Ahmed*![]() | Adnan A. Ismael
| Adnan A. Ismael![]()
©2024 The authors. This article is published by IIETA and is licensed under the CC BY 4.0 license (http://creativecommons.org/licenses/by/4.0/).
OPEN ACCESS
The current study deals with simulation of 3D-flow around three different types of bridge pier shapes on a flatbed surface. The main objective of this article is to explore how water flows around various types of bridge piers. In this article, the CFD-Fluent (k-epsilon) turbulence model was used to simulate the flow turbulence around untraditional piers named upstream facing aero-foiled shaped pier (US- FASP) and downstream facing aero-foiled shaped pier (DS-FASP) and were compared with the circular pier, Results from the experiments were compared to the expected flow velocity (m/s), turbulent kinetic energy (TKE), and other variables. The results of the three-dimensional simulation of the water flow behavior and turbulent kinetic energy around the three various designs of bridge piers support that. The findings suggest that (DS-FASP) is the most effective sort of form to employ since it allows water to flow around it extremely smoothly, resulting in minimal obstruction of the water flow in addition to the lowest TKE. In this investigation, root mean errors were used. mean squared errors (MSE), mean absolute errors (MAE), and both the correlation coefficient (R) and the root mean square error (RMSE). The findings also demonstrated that the type of form (DS-FASP) outperformed pavements with other diverse shapes in terms of performance. From this, it was found that the turbulent kinetic energy (TKE) and longitudinal velocity (u) had mean least square errors (MSE) of 1.5E-0 and 7.6E-08, respectively, and coefficients (R2) of 0.92 and 0.98. The shape of a wake vortex in a wake region is captured by the (k-epsilon) model. The k-epsilon turbulence model showed good similarities with the experimental results. The study's findings suggest that local cleaning in the vicinity of bridge piers can be scaled back in the future.
CFD, flow velocity, bridges, simulation, turbulent kinetic energy, 3D-flow
In many areas of engineering, including coastal, marine, river, and other industries, cylindrical bridge piers are the most frequently utilized materials. The local powder hole is associated with the formation surrounding the bridge piers, and this is directly tied to all the various fluid flow characteristics in or near the vicinity of the bridge piers. The features make it clear that the flow pattern around or close to the vertical circular piers is both very complicated and three-dimensional. The cleaning process around or near bridge piers is characterized by being both dynamic and unstable, making it one of the significant phenomena that must be taken into consideration while designing and implementing projects. Many of the failures in bridges are the result of the occurrence of erosion around the piers and abutments of bridges, which leads to their collapse, and therefore they need maintenance.
A pier is surrounded by turbulent, three-dimensional flow. CFD models have evolved into a useful tool for analyzing and predicting flow for a variety of river engineering issues. Nevertheless, through actual experiments and data gathered from performing these standardized tests or by taking field measurements. Because of eddies on the embankment pavement, a pure hole develops when the flow around it is in a motionless zone. Numerous theoretical and practical studies have employed the definition of the Doppler acoustic velocity in order to confirm the nature of the flow, as well as to identify the three-dimensional turbulence in the surrounding flat-base areas of the sidewalks, as well as to confirm the severity of the turbulence in the circular sidewalks and observe the speeds in them downstream [1].
To achieve this, Al-Hashimi et al. [2] conducted laboratory tests on a large dam surface and measured the water surface in it. They then looked into the accuracy of the results of the experiments and made predictions using the triple and double fluency program based on the experimental data. The lateral portion of the water surface is simulated using the ANSYS program in addition to the (k-) model and the amount of the flowing liquid. This investigation led to the conclusion that three-dimensional fluency takes longer to develop than two-dimensional fluency. Soudani and Soudani [3] used CFD code to analyze the flow field and kinetic energy field around the pier using the conventional k-epsilon turbulence model. The flow field around a cylinder was numerically verified on a fixed-bed open channel. Comparisons between the anticipated velocity and turbulent kinetic energy and the measured data were made.
Chauhan and Jhamnani [4] used the k-epsilon turbulence model in CFD-Fluent, tested the local scrub and the flow behavior around and near bridge piers. The author made a relationship between the experimental results outcome and the predictions. The simulation results for velocity profile and static pressure presented a good agreement with the experimental results.
Based on what was mentioned in the previous research above, it is clear that simulation plays a big role understanding of the flow turbulence phenomenon and its essential parameters.
The objective of this study was to compare the outcomes with circular piers, which are more useful, and to determine how well various piers that are formed upstream and downstream confronting that upstream perform in terms of local cleanliness. This study demonstrated how positioning a bridge pier such that it faces downstream can improve the performance of one that was built using a plane-shaped design and put downstream. This technique was a successful countermeasure for lowering the cleaning depth, maintenance expenses, and enhancing the hydraulic functionality of the bridge pier of this type.
Mendonca et al. [5] aimed to examine the effects of a rectangular channel with entirely turbulent flows on clear waters at their greatest depth that had been cleansed by the debris of cylindrical piers fixed in the sand. It was feasible to confirm that the scour hole depth is increased by floating debris while the scour hole depth is decreased by debris on the sand bed.
In addition to covering theoretical and experimental themes in this area, there are numerous studies that dealt with numerical analysis using various programs in the study of local cleanliness near and at the ports, and the most significant of these researches [6-17].
In this article, the digital data that will be acquired using the ANSYS program and the data that will be measured practically will be compared. Using the (CFD) approach and the (k-epsilon) disturbance model, it will be possible to estimate the flow state and turbulent kinetic energy of the water near and around bridge piers.
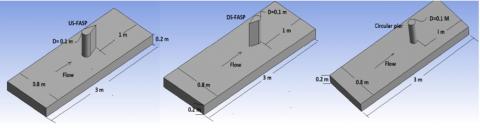
Figure 1 illustrates the geometrical configuration for the computer simulation.
Figure 1. The geometrical configuration for the computer simulation
In order to validate the theoretical findings made using the ANSYS program, scientific experiments were conducted for a rectangular channel with dimensions of (1200 * 800 mm) and depth (900 mm). As seen in Figure 2, a circular pier as well as two unconventional bridge piers (US-FASP and DS-AFP) are utilized.
Figure 2. Shapes of bridge piers
Along with computing the values of the water dissipation coefficient (ϵ), the values of the kinetic energy of the water disturbance (k) were also determined using the mathematical formulae listed below:
$\frac{\partial p}{\partial t}+\frac{\partial p u_i}{\partial x_i}=0$ (1)
$\frac{\partial p u_i}{\partial t}+\frac{\partial}{\partial x_j}\left(p u_i u_j\right)=-\frac{\partial p^{\prime}}{\partial x_i}+\frac{\partial}{\partial x_j}\left\{\left(\mu+\mu_t\right)\left[\frac{\partial u_i}{\partial x_j}+\frac{\partial u_j}{\partial x_i}\right]\right\}$ (2)
$\frac{\partial(p k)}{\partial_t}+\frac{\partial\left(p u_i k\right)}{\partial x_j}=\frac{\partial}{\partial x_i}\left\{\left(\mu+\frac{\mu_t}{\sigma_k}\right) \frac{\partial k}{\partial x_j}\right\}+G-p \epsilon$ (3)
$\frac{\partial(p \epsilon)}{\partial_t}+\frac{\partial\left(p u_i \epsilon\right)}{\partial x_j}=\frac{\partial}{\partial x_i}\left\{\left(\mu+\frac{\mu_t}{\sigma_\epsilon}\right) \frac{\partial \epsilon}{\partial x_j}\right\}+C_{1 \epsilon} \frac{\epsilon}{k} G-C_{2 \epsilon} \frac{\epsilon^2}{k}$ (4)
$\mu_t=p C_\mu \frac{k^2}{\epsilon}$ (5)
where,
$C_\mu=0.09=$ experimentally determined.
$k$ and $\epsilon$ are $\sigma_k=1.0$ and $\sigma_\epsilon=1.3$, respectively.
$k$ and $\epsilon=$ Prundtl numbers for turbulence.
$C_{1 \epsilon}=1.44$ and $C_{2 \epsilon}=1.92$ are constant for the $\epsilon$ equation.
Mean gradients can result in the formation of turbulent kinetic energy (G), which can be expressed as:
$G=\mu_t\left[\frac{\partial u_i}{\partial x_j}+\frac{\partial u_j}{\partial x_i}\right] \frac{\partial u_i}{\partial x_j}$ (6)
The k-model was created specifically for recycled fluid flow and various planar shear layers [5]. The most widely used and well-validated model is the turbulence one, which has uses in both environmental flows and flows caused by industrial waste. In confined fluid flows, when Reynolds shear stresses are crucial, fluid flows frequently have a free shear layer with pressure gradients that are frequently rather modest. It might also be viewed as a straightforward perturbed model that only requires beginning and/or boundary conditions. As a result, it necessitates at most two more PDEs, making it substantially more memory-intensive than the mixing length model.
The performance of the water turbulence model was identified and evaluated through predictive statistical analysis, knowledge of the water velocity towards the x-axis, in addition to identifying the kinetic energy of the water turbulence, after making a comparison between the average square error of the values (MSE) and the average absolute error of the values (MAE) for the results. Root mean square deviation of the data (RMAE) is used to determine both the mean squared error and the mean absolute error:
$M A E=\frac{1}{n} \sum_{i=1}^n\left|\exp _{\mathrm{i}}-\operatorname{pred}_{\mathrm{i}}\right|$
$A S E=\frac{1}{\mathrm{n}} \sum_{\mathrm{i}=1}^{\mathrm{n}}\left(\exp _{\mathrm{i}}-\operatorname{pred}_{\mathrm{i}}\right)^2$ (7)
$RMSE =\sqrt{\frac{1}{n} \sum_{\mathrm{i}-1}^{\mathrm{n}}\left(\exp _{\mathrm{i}}-\text { pred }_{\mathrm{i}}\right)^2}$
Table 1 illustrates the statistical parameter error estimations between each set of data from the ANSYS program and the measured data from the actual experiments.
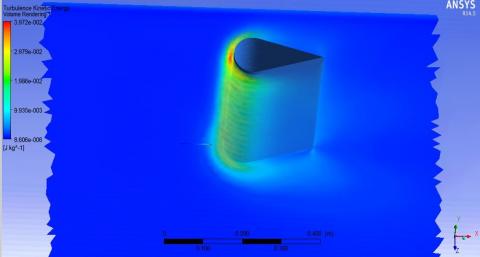
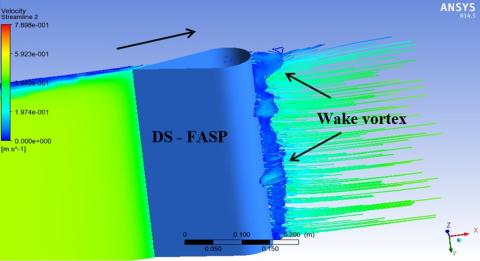
Furthermore, the results proved the high capability of the k-epsilon turbulence of the model to captures the flow field, the vortices especially at the wake region of bridge piers [18], no vortex shedding has been captured at upstream of the pier as shown in Figure 3.
Table 1. The calculations of the statistical parameter errors between both simulated and experimentally measured data
|
Upstream-Facing Aero Foil -Shaped Pier (US-FASP) |
|||||
|
Parameters |
MAE |
MSE |
RMSE |
R2 |
R |
|
Longitudinal velocity u (m/s) |
0.00011 |
9.89E-06 |
0.00314 |
0.91 |
0.953 |
|
Turbulent kinetics energy m2/s2 |
0.00013 |
2.2E-07 |
0.00047 |
0.973 |
0.986 |
|
Downstream-Facing Aero Foil -Shaped Pier (DS-FASP) |
|||||
|
Parameters |
MAE |
MSE |
RMSE |
R2 |
R |
|
Longitudinal velocity u (m/s) |
0.00093 |
1.5E-05 |
0.0038 |
0.92 |
0.96 |
|
Turbulent kinetics energy m2/s2 |
7.03E-05 |
7.6E-08 |
0.00021 |
0.98 |
0.989 |
|
Circular Pier |
|||||
|
Parameters |
MAE |
MSE |
RMSE |
R2 |
R |
|
Longitudinal velocity u (m/s) |
0.0015 |
4.07E-05 |
0.0064 |
0.89 |
0.943 |
|
Turbulent kinetics energy m2/s2 |
0.00022 |
5.65E-07 |
0.00075 |
0.975 |
0.987 |
Figure 3. Formation of wake vortex at the end of bridge piers
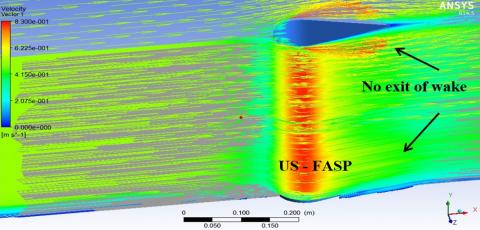
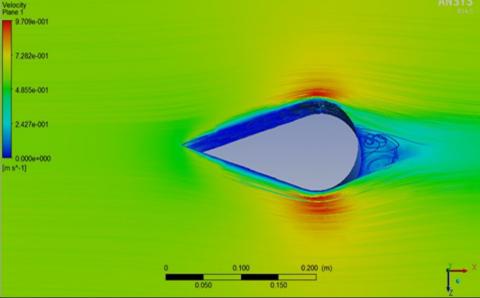
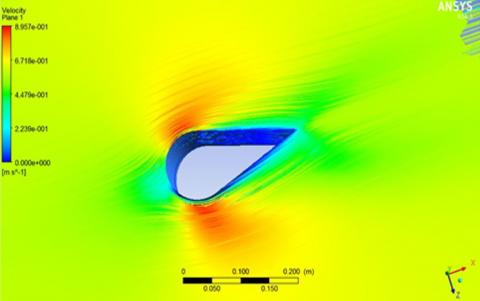
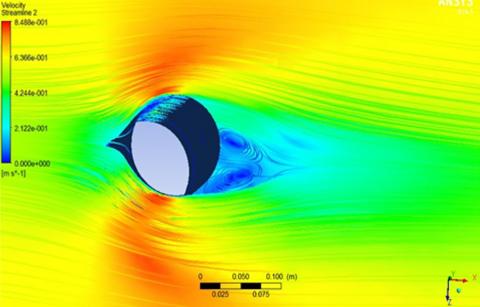
Figure 4 shows the architecture of the flow at the three berths in the created model. In the model's background, behind the sidewalk area, a vortex starts to emerge. Water's highest cycle velocity was recorded at (US-FASP), approximately (75°) [19].
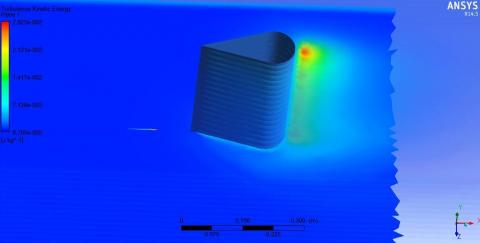
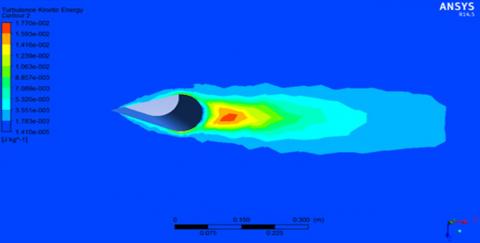
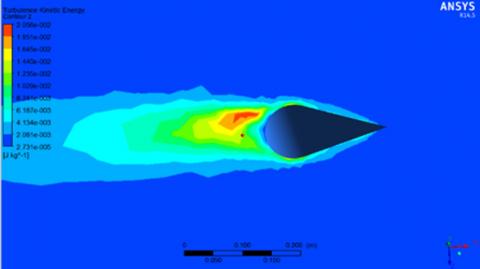
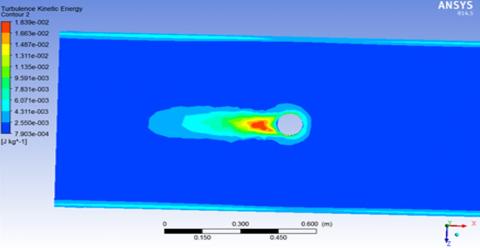
Figure 5 depicts the turbulent kinetic energy in the ward of the plane (z=0.3H), above the flat bed at the front and end of bridge piers. The maximal turbulent kinetic energy for (DS-FASP) is (0.017 J/kg) less than that of (US-FRNP) (0.0205 J/kg) and the circular equal (0.0184 J/kg) piers. which indicates that the size of the vortices is lessened in the case of (DS-FASP), which implies a reduction in the local scour [20, 21].
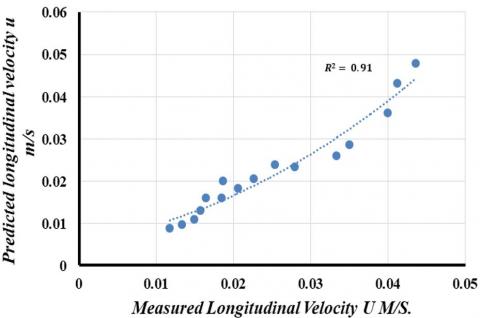
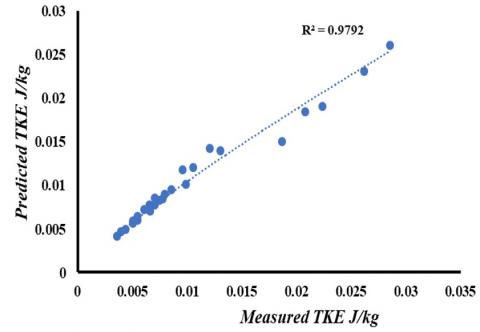
Comparisons of anticipated and measured velocities and turbulent kinetic energy are shown in Figures 6 for the upstream face of the bridge piers, respectively. With R2 (0.91) and R2 (0.97), respectively, the correlation coefficient for the k-epsilon turbulence model shows good agreement for longitudinal velocity (u) and (TKE).
(a)
(b)
Figure 6. Comparison between predicted and measured: (a) Longitudinal velocity; (b) Turbulent kinetic of the energy at upstream face of piers located lengthways the centerline of the model’s channel
According to the findings of the comparison of data from three distinct platforms, the disturbance is greatest at the source facing the circular and air platforms.
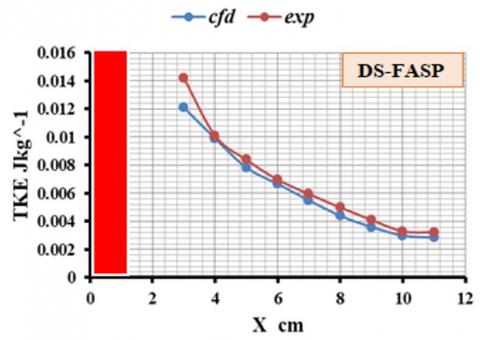
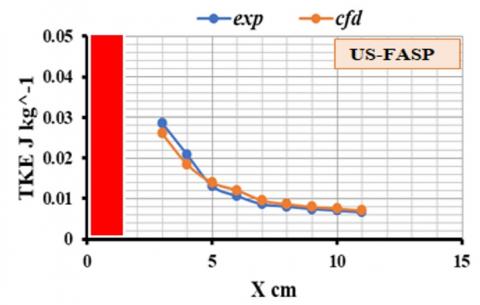
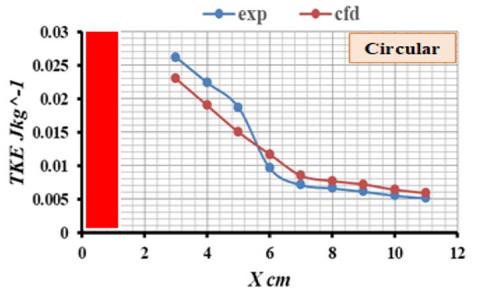
k-epsilon turbulence model is verified by comparing the predicted results with the experimental in terms of turbulent kinetics energy and velocity of flow using (MAE), (MSE) and (RMSE) as illustrated in Table 1, which shows the results obtained, that the models have acceptable error values. A channel with a flatbed has been used to simulate the 3D-flow around US-FASP, DS-FASP, and Circular pier using the turbulence model. Figures 7 and 8 illustrate the collected experimental data for longitudinal velocity and turbulent kinetic energy along with the projected CFD outcomes. The good agreement between the experimental results and those obtained from the model gives us confidence in using CFD to predict the occurrence of scour around bridge piers.
Figure 7. Longitudinal velocity u m/s upstream circular pier, (US-FASP) and (DS-FASP)
(a)
(b)
(c)
Figure 8. Turbulent kinetic energy of the values with distance near: (a) DS-FASP; (b) US-FASP; (c) Circular pier
The turbulent k-epsilon model was found to be capable of capturing complex 3D fluid flow field features (flow velocity, turbulent kinetic energy, and eddies in the wake area of the pavement) surrounding or near the bridge pier, according to the results of CFD simulations. With correlation values for DS-FASP of 0.92 and 0.98, respectively, the resulting predictors of flow field and TKE are highly connected to the obtained measured data. Values of (MSE) for longitudinal velocity and turbulent kinetic energy were 1.5E-0 and 7.6E-08 respectively. Measured result on a flat bed were utilized to verify the results from the numerical model. Although the numerical model captures the velocity, TKE and the vortex in the wake region of the pier but no shedding of horseshoe vortex observed in the front side. Agreement between the simulations and the measured data is demonstrated. The flow field immediately impacts the dock's upstream face, which is one of the results that were observed. The less-projected area of the dock's upstream face represents an obstruction to the flow of liquid, and as a result, the numerical results show that this causes the vortex to decrease.
Accordingly, when compared to other kinds of pavement forms, DS-FASP is the most practical to utilize. Generalization and (US-FASP) increase the perturbation when compared to DS-FASP, according to the results of kinetic energy variation obtained for perturbation at the longitudinal level. The k- epsilon turbulence model showed good similarities with the experimental results. (k-epsilon) model captures the shape of wake vortex in wake region according to the current study, In the future, it might be able to lower local gravity close to or around bridge piers.
[1] Graf, W., Istirato, I. (2002). Flow pattern in the scour hole around a cylinder. Journal of Hydraulic Research, 40(1): 13-20. https://doi.org/10.1080/00221680209499869
[2] Al-Hashimi, S.A.M., Madhloom, H.M., Khalaf, R.M., Nahi, T.N., Al-Ansari, N.A. (2017). Flow over broad crested weirs: Comparison of 2D and 3D models. Journal of Civil Engineering and Architecture, 11: 769-779. https://doi.org/10.17265/1934-7359/2017.08.005
[3] Soudani, M.M., Soudani, A. (2012). Numerical study of external turbulent flow. Revue des Energies Renouvelables, 15(1): 155-164.
[4] Chauhan, K., Jhamnani, B. (2019). CFD simulation of local scouring around bridge pier. International Journal of Engineering and Advanced Technology, 9(1): 1870-1880. https://doi.org/10.35940/ijeat.A1002.109119
[5] Mendonca, I.P., Canilho, H.D., Fael, C.M. (2019). Flow -3D modelling of the debris effect on maximum scour hole depth at bridge piers. In E-Proceedings of the 38th IAHR World Congress, Panama City, Panama. https://doi.org/10.3850/38WC092019-1850
[6] Gholami, A., Akhtari, A.A., Minatour, Y., Bonakdari, H., Javadi, A.A. (2019). Experimental and numerical study on velocity fields and water surface profile in a strongly-curved 90° open channel bend. Engineering Applications of Computational Fluid Mechanics, 8(3): 447-461. https://doi.org/10.1080/19942060.2014.11015528
[7] Hussein, N.S., Shukur, A.H., Majeed, Z.H. (2023). Clear water scour at varied pile-cap elevation and skewed bridge piers. Mathematical Modelling of Engineering Problems, 10(5): 1737-1742. https://doi.org/10.18280/mmep.100524
[8] Yuce, M., Al-Babely, A., Al-Dabbagh, M. (2015). Flow simulation over oblique cylindrical weirs. Canadian Journal of Civil Engineering, 42: 389-400. https://doi.org/10.1139/cjce-2014-0157
[9] Moussa, Y.A.M., Nasr-Allah, T.H., Abd-Elhasseb, A. (2016). Studying the effect of partial blockage on multi vents bridge pier scour experimentally and numerically. Ain Shams Engineering Journal, 9(4): 1439-1450. https://doi.org/10.1016/j.asej.2016.09.010
[10] Hassan, W.H., Fadhe, Z.M., Thiab, R.F., Mahdi, K. (2024). Numerical investigation of the local scour for tripod pile foundation. Mathematical Modelling of Engineering Problems, 11(4): 903-910. https://doi.org/10.18280/mmep.110407
[11] Lang, L., Li, G.D., Ning, J. (2013). 3D numerical simulation of flow field and local scour around spur dikes. In Proceedings of the 35th IAHR World Congress, Chengdu, China.
[12] Wang, P.S., Ding, H.Y., Zhang, P.Y. (2020). Shaking table tests and numerical analysis on the seismic response of karst-crossing socketed piles in dry sandy soil foundation. International Journal of Design & Nature and Ecodynamics, 15(5): 701-709. https://doi.org/10.18280/ijdne.150512
[13] Vasquez, J.A., Walsh, B.W. (2009). CFD simulation of local scour in complex piers under tidal flow. In 33rd IAHR World Congress, Vancouver, Canada.
[14] Mehnifard, M., Dalfardi, S., Baghdadi, H., Seirfar, Z. (2014). Simulation of local scour caused by submerged horizontal jets with flow-3D numerical model. Desert, 1(1): 47-55. https://doi.org/10.22059/jdesert.2015.54082
[15] Ghasemi, M., Soltani-Gerdefaramarzi, S. (2017). The scour bridge simulation around a cylindrical pier using flow-3D. Journal of Hydrosciences and Environment, 1(2): 46-54. https://doi.org/10.22111/jhe.2017.3357
[16] Pasino, A., De Angeli, S., Battista, U., Ottonello, D., Clematis, A. (2021). A review of single and multi-hazard risk assessment approaches for critical infrastructures protection. International Journal of Safety and Security Engineering, 11(4): 305-318. https://doi.org/10.18280/ijsse.110403
[17] Baykal, C., Sumer, B. M., Fuhrman, D. R., Jacobsen, N. G., Fredsøe, J. (2015). Numerical investigation of flow and scour around a vertical circular cylinder. Philosophical Transactions of the Royal Society A: Mathematical, Physical and Engineering Sciences, 373(2033): 20140115. https://doi.org/10.1098/rsta.2014.0104
[18] Guemou, B., Seddini, A., Ghenim, A. N. (2016). Numerical investigations of the round-nosed bridge pier length effects on the bed shear stress. Progress in Computational Fluid Dynamics, 16(5): 313-321. https://doi.org/10.1504/PCFD.2016.078753
[19] Oliveto, G., Hager, W. H. (2002). Temporal evolution of clear-water pier and abutment scour. Journal of Hydraulic Engineering, 128(9): 811-820. https://doi.org/10.1061/(ASCE)0733-9429(2002)128:9(811)
[20] Ismael, A., Gunal, M., Hussei, H. (2015). Effect of bridge pier position on scour reduction according to flow direction. Arabian Journal for Science and Engineering, 40(6): 1579-1590. https://doi.org/10.1007/s13369-015-1625-x
[21] Ismael, A., Gunal, M., Tareq, M., Hussein, H. (2017). Simulation of three-dimensional flow field around unconventional bridge piers. Eurasian Journal of Science and Engineering, 3(2): 90-99.