Shaqir Elezaj![]() | Lavdim Beqiri*
| Lavdim Beqiri*![]() | Ilir Elezaj
| Ilir Elezaj![]()
©2024 The authors. This article is published by IIETA and is licensed under the CC BY 4.0 license (http://creativecommons.org/licenses/by/4.0/).
OPEN ACCESS
In the widest practical and technical sense, ventilation systems are nothing more than an appropriate schematic representation of the mine's overall or individual aeration plans, which only include the specific works that are used to circulate air; other works are left out. The study analyzed the serial aeration system, giving concrete examples of serial connection of the workshops in the mines. Furthermore, the study utilized simple parallel analysis in analyzing the systems of two parallel ventilation system of the mine. In addition, the aerodynamic resistance of the ventilation system was analyzed in relation to the emergence of the COVID-19 pandemic; alongside the political, social, and economic concerns brought out by the COVID-19 pandemic. It is observed that the general resistances of the branched ventilation system through parallel branches are smaller than the minimum resistances of each branch. The findings of this study hold significant implications for managing health risks in mines during pandemics. Implementing parallel ventilation branches ensures consistent airflow distribution, minimizing areas of stagnant air where viruses may accumulate. Taking into account the values of the total resistances that are reached in the ventilation systems in the mine, it was concluded that the probability of COVID-19 over time is always decreasing. This was as a result of the medical measures that were applied for the phenomenon in question.
mine ventilation, aerodynamic resistance, health management, COVID-19 pandemic, ventilation optimization
Mining operations are crucial to global economy, as they provide essential raw materials for several industries [1, 2]. The effect of aerodynamic resistance on mining lines is one feature of mining operations that is frequently disregarded. Aerodynamic resistance, commonly referred to as air drag, is the force that air exerts on objects in motion. This resistance can have a big impact on energy use, environmental sustainability, and operational efficiency in the mining industry [2, 3].
Reducing aerodynamic resistance improves energy efficiency and aids environmental conservation [4]. The mining industry can lessen the environmental impact of energy production and its carbon footprint by reducing the energy requirements of its activities. Aerodynamic resistance research is a crucial field of study for the mining industry since sustainable mining methods are critical in light of global climate change [5, 6].
Furthermore, enhancing operational effectiveness, cutting energy use, and advancing environmental sustainability all depend on an understanding and mitigation of aerodynamic resistance on mining lines. To maximize mining operations as well as minimize their environmental impact, ongoing research and creative design solutions are required.
The mining sector plays an essential role in global economies, their operations can pose significant threats to human health [7] and the environment at large, which was even more threatening during the COVID-19 pandemic. Crucial for the maintenance of air quality and the control of airborne contaminants (mitigating the spread of infectious diseases among workers), is adequate ventilation. Effective ventilation systems in mines are necessary to ensure an environment that is safe to work in.
Ventilation helps in not just diluting but eliminating toxic gases as well as other airborne contaminants which may have been produced as a result of mining operations. In respect to the coronavirus pandemic, the need for adequate ventilation is even of greater significance in reducing the risk of transmission of the virus among mine workers. Poor ventilation systems and mining practices at mines poses significant health and safety impacts to the workers. This was reported by Mayala et al. [8] who carried out a study on Merelani's artisanal mines. According to them, “The current ventilation systems mainly utilize forced fresh air supply by using small compressors with average capacity of 10 m3/min and natural ventilation from the surface atmosphere. This is far from required air quantity in an underground opening considering that the number of miners in each shift can reach 120 [8]”.
In the mining industry, ventilation systems are essential in ensuring the safety and well-being of underground workers [9-11]. These systems are made to manage airborne pollutants, eliminate hazardous gases and give fresh air continuously [12-18].
Ventilation systems calculation is primarily based on several considerations which include: calculating the air currents in the system's branches (also known as the ventilation network); calculating the system's overall aerodynamic resistance; calculating the amount of air that is distributed in each system branch; and calculating the system’s pressure loss, which is effectively linked to the ventilators' specifications.
The source point of the depression and its direction of action (e.g., the fan's location within the system and its operation) must be determined in order to determine the aeration system from the aforementioned information. Other data that must be taken into consideration are: airflow entering or exiting the mine as a whole (this size establishes the fan's appropriate capacity); and the branch's aerodynamic resistance between two joints.
1.1 Research objectives
The paper aims to achieve the following objectives:
1.2 Theoretical framework
The possible relationship that exists between mine ventilation, aerodynamic resistance and health/environmental outcomes are posited by theoretical framework that in mining, adequate ventilation is crucial in order to maintain a safe work environment as well as minimize the environmental impacts.
How effective a ventilation system is, is impacted by the aerodynamic resistance (likely influenced by factors such as mine layout, geological conditions etc.). A higher resistance will not only impede airflow, which would lead to inadequate ventilation but also increase exposure to pollutants.
Health outcome is directly linked ventilation efficacy. Poor ventilation is likely to cause respiratory illness as well worsen an already existing respiratory condition among mine workers [19, 20]. The efficacy of ventilation not only affect the outcome of health but also that of the environment. The quality of ventilation determines the condition of the environment, which may directly or indirectly have an effect on health.
2.1 Serial system calculation
Serial aeration system entails the “aeration of air without branching the air at all and sending it from the entrance to the mine in a certain way serially through all the underground workshops to the exit of the mine [the lowest degree of aeration in the system]” [18]. This technique of aeration is risky, and standard protocols forbid the mining of methane or coal dust or areas threatened by underground fires [14-16]. This is because the explosive nature of these materials and the hazardous byproducts of fires can be readily transferred from one workshop to another, greatly increasing the impact of the disaster. When opposed to branching ventilation systems, this method of ventilation has drawbacks from both a technical and financial standpoint. The total resistances per plant makes up the overall resistance R of the “serial aeration system”, which indicates:
$R=\sum_{\mathrm{i}=1}^{\mathrm{n}} R_i=R_1+R_2+R_3+\mathrm{L}+R_n$ (1)
The following formula is used to determine the system's overall depression:
$h=R \cdot Q^2=Q^2 \cdot \sum_{i=1}^n R_i$ (2)
where, Q is the system's air circulation quantity.
The power needed for the ventilation fan is:
$N_V=\frac{Q \cdot h}{\eta}=\frac{Q^3 \cdot \sum_{i=1}^n R_i}{\eta}$ (3)
where, the “fan utilization coefficient” is $\eta$.
According to the Bernoulli equation's concept of conservation of energy, the pressure loss, in other words “depression of the serial system” is equal to the total of the pressure losses in all parts of the mine workshop, which is where air travels from the input to the outlet:
$h=\sum_{i=1}^n h_i=h_1+h_2+\ldots+h_n=\sum_{i=1}^n R_i \cdot Q_i^2$ (4)
As can be seen below, the air flow can be expressed as a product of the flow velocity (v) and the cross-sectional area (A) of the flow branch:
$Q=A \cdot v_1=\varepsilon \cdot A \cdot v$ (5)
Therefore, the air stream's coefficient of contraction, or suppression, is represented by $\varepsilon$.
We have the following based on the flow continuity equation:
$v=\sqrt{\frac{2 h}{\rho}}$ (6)
According to Eqs. (5) and (6) we get:
$A=\frac{Q}{\varepsilon \cdot v}=\frac{Q}{\varepsilon \cdot \sqrt{\frac{2 h}{\rho}}}$ (7)
Similar holes are needed for the serial aeration system according to:
$\frac{1}{A^2}=\frac{1}{\sum_{i=1}^n A_i^2}$ (8)
respectively,
$A^2=\sum_{i=1}^n A_i^2=\frac{Q^2 \cdot \rho}{2 \varepsilon^2 \cdot h}$ (9)
2.2 Solving a concrete example
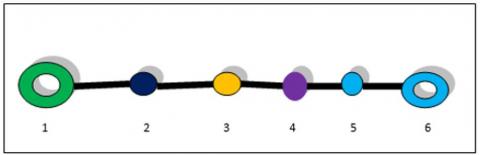
Additionally, a specific representation will be selected, in which the ventilation network for the serial system is shown as seen in Figure 1.
Figure 1. Serial connection within the mine’s workshops
The mine's workshops' serial connection is depicted in Figure 1. In this instance, the overall resistance is:
$\begin{aligned} & R=R_{1-2}+R_{2-3}+R_{3-4}+R_{4-5}+R_{5-6} \\ & =R+R(B-R)+2 R+R(C-R)+7 R\end{aligned}$ (10)
In order for B and C to be established through experimentation, Eq. (10) is obtained:
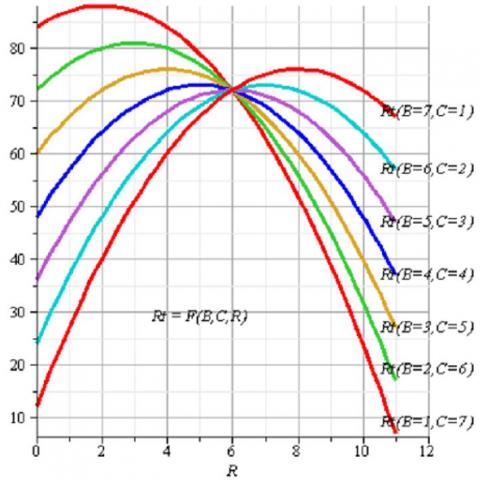
Figure 2. Total aerodynamic resistance for the detailed instance [Rt=f(B,C,R)]
Together with the single aerodynamic resistance (R), Figure 2 displays the “aerodynamic resistance” Rt [Pa] for the circumstance established as an expression of variables B and C.
From our analysis of the diagram, we can infer:
-As the “unit resistance” R increases, the “total resistance” rises significantly to a maximum value, after which it falls to the value.
-When the variable B increases and parameter C's value lowers, the parametric curve's maximum pushes toward the greater values of the unit resistance.
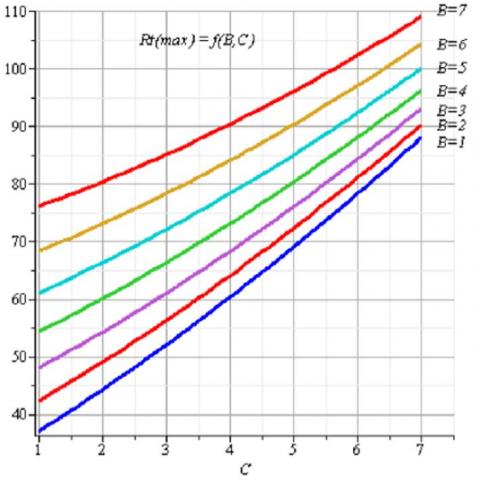
The “maximum aerodynamic resistance” Rt(max) [Pa] is plotted against parameters B and C in Figure 3. From our analysis of this diagram, we can infer:
Figure 3. The highest value of the elaborated case's “total aerodynamic resistance”, expressed as $R_{t(\text { maximum })}=f(B, C)$
The maximum value of the “total aerodynamic resistance” corresponds to the greater measure of “parameter” B with an increase in parameter C. For the lowest value of the “parameter” B, the corresponding parametric curve's growth trend is more noticeable.
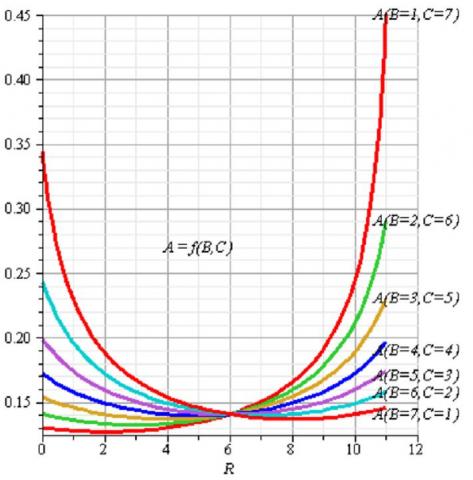
Figure 4. Equivalent holes as a function of unit resistance, B, and C
The corresponding hole of mine A [m2] is plotted against variables B, C, and R in Figure 4. Drawing conclusions from the diagram analysis:
-The corresponding hole reduces significantly to a minimal value as the unit resistance R increases, and then it increases.
-The parametric curves with the variables B and C increasing and decreasing respectively, drive the minimum towards the greater values of the “unit resistance” R, making the changing trend less noticeable.
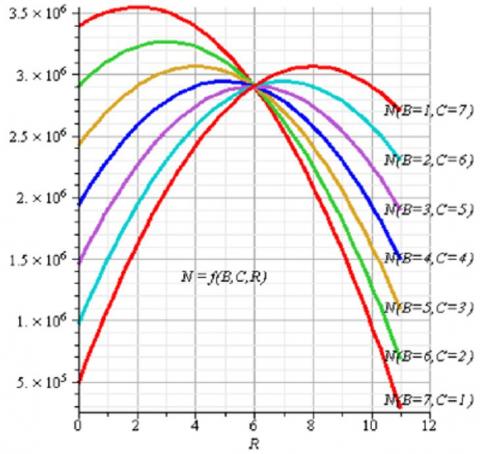
Figure 5. Fan drive at the proper power “$N=f(B, C, R)$”
The required power N[W] to operate the fan is shown graphically in Figure 5 as an expression of B, C, and R. After the chart has been analysed, the following conclusions may be drawn: The power grows significantly to a maximum value and subsequently drops towards the value as the unit resistance (R) increases.
-Maximum values are moved to the right for parametric curves where variable B's value increases and variable C's value decreases, resulting in a less noticeable change trend. The aforementioned diagrams are designed for an “air flow” (Q) of 30 m3/s, an “air flow suppression coefficient” $(\varepsilon)$ of 65%, and a fan efficiency of $\eta$ = 67%.
2.3 Simple parallel connection analysis
Next, the system of two parallel ventilation branches of the ventilation system of the mine will be analyzed. For these two parallel branches, for the corresponding ventilation flow Q1and Q2, and for the adequate resistances R1 and R2 the ratio is valid:
$\frac{Q_1}{Q_2}=\sqrt{\frac{R_2}{R_1}}$ (11)
Considering that q = Q1 + Q2, we can further write:
$R=\frac{R_1}{\left(1+\sqrt{\frac{R_1}{R_2}}\right)^2}=\frac{R_2}{\left(1+\sqrt{\frac{R_2}{R_1}}\right)^2}$ (12)
According to the obtained result, it is observed that the general resistances of the branched ventilation system through parallel branches are smaller than the minimum resistances of each branch.
3.1 Analysis of the elaborated problem of the COVID-19 pandemic
The analysis of the elaborated problem is of special importance also in relation to the emergence of the COVID-19 pandemic. Such a thing can also be verified according to the normal distribution.
Assume that the continuous random variable $R$ of the resistance to air flow of the ventilation system in the mine is separated by the normal distribution $R \sim N(\mu, \sigma)$, and that the density of the distribution is given by:
$f(R)=\frac{1}{\sigma \sqrt{2 \pi}} \exp \left[-\frac{(R-\mu)^2}{2 o^2}\right]$ (13)
The probability that the random variable $R \sim N(\mu, \sigma)$, takes the values in the time interval $(a, b)$ is equal to:
$\begin{aligned} P(a<R<b) & =P\left(\frac{a-\mu}{\sigma}<\frac{R-\mu}{\sigma}<\frac{b-\mu}{\sigma}\right) \\ & =P\left(t_1<T<t_2\right)\\ & =\frac{1}{\sqrt{2 \pi}} \int_{t_1}^{t_2} \exp \left(-\frac{t^2}{2}\right) d t\end{aligned}$ (14)
Now it is obtained $t_1=(a-\mu) / \sigma$ and $t_2=(b-\mu) / \sigma$.
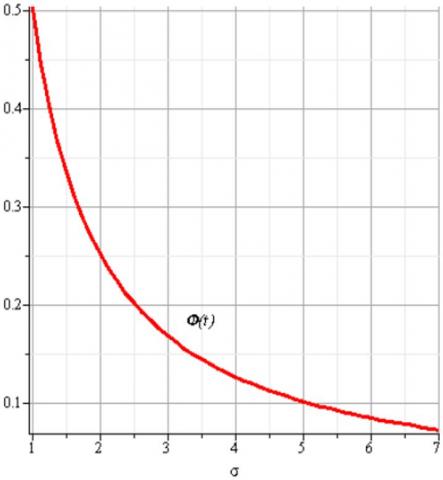
Figure 6. Laplace function according to dependence Eq. (15)
If the Laplace function as shown in Figure 6 is taken into consideration:
$\Phi(t)=\frac{1}{\sqrt{2 \pi}} \int_{t_1}^{t_2} \exp \left(-\frac{t^2}{2}\right) d t$ (15)
According to Eqs. (14) and (15) it is obtained:
$P(a<R<b)=\Phi(t)$ (16)
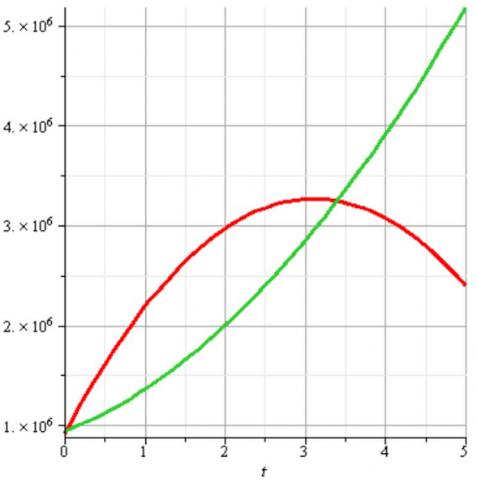
Figure 7. General social-economic and medical losses to the number of patients affected by COVID-19
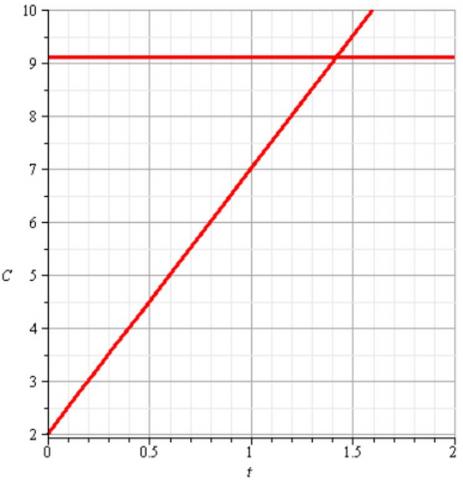
Figure 8. Assigning the maximum value of total losses to the detailed problem
Taking into account the values of the total resistances that are reached in the ventilation systems in the mine, we conclude that the probability of COVID-19 over time is always decreasing. This is as a result of the medical measures that are applied for the phenomenon in question.
3.2 Economic, social and political issues raised by the COVID-19 pandemic
Because of several global social and environmental changes brought about by economic development, highly contagious illnesses that have spread to become pandemics, as COVID-19, pose a severe threat to public health and the economy [14, 15]. The world's population has grown significantly since the start of the Industrial Revolution due to economic progress, which has also resulted in an increase in urbanization and concentration in big cities. Human population density is higher than it has ever been. Additionally, there has been a significant increase in human migration across all geographic dimensions. These components encourage the emergence and spread of novel infectious illnesses. This is particularly clear when it comes to corona viruses, such various influenza types. This is particularly evident in the case of the corona viruses, which include the more recent COVID-19 and several influenza sub-types. Since the occurrence of COVID-19 is dependent on the state of an individual's surroundings, it essentially includes an environmental health concern [13, 15].
Determining how COVID-19 will eventually compare to past pandemics is still premature. But just like the "Spanish" flu, it became a global pandemic. The WHO proclaimed it to be a pandemic in March 2020 after it was first reported in Wuhan in November of 2019 [15]. People in the majority of countries quickly become afflicted.
Similar to SARS, another closely related corona virus, and the “Spanish” flu, its primary modes of transmission are droplets and sneezing [14]. Despite being less fatal than the "Spanish" flu and considerably less likely to claim the lives of younger people, an alarming number of individuals have already died from it globally [14]. Furthermore, it severely curtailed (and disturbed) social and economic life. Nonetheless, the availability of advancements in information and communication technology (ICT) has significantly reduced its negative consequences. This has maintained social contact and allowed many people—though not all—to work from home.
Whether or not the COVID-19 pandemic will result in long-term changes to the political, social, and economic landscape is an intriguing subject. One possibility, though, is that it will significantly accelerate and sustain the increased use of the internet while also permanently increasing the incidence of working from home [14].
A simple analysis of the COVID-19 pandemic can also be obtained according to Figure 7. The given curve with the maximum expresses the social-economic expenses for the pandemic, while the curve without a maximum, with an increasing trend, expresses the medical expenses for the number of affected patients with a pandemic, so that the total social-economic and medical losses are graphically presented with the area between these two curves, so that the losses are given as a function of time (for different periods of time, t).
From the diagram it is clear that these total losses change during the treatment of the pandemic, which means that these losses stand out with an extreme maximum value.
In the example given in the figure, a characteristic example is given:
1. Social-economic losses are now expressed in the following form:
$S E C=9.143 \cdot 10^5+1.151 \cdot 10^5 \cdot t-2.429 \cdot 10^5 \cdot t^2$ (17)
2. Medical losses to the possibilities of placing patients, for the given hospital capacities, are now given by:
$M C=9.350 \cdot 10^5+3.158 \cdot 10^5 \cdot t+1.068 \cdot 10^5 \cdot t^2$ (18)
It is clear that the total losses are now:
$\begin{aligned} T C= & S E C-M C=-20714.286 +1.196 \cdot 10^6 \cdot t-3.496 \cdot 10^5 \cdot t^2\end{aligned}$ (19)
Next, the general losses to the linear constraint of the form will be analyzed:
$A+B t=C$ (20)
so that the economic parameters A, B and C are determined according to the monitoring of the pandemic.
Furthermore, the Lagrange function can be presented as follows:
$\begin{aligned} L(t, \lambda)= & -20714.286+1.196 \cdot 10^6 \cdot t -3.496 \cdot 10^5 \cdot t^2+\lambda(A+Bt=C)\end{aligned}$ (21)
So that λ is the Lagrange multiplier.
Looking for the partial derivatives $\partial L / \partial t=0$ and $\partial L /$ $\partial \lambda=0$, we obtain:
$\begin{gathered}t=\frac{C-A}{B} \\ \lambda=-\frac{0.0002\left(5.978 \cdot 10^9 \cdot B+3.496 \cdot 10^9 \cdot A-3.496 \cdot 10^9 \cdot C\right)}{B^2}\end{gathered}$ (22)
In Figure 8, the general losses for the analyzed case are graphically presented, in the cut of the curve of total losses and direction as a constraint, understood for the relevant time period (It’s done A=2, B=5, C=12).
3.3 Statistical evaluation of the relevant issues
Determining the “coefficient of elasticity” (EC), is more crucial for managing the statistical analysis of the issue at hand.
$E C(X, Y)=\frac{\partial(Y, X)}{\partial X} \cdot \frac{X}{Y}$ (23)
So that in the following diagrams the coefficient of elasticity is marked with KE.
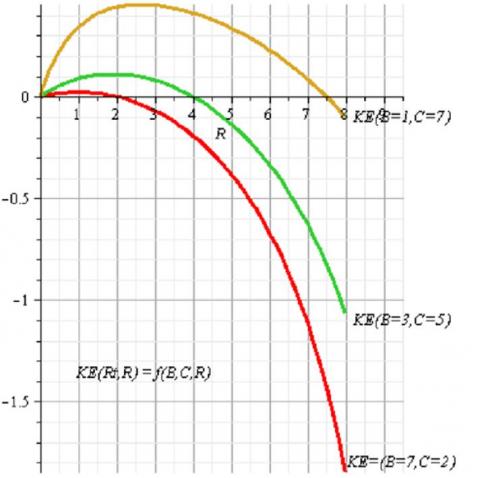
The “coefficient of elasticity” between the unit resistance {R, Pa} and the total resistance (Rt, Pa) is displayed in Figure 9. Conclusion drawn from the diagram analysis:
-As the “unit resistance” increases, the “coefficient of elasticity” rises to a peak and then falls toward the value, taking both “positive (+) and negative (−)” values into consideration.
-The biggest value of parameter C and the smallest value of parameter B have higher maximum values of the coefficient in question, which lessens the prominence of the changing trend.
-For example, the maximum value of the coefficient 0.45 is attained when R = 2.5 for the parametric curve KE (where B and C are 1 and 7 respectively) as shown in Figure 10.
Accordingly, for every 1% change in the unit resistance R, the "total resistance" increases by 0.45%, etc.
Figure 9. Elasticity coefficient of the total resistance (Rt, Pa) in relation to the single resistance (R, Pa)
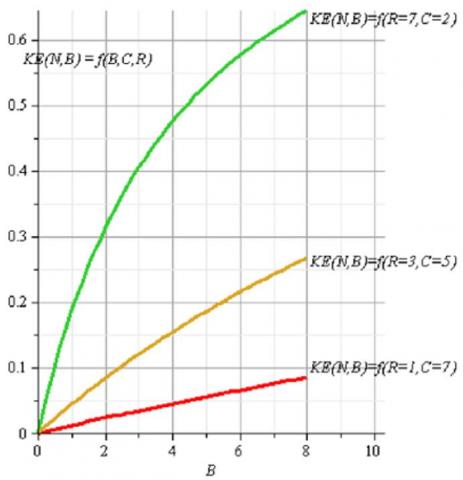
Figure 10. Coefficient of elasticity of fan power “KE(N, B) in function of parameters R,C,B.”
3.4 Implications of findings for managing health risks in mines during pandemics
The findings of this study hold significant implications for managing health risks in mines during pandemics, especially in a scenario such as the COVID-19 pandemic. By optimizing ventilation networks, the spread of airborne contaminants within the mines, is greatly reduced, thus mitigating the risk of disease transmission among workers. Implementing parallel ventilation branches ensures consistent airflow distribution, minimizing areas of stagnant air where viruses may accumulate. Moreover, conducting socio-economic and medical analyses enables operators to understand the broader impact of pandemics on workforce health and productivity, guiding decision-making processes for preventive measures and resource allocation.
Furthermore, probability analysis aids in proactive risk management. This allows operators to identify high-risk areas for contamination and implement targeted interventions. By undertaking preventive measures, mine operators can inculcate a culture of safety and disease prevention among workers, as this would further reduce health risks (especially by breaking the chain of transmission) during pandemics.
Overall, the study underscores the critical role of ventilation system optimization, strategic planning, and preventive measures in managing health risks in mines during pandemics. By incorporating the findings from this study into practice and policy, mine operators can safeguard the health and well-being of their workforce and at the same time maintain operational efficiency in difficult times.
The issue of determining ventilation networks in respect to the mine's workshop ventilation is covered in the study. Emphasis is placed on the many kinds of ventilation network characteristic systems. It is explained how to calculate the total resistance, the depression's size, the equivalent holes, and the fan's required driving power. The paper also presents the case when the air ventilation of the ventilation system in the mine is also carried out through parallel ventilation branches. The socio-economic and medical analysis of the emergence of the COVID-19 pandemic has also been presented. It has been shown that the general losses are generally distinguished by an extreme maximum value, and how it should be done so that the total losses are as small as possible. Of particular importance, it should be noted that for the total resistances achieved in the ventilation system in mines, through the normal distribution, the probability of the extinction trend of this phenomenon can also be determined. It has been established that as a result of the preventive measures undertaken, COVID-19 is a pandemic that can be fought and reduced to the greatest extent possible.
Additionally, the approach of statistically managing the given problem is presented.
Based on the finding of this study, the following recommendations for practice and policy have been made: the need for implementation of parallel ventilation branches, as this would enhance the distribution of the airflow within the mine; also, mine operators should prioritize optimization of ventilation networks. This can be done by calculating total resistance, depression size, equivalent holes and fan driving power. Furthermore, performing socio-economic and medical analysis, as presented in the study will give operators (of mines) adequate understanding of the impact of airborne diseases such as the coronavirus.
|
Q |
amount of air circulating in the system |
|
R |
total resistance of the serial aeration system |
|
n |
fan utilization coefficient |
|
A |
the cross-sectional area of the flow branch |
|
v |
flow velocity |
|
Nv |
required ventilation fan power |
|
Rt |
total aerodynamic resistance |
|
EC |
coefficient of elasticity |
|
Greek symbols |
|
|
ε |
coefficient of contraction (suppression) of the air stream |
|
λ |
Lagrange multiplier |
|
L(t, λ) |
Lagrange function |
[1] Ericsson, M., Löf, O. (2019). Mining’s contribution to national economies between 1996 and 2016. Mineral Economics, 32(2): 223-250. https://doi.org/10.1007/s13563-019-00191-6
[2] Dorin, I., Diaconescu, C., Topor, D.I. (2014). The role of mining in national economies. International Journal of Academic Research in Accounting, Finance and Management Sciences, 4(3): 155-160. https://doi.org/10.6007/IJARAFMS/v4-i3/1116
[3] Hussain, C.M., Paulraj, M.S., Nuzhat, S. (2022). Source reduction and waste minimization in mining industries. Source Reduction and Waste Minimization, pp. 169-176. https://doi.org/10.1016/B978-0-12-824320-6.00011-3
[4] Dolinskii, V.A., Krivtsun, G.P., Aleksienko, S.A., Kirin, R.S., Rybalko, N.P. (1990). Reducing aerodynamic resistance of mine shafts. Izvestiya Vysshikh Uchebnykh Zavedenij, Gornyj Zhurnal; (USSR).
[5] Abramov, F.A., Shinkovskii, V.A., Dolinskii, V.A. (1981). Reducing aerodynamic resistance of shafts-a way of energy resource conservation. Ugol'; (USSR).
[6] Zapletal, P., Kosowski, M., Vokurka, M. (2019). Updating the aerodynamic resistance for subsurface ventilation. GeoScience Engineering, 65(1): 37-45. https://doi.org/10.35180/gse-2019-0004
[7] FRIBORSKY, V. (1950). Effect of ventilation of mines on health and productivity of miners. Bratislavske Lekarske Listy, 30(S2): 1-32.
[8] Mayala, L.P., Veiga, M.M., Khorzoughi, M.B. (2016). Assessment of mine ventilation systems and air pollution impacts on artisanal tanzanite miners at Merelani, Tanzania. Journal of Cleaner Production, 116: 118-124. https://doi.org/10.1016/j.jclepro.2016.01.002
[9] Massanés, M.B., Pera, L.S., Moncunill, J.O. (2015). Ventilation management system for underground environments. Tunnelling and Underground Space Technology, 50: 516-522. https://doi.org/10.1016/j.tust.2015.09.001
[10] Reddy, A.C. (2009). Development of a coal reserve GIS model and estimation of the recoverability and extraction costs. Master thesis, West Virginia University.
[11] García-Herrero, S., Mariscal, M.A., García-Rodríguez, J., Ritzel, D.O. (2012). Working conditions, psychological/physical symptoms and occupational accidents. Bayesian network models. Safety science, 50(9): 1760-1774. https://doi.org/10.1016/j.ssci.2012.04.005
[12] Kurnia, J.C., Sasmito, A.P., Mujumdar, A.S. (2014). Simulation of a novel intermittent ventilation system for underground mines. Tunnelling and Underground Space Technology, 42: 206-215. https://doi.org/10.1016/j.tust.2014.03.009
[13] Allen, C., Keen, B. (2008). Ventilation on demand (VOD) project–vale Inco ltd. Coleman mine. In 12th US/North American Mine Ventilation Symposium, Reno, NV., pp. 45-50.
[14] Tisdell, C.A. (2020). Economic, social and political issues raised by the COVID-19 pandemic. Economic Analysis and Policy, 68: 17-28. https://doi.org/10.1016/j.eap.2020.08.002
[15] Hu, B., Guo, H., Zhou, P., Shi, Z.L. (2021). Characteristics of SARS-CoV-2 and COVID-19. Nature Reviews Microbiology, 19(3): 141-154. https://doi.org/10.1038/s41579-020-00459-7
[16] Elezaj, S., Livoreka, R. (2022). Impact of innovation types on enterprises sales growth: Evidence from Kosovo. International Journal of Sustainable Development and Planning, 17(5): 1571-1578. https://doi.org/10.18280/ijsdp.170521
[17] Elezaj, S., Ramaj, V., Elezaj, R., Ukaj, F. (2023). A Mathematical Modelling of Engineering Problems, 10(5): 1785-1790. https://doi.org/10.18280/mmep.100530
[18] Elezaj, S. (2020). Operational and statistical management in relation to determination of aerodinamic resistance on mining lines. In UBT International Conference, Lipjan, Kosovo, p. 448. https://doi.org/10.33107/ubt-ic.2020.300
[19] Thornton, G.M., Fleck, B.A., Fleck, N., Kroeker, E., Dandnayak, D., Zhong, L., Hartling, L. (2022). The impact of heating, ventilation, and air conditioning design features on the transmission of viruses, including the 2019 novel coronavirus: A systematic review of ultraviolet radiation. PloS One, 17(4): e0266487. https://doi.org/10.1371/journal.pgph.0000552
[20] Luongo, J.C., Fennelly, K.P., Keen, J.A., Zhai, Z.J., Jones, B.W., Miller, S.L. (2016). Role of mechanical ventilation in the airborne transmission of infectious agents in buildings. Indoor Air, 26(5): 666-678. https://doi.org/10.1111/ina.12267