Basheer Al-Hadeethi*![]() | Atheer Saleem Almawla
| Atheer Saleem Almawla![]() | Ammar Hatem Kamel
| Ammar Hatem Kamel![]() | Haitham Abdulmohsin Afan
| Haitham Abdulmohsin Afan![]() | Ali Najah Ahmed
| Ali Najah Ahmed![]()
© 2024 The authors. This article is published by IIETA and is licensed under the CC BY 4.0 license (http://creativecommons.org/licenses/by/4.0/).
OPEN ACCESS
A spillway is a significant structure that releases the exceeded water during extreme flood events. It is considered as a safety valve during dams operating. Spillway location at dam body is one of the most important requirements of dam design. Different locations may influence the flow patterns which lead to change in the hydraulic performance of the spillway. In this paper, a numerical model was presented utilizing the Ansys fluent software using the realizable k-ɛ turbulence model to investigate the flow patterns of Mandali Dam's spillway at different locations. The interaction between air and water phases was simulated by using volume of fluid (VOF) model. Moreover, cavitation damage was studied for different flow discharges values. the validation of the numerical model was executed in compression with the measurement of the physical model. A discharge of 1800 m3/s was utilized for validation, while five different discharges; 1800, 1300, 1040, 440, and 67 m3/s were employed to investigate the hydraulic properties. The results show an agreement between numerical model and the physical model. According to the hydraulic properties, the spillway location at the center of the dam is better than its location at the edge of the dam. The discharge coefficient value in scenario one was found to be closer to the physical model value compared to the second scenario. At discharge 1800 and 1300, the discharge coefficient was 2.02 and 1.72, while in scenario two it was 1.46 and 1.21 in comparison with physical model which was 2.06 and 1.99. For cavitation investigations, the numerical model shows that the spillway is safe with no cavitation effects for the whole applied discharge values.
hydraulic structures, flow patterns, Mandali Dam, numerical model, physical model, spillway
The spillways are one of the most important structures for efficient operation and dam safety [1]. They represent a safety valve of dams during dams' operation to discharge water that exceeds a storage volume. The extra water flows from the reservoir and returns back to the main channel of the river over a crest of the spillway. The suitable spillway design must prevent the potential failure risk of the dam overflowing. During the high flow condition, the design must be accomplished to face the problems of high-flow kinetic energy as well as cavitation. The location of the spillway can be designed within the body, alongside, and quite away from the dam depending on many considerations, but usually, it is best built separately from the dam. The spillway's efficiency can measure with discharge coefficient (C) that represents the losses in flow [2-4]. The transition, entrance, and curvature losses form the main losses that must be added to determine the total head and evaluate the reservoir elevations [5, 6].
The change in the flow conditions upstream of the spillway can modify or change the flow properties and lead to deviation from the standard design requirements [7]. These changes require engineers to estimate whether or not the change or deviation will be detrimental to the hydraulic performance of the spillway for example when changing the location of the spillway from the middle of the dam to the side of the dam.
In a large dam when the height of the dam is high in relative to the head of water on the crest of the spillway, approach velocity can be neglected. It is different from a low spillway that has considerable approach velocity and can affect the discharge coefficient in addition to the profile of the spillway crest [8]. In contrast to large dams, when the dam height is low compare to the water head on the crest of spillway the high probability of cavitation is considered [9]. The limited hydrologic data means the evaluation of design head on the crest will be risked and expected head may be less or greater than a real head. The real head on the crest greater than the design head will cause negative pressure pockets and increase velocity for a given discharge which leads to cavitation occurred [10]. Based on the U.S. Bureau of Reclamation, the real head to design head should not exceed 1.33. To investigate all the mentioned flow patterns, the researchers have been employed different methods of modelling. These methods include Physical and numerical modelling.
Physical models were the primary tool that are used for estimating hydraulic characteristics of flow patterns over spillways. But these models have many limitations such as high construction cost which can reach about 10% of dam cost [1], time-consuming operation, and testing as well as there is uncertainty in results because of the scaling effects, especially on small scales. On small scales, there may be an effect of some physical forces on the operation of the physical model, for example surface tension, although these forces are neglected or have no effect on the flow in the structure at the real size.
Therefore, in recent years studies have increased using numerical models for studying and simulating the hydrodynamics behavior of spillways numerically with reasonable lowering for cost and time [11, 12]. The numerical model becomes indispensable for designing a huge hydraulic structure such as dams. Numerical methods can solve the complex flow pattern problems in saved time consumption and saved cost when compared with measured or experimental work [13, 14]. Almawla et al. [15] studied the strains behavior on Haditha Dam's spillway by developing a model depending on ANN techniques and they showed that it can be used for accurate evaluating of the strain on the spillway. The limitation of this study is the lack of measured data, due to the low levels of the river and the fact that the water does not reach the crest of the spillway except twice during the dam's age. Moreover, this study did not consider the effect of the spillway location on the flow patterns or the effect of hydraulic performance on the stress and strain that were resulted from the flow. In current days, the affirmation is to develop a simple technique, which implies low cost, efficient, as well as quick construction, to satisfy the requirements of water in this region [16].
Mohammed et al. [17] examined the numerical model (Flow-3D) to simulate flow on ogee-crested spillway in comparison with physical models. They concluded that the numerical model had provided an agreement with physical models for simulation of water surface profiles despite some discrepancies in cavitation or pressure results. Kim et al. [18] constructed a hydraulic stability improvement for the Karian dam's spillway in Indonesia. They used CFD numerical model and compared the results with a physical model. The numerical model showed that the flow over the spillway is stable with an agreement with the physical model results based on the rating curve and discharge coefficient. However, this study did not investigate the effects of the spillway location on the flow patterns.
Computational fluid dynamics (CFD) is a type of numerical modeling that is used for solving problems that involve fluid flow. Since CFD can provide faster and more economical solution than physical modeling, hydraulic engineers are interested in verifying the capability of CFD software. Aydin et al. [19] studied the cavitation on the spillway surface of a dam with 100m height using a numerical model in compression with experimental observation. The results showed that cavitation occurs after a certain point downstream, depending on cavitation indices.
The location of the spillway can be determined and selected according to the site topography, hydrologic conditions, requirements of water release to the downstream, geology, as well as the safety and economics of the project. The main safety requirements of a dam, spillway must be hydraulically efficient, to avoid the overtopping or overflow discharge particularly in earth-fill dams that are widely used in Iraq. In the current study, the researchers have investigated the effects of spillway different locations within the dam body on the hydraulic performance of the spillway whether it is in the middle of the dam or on one side of the dam. The statistics of the International Dams Council indicates that the major cause of the dam's failure are hydraulic reasons. These are represented by the insufficiency of the design discharge capacity of the spillway, which leads to the failure and collapse of dams. This can help engineers and designers to address any negative impacts on the operation of the watercourse resulting from site selection and avoid their impact on the designed discharge capacity of the spillway.
Numerical models are supported and calibrated by physical models which provide an effective method for designing the spillway and understanding the behavior of the structure in terms of hydraulics and performance efficiency for different operating conditions.
Despite the vast knowledge and understanding of the general ogee shape and its flow patterns, any change in spillway location can change the flow conditions, and modify the shape of the crest. This can lead to deviation from the requirement of standard design. Any changes required to evaluate the flow pattern over the crest and determine if these changes will affect the hydraulic properties of the spillway. The present study investigated the effect of the location of the spillway within the dam body on hydraulic performance, which was not taken into consideration in most previous studies, especially in Iraq.
In this study, Mandali Dam in eastern Iraq was selected as a study area. The flow in the spillway was simulated with two locations (in the middle of the dam, on side of the dam). Then the effect of spillway location on flow properties was studied to assess the hydraulic performance depending on the simulated results of hydraulic model tests. A physical model operation results have been used for calibrating the numerical model and investigating the hydraulic performance of spillways, with selected locations.
Mandali Dam is a small dam (h<15) located in the Diyala governorate at Harran Valley eastern Iraq (Figure 1). The upper valley begins from Iran and crosses the borders in the north of Mandali city. Table 1 shows characteristics of Mandali Dam.
Figure 1. Location of Mandali Dam in Iraq
Table 1. Characteristics of Mandali Dam
|
Centreline Coordinate |
33°47'4.98"N, 45°35'34.51"E |
|
Dam Height |
14 m |
|
Dam Length |
1150 m |
|
Dam Crest Level |
184 m.a.s.l. |
|
Maximum Water Level |
180 m.a.s.l. |
|
Upstream Bed Level |
170 m.a.s.l. |
|
Downstream Bed Level |
165 m.a.s.l. |
|
Maximum Head Over Ogee Spillway |
2.5 m |
|
Spillways Crest Elevation |
180 m.a.s.l. |
|
Spillway Length |
250 m |
|
Free Board |
4.0 m |
|
Spillway Capacity for 5-Year Returns Period |
1723 m³/s |
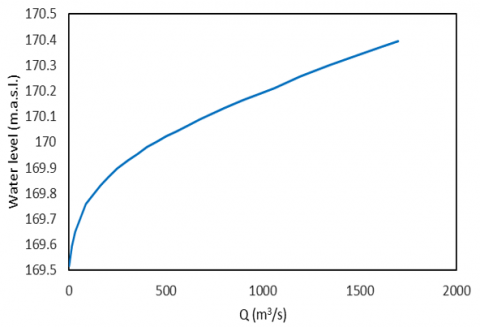
The lowest level in the valley is 163 m.a.s.l, the right abutment elevation is 190 m.a.s.l, while the left abutment is at elevation 189 m.a.s.l. The rating curve of Harran valley at the dam site refers the maximum discharge is 1700 m3/s at 170.35 m.a.s.l as shown in Figure 2.
Figure 2. The rating curve of Harran valley at the dam site [20]
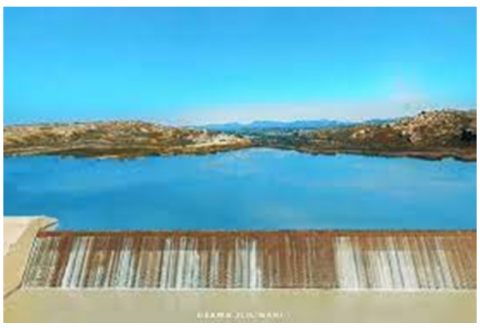
The spillway of the dam is an uncontrolled ogee type weir (Figure 3) with 10m height, 250 m length and a crest level at elevation 180.0 m.a.s.l.
Figure 3. Mandali spillway (Ogee)
The design discharge of spillway is 1724 m3/s while the design head over the crest of spillway is 2.5 m. The stilling basin floor level set at elevation 165 m.a.s.l with 21.5 m length. It contains chute blocks with 0.5 m width 0.5 m height. The dentated still designed with 1 m height, 0.1 m top width, when the distance between teeth is 0.75 m and the out slop of 2:1 about 2.42 m. In Iraq, the hydrological data is too limited therefore dam safety has received a lot of attention from researchers and engineers especially adequate design capacity of the spillway. Inadequate spillway capacity caused potential operation problems such as cavitation which is resulted from the negative pressure on the spillway crest because of high flow conditions. The limited data in many cases considered as the main reason of hydraulic failure of dam. The present study is trying to determine whether the spillway's location in the middle of the dam or on one of its sides affects the spillway's design capacity. Does the spillway's location affect the pressures at the crest of the spillway?
Nowadays, numerical models are widely used for their accurate result and time saver. Thus, utilizing of such simulation techniques is recommended. In this study, a numerical model is introduced. This model was built by employing Ansys fluent software 2020 R1. This software is a powerful software that is capable of simulating complex fluid flow scenarios accurately. It adopts the finite volume method and uses the unstructured triangular mesh for discretization purpose. For turbulence consideration, the software utilizes different closure models to deal with turbulence. In the present study, the k-ε model is used. The k-ε model is a powerful turbulence closure model that is commonly used for simulating flow patterns over spillways [21-23]. The multiphase flow, that includes water flow and air flow was represented by utilizing volume of fluid model (VOF). More details about the model construction are introduced in the following subsections. To analyze fluid flow problems with CFD, four stages must be achieved as following [24]:
1) Describe the flow with mathematical equations that usually are set of partial differential equation;
2) To construct the numerical analogue, fluid flow equations must be discretization;
3) Domain of fluid should be divided into cells or elements;
4) Apply the initial and boundary conditions to solve the equations.
3.1 Governing equation
The governing equation of a CFD model should be capable to capture all the hydrodynamic behavior of fluid during its flow in a domain. The general dimensional Navier Stocks Equations are utilized for this purpose. These equations are built based on the physical principle of mass conservation, momentum conservation, and energy conservation.
The first equation of the set is the continuity equation that represents the summation of the mass rate which inters a specific element of volume of a fluid, the mass rate that leaves this element, and the mass accumulation in this element. The continuity equation is introduced as below [25]:
$\frac{\partial \rho}{\partial t}=\nabla \cdot(\rho \vec{U})=0$ (1)
where, ρ is the density (kg/m3); t is the time (s); and $\vec{U}$ is the velocity vector (m/s).
The second equation of the governing equations set is the momentum equation. This equation is representing the influence of the applied forces on a fluid moving element which equivalents the rate change of momentum according to the principle of newton's second low. The momentum equation is represented as below [26]:
$\frac{\partial}{\partial t}(\rho \vec{U})+\nabla \cdot(\rho \vec{U} \vec{U})=-\nabla p+\nabla \cdot(\tau)+\rho \vec{g}+\vec{F}$ (2)
where, p represents the pressure, τ represents the stresses tensors, $\rho \vec{g}$ is the gravitational body force, and $\vec{F}$ represents the external body forces.
$\tau=\mu\left[\left(\nabla \vec{U}+\nabla \vec{U}^T\right)-\frac{2}{3} \nabla \cdot \vec{U} I\right]$ (3)
where,$(\mu)$ represents the viscosity coefficient and (I) represents the unit tensor.
3.2 Construction of geometry
The three dimensions geometry that represents Mandali Dam spillway and the flow domain was constructed by using Solidwork 2018 software. The geometry was exported to the Ansys fluent software after saving it as Parasold (x,t) format as shown in Figure 4.
3.3 Mesh generation and boundary conditions
Mesh generation is a significant step for numerical simulation process. It can influence the result accuracy dramatically [27]. In addition to above, the number of cells have a great impact on the model accuracy where finer mesh has the most accurate result. Furthermore, it can be time consuming in case of choosing inconvenient mesh type or cell size [28]. In the present study, tetrahedral meshing is used. To reduce the number of cells and the simulation time, symmetry and refinement with suppress the dam body technique were applied to the mesh. The cell size of 1 m is chosen with face sizing 0.4 m. The total number of elements were 1312771 cells.
After setting up the suitable mesh, the assessment of the mesh quality and mesh sensitivity is required for better numerical result where the model stability and result accuracy are governed by the mesh quality. Table 2 shows the state of the chosen mesh quality according to the required criterion that are used for assessing the mesh quality according to the ANSYS Fluent User's Gide [29].
In the numerical model, the domain faces were given different boundary conditions. At the upstream edge, the face divided into two parts, the lower part which represents the water inlet is assumed to be velocity inlet while the upper part was assumed to be air inlet. The edge face at the downstream area which represent the water outlet was assumed to be pressure outlet boundary. The surface of the domain was assumed to be air pressure outlet. For simulation time saving purpose, the boundary symmetry method was adopted. The other edge faces were assumed to be wall as no slip boundary condition. Figure 4 shows the presented three-dimensional model meshing with the boundary conditions.
Figure 4. The meshing of Mandali spillway with the boundary conditions
Table 2. Mesh metric table
|
Mesh Metric |
Element Quality |
Jacobian Ratio |
Aspect Ratio |
Skewness |
Orthogonal Quality |
||||||||||
|
Value |
max |
Min |
Ava. |
max |
Min |
Ava. |
max |
Min |
Ava. |
max |
Min |
Ava. |
max |
Min |
Ava. |
|
|
1 |
0.1235 |
0.815 |
1 |
1 |
1 |
13.14 |
1.158 |
1.92 |
3.03* 10-6 |
0.93 |
0.2566 |
0.0647 |
0.9930 |
0.74224 |
|
State |
Very good |
Excellent |
Excellent |
Excellent |
Very good |
||||||||||
In this study of the physical model, five different discharges were used based on the data recorded at the dam site, and the pressure values at the same points were extracted from the numerical solutions and compared with the physical model results. The physical model has been designed with a 1:50 scale by (Engineering Consultancy Bureau-College of Engineering/University of Al-Mustansiriya University [20]. The discharge values are 1800, 1300, 1040, 440, and 67 m3/s.
4.1 Validation of the model
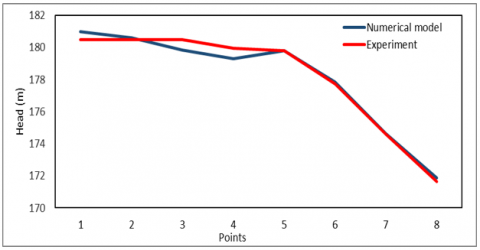
The first step of utilizing the numerical model is testing its validity. Validation test is required to make sure that the model is capable of simulating the water flow through the hydraulic structures. In this test, a comparison was undertaken between the numerical result and the measurements of the experimental work. Two different scenarios that represent the location of the spillway were employed for the validation purposes. These locations include the center of the dam and the edge of the dam. The applied discharge was 1800 m3/s. The pressure head values are represented along the measurement points above the spillway for different sizes of networks. Figure 5 and Figure 6 demonstrate the validation of the numerical model for the two scenarios.
Figure 5. Numerical result compared to the measurement at the center of the dam
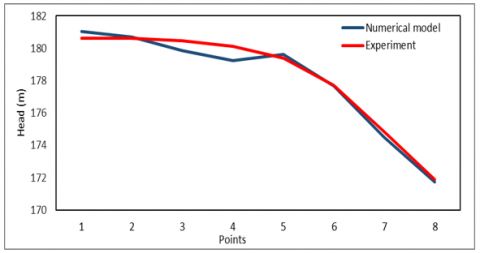
Figure 6. Numerical result compared to the measurement at the edge of the dam
It can be seen that the numerical result shows a good agreement with the measurements for the two cases. This mean that the model is capable of simulating different scenarios of water flow through the spillway at Mandali Dam.
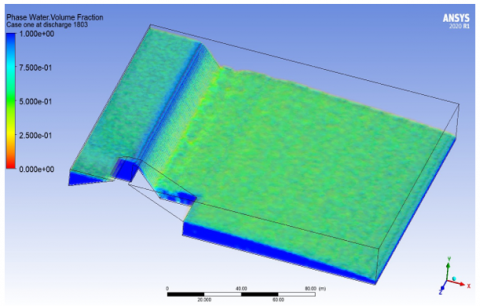
(a) Numerical model
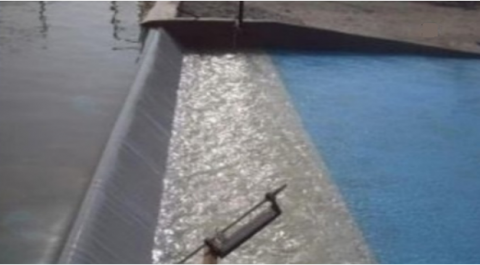
(b) Physical model
Figure 7. Water volume fraction for numerical and physical model
In Figure 7, the phase water volume fraction can be shown. The behavior of water volume fraction was very much like of physical model.
4.2 Rating curve and coefficients of discharge
For investigating of flow patterns, each discharge value was tested with two different scenarios. The first scenario is when the location of the spillway is in the middle of the dam body, while the second scenario is when the spillway is on the right side of the Mandali Dam.
For both cases, the water level at the crest of the spillway was determined and the rating curve was evaluated as well as the discharge coefficient was calculated by using the following equation:
$Q=C . L e . H^{\frac{3}{2}}$ (4)
where, Q=Total discharge (m³/sec); Le=Effective length of the spillway crest (m); He=Total specific energy above the crest; C=Coefficient of discharge.
By comparing these cases and scenarios with physical model, the following results can be obtained.
4.2.1 Case one
As can be seen in Figures 8 and 9, the discharge rates of physical model and numerical model, at the same water level, are very close with an agreement. The physical model for discharge values is slightly greater than the numerical model value but with an acceptable difference.
Figure 8. Rating curve for physical and numerical model
Figure 9. Value of discharge coefficient for both scenarios and physical model
4.2.2 Case two
In this case, the spillway is located on the right side of the dam. Several discharge value simulations are run with the computational domain similar to case one.
The results of the numerical model show a good agreement with the physical model for case one for the rating curve and the discharge coefficient as illustrated in Figure 8 and Figure 9. It can be seen that the values of discharge coefficient are lower than the values in case one and the physical model, which means that the flow patterns are affected. On the other hands, the rating curve is affected too in comparison with physical model and case one.
To obtain a better flow approximation along the chute in the spillway, the grid of computation is aligned with the chute. In general, in case one, the comparison of the water level and its fluctuation between the 3-D numerical model and the physical model show an agreement. The two cases with all discharge values give almost the same results at the most critical part of the spillway which can be subjected for cavitation effects (chute). There are some hydraulic problems downstream the spillway such as the location of the hydraulic jump. In the two cases the hydraulic jump moved upward to the spillway which decrease its efficiency or moved out of the stilling basin and caused failure as shown in Figure 7.
4.3 Cavitation index
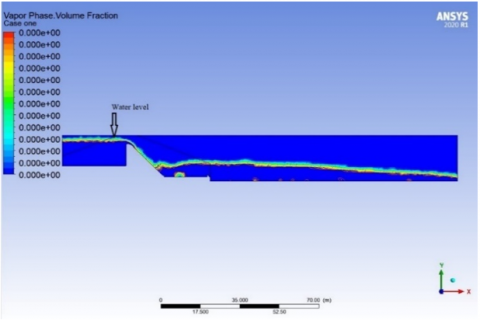
Cavitation can be the most failure causes in spillways which based on the local pressure and velocity. The low pressure, negative, has great importance for cavitation occurring at high velocities sections because low-pressure together with high velocities provide typical conditions for increasing the cavitation risk along the chute spillway. By determining the pressure and velocity at the different sections in the numerical model, it is understood that cavitation may happen because of high velocities on the chute of the spillway. The cavitation risk can be determined in numerical model by using three phases which are (air, water liquid and water vapor). For the two cases, when the pressure distribution along the chute surface is evaluated, it can be noted that there is no negative pressure close to the spillway crest and no significant issue resulting from the low velocities as shown in Figure 10.
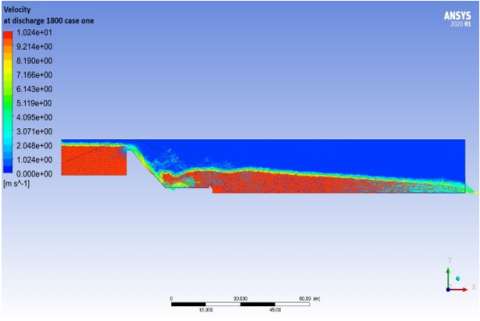
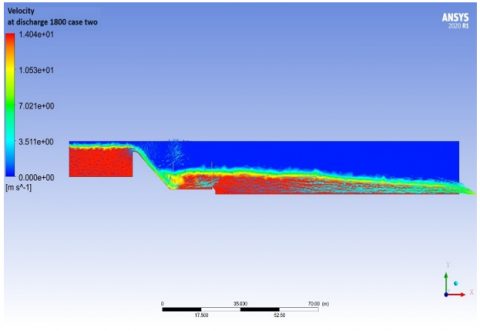
In Figure 10, all values of vapor phase volume fraction were zero, which means that there is no risk of cavitation on Mandali spillway. The contour line of velocity distribution for the two scenarios can be shown in Figure 11.
Figure 10. Vapor phase volume fraction
(a) Case one
(b) Case two
Figure 11. The velocity distribution for two cases at discharge 1800 m3/s
In terms of hydraulic performance, the results showed that the first case represented by the spillway being in the middle of the dam gave a better result. In the first case, the values of the discharge coefficient were higher, which indicates an efficiency in the hydraulic performance, because this means less flow losses. In the second case, that is, when the location of the watercourse is on one of the sides of the dam, the values of the discharge coefficient are lower, which means more losses. As a result, the location of the watercourse has a considerable effect on the efficiency of spillway hydraulic performance. For the indicator of cavitation, the effect of the location of the spillway is through its effect on the discharge coefficient and therefore on the flow velocity that may affect the cavitation. Therefore, the authors recommend taking this into account when suggesting the location of the spillway in dam designs with conducting more studies to investigate the extent of the impact of the location of the spillway on stilling basins.
[1] Rajaa, A.I., Kamela, A.H. (2020). Performance study of fluent-2D and flow-3D platforms in the CFD modeling of a flow pattern over ogee spillway. Anbar Journal for Engineering Sciences, 8: 317-328. https://doi.org/10.26682/sjuod.2017.20.1.56
[2] Chanson, H. (2022). Energy dissipation on stepped spillways and hydraulic challenges—Prototype and laboratory experiences. Journal of Hydrodynamics, 34: 52-62. https://doi.org/10.1007/s42241-022-0005-8
[3] Coleman, H.W., Wei, C., Lindell, J.E. (2004). Hydraulic design of spillways. In Hydraulic Design Handbook, pp. 17-41.
[4] Gautam, H., Ahmad, Z., Sharma, P.K. (2022). CFD-Based modeling for computing discharge coefficient of an ogee spillway. In 9th International Symposium on Hydraulic Structures, Roorkee, India. https://doi.org/10.26077/d3a8-d233
[5] Almawla, A.S., Kamel, A.H., Lateef, A.M. (2021). Modelling of flow patterns over spillway with CFD (Case study: Haditha dam in Iraq). International Journal of Design & Nature and Ecodynamics, 16(4): 373-385. https://doi.org/10.18280/ijdne.160404
[6] Salmasi, F., Abraham, J. (2022). Discharge coefficients for ogee spillways. Water Supply, 22: 5376-5392. https://doi.org/10.2166/ws.2022.129
[7] Güven, A., Mahmood, A.H. (2021). Numerical investigation of flow characteristics over stepped spillways. Water Supply, 21: 1344-1355. https://doi.org/10.2166/ws.2020.283
[8] Salmasi, F., Abraham, J. (2023). Hydraulic characteristics of flow over stepped and chute spillways (Case study: Zirdan Dam). Water Supply, 23: 851-866. https://doi.org/10.2166/ws.2023.011
[9] Foroudi, A., Barati, R. (2022). Experimental study of cavitation index in an ogee spillway by considering convergence angle of sidewalls. Water Supply, 22: 5729-5738. https://doi.org/10.2166/ws.2022.228
[10] Lak, M., Komasi, M. (2023). Numerical investigation of the flow field on the Ogee spillway under the influence of the crest shape and slope of the upstream face of the spillway. Civil Infrastructure Researches, 8(2): 57-68. https://doi.org/10.22091/cer.2022.7342.1329
[11] Runchal, A.K. (2012). The future of CFD and the CFD of the future. Computational Thermal Sciences: An International Journal, 4. https://doi.org/10.1615/ComputThermalScien.2012006511
[12] Zeng, J., Zhang, L., Ansar, M., Damisse, E. and González-Castro, J.A. (2017). Applications of computational fluid dynamics to flow ratings at prototype spillways and weirs. II: Framework for planning, data assessment, and flow rating. Journal of Irrigation and Drainage Engineering, 143: 04016073. https://doi.org/10.1061/(ASCE)IR.1943-4774.0001113
[13] Abdullah, O.S., Kamel, A.H., Khalil, W.H. (2021). Numerical and experimental modelling of small hydropower turbine. Journal of Advanced Research in Fluid Mechanics and Thermal Sciences, 80: 112-127. https://doi.org/10.37934/arfmts.80.1.112127
[14] Majeed, H.Q., Ghazal, A.M., Al-Hadeethi, B. (2022). Experimental and numerical study of open channel flow with T-section artificial bed roughness. Mathematical Modelling of Engineering Problems, 9(6): 1589-1595. https://doi.org/10.18280/mmep.090619
[15] Almawla, A.S., Lateef, A.M., Kamel, A.H. (2022). Modelling the effects of hydraulic force on strain in hydraulic structures using ANN (Haditha dam in Iraq as a case study). Mathematical Modelling of Engineering Problems, 9(1): 150-158. https://doi.org/10.18280/mmep.090119
[16] Kamel, A.H., Afan, H.A., Sherif, M., Ahmed, A.N., El-Shafie, A. (2021). RBFNN versus GRNN modeling approach for sub-surface evaporation rate prediction in arid region. Sustainable Computing: Informatics and Systems, 30: 100514. https://doi.org/10.1016/j.suscom.2021.100514
[17] Mohammed, J.R., Noori, B.M., Hussein, I.A. (2017). Modeling of the hydraulic performance of ogee spillway using computational fluid dynamics (CFD). Journal of Duhok University, 638-653. https://doi.org/10.26682/sjuod.2017.20.1.56
[18] Kim, S.D., Lee, H.J., An, S.D. (2010). Improvement of hydraulic stability for spillway using CFD model. International Journal of the Physical Sciences, 5: 774-780. https://doi.org/10.5897/IJPS.9000305
[19] Aydin, M.C., Isik, E., Ulu, A.E. (2020). Numerical modeling of spillway aerators in high-head dams. Applied Water Science, 10: 42. https://doi.org/10.1007/s13201-019-1126-2
[20] Al-Zubaidi, R.Z., Khalaf, R.M., Salman, S. (2010). Hydraulic performance of Mandali Dam spillway In Iraq. Journal of Environmental Studies, 5: 35-48. https://doi.org/10.21608/jesj.2010.185310
[21] Irzooki, R.H., Mohammed, J.R., Ameen, A.S. (2016). Computational fluid dynamics modeling of flow over stepped spillway. Tikrit Journal of Engineering Sciences, 23: 1-11. https://doi.org/10.25130/tjes.23.3.01
[22] Jahad, U., Al-Ameri, R., Chua, L., Das, S. (2018). Investigating the effects of geometry on the flow characteristics and energy dissipation of stepped spillway using two-dimensional flow modelling. Department of Civil and Environmental Engineering, Faculty of Engineering, 289-296.
[23] Shayanseresht, S., Manafpour, M. (2021). A comparative assessment of various turbulence models applied for simulation of air-water flow over chute spillway. Periodica Polytechnica Civil Engineering, 65: 1200-1212. https://doi.org/10.3311/PPci.18036
[24] Almawla, A.S., Kamel, A.H., Lateef, A.M. (2022). Water flow simulation with computational fluid dynamics (CFD): A review study. International Review of Civil Engineering, 13(1): 20958. https://doi.org/10.15866/irece.v13i1.20958
[25] Wendt, J.F. (2008). Computational Fluid Dynamics: An Introduction. Springer Science & Business Media.
[26] Tey, W.Y., Asako, Y., Sidik, N.A.C., Goh, R.Z. (2017). Governing equations in computational fluid dynamics: Derivations and a recent review. Progress in Energy and Environment, 1: 1-19.
[27] Hirsch, C. (2007). Numerical computation of internal and external flows: The fundamentals of computational fluid dynamics. Elsevier.
[28] Liu, X., Zhang, J. (2019). Computational fluid dynamics: Applications in water, wastewater, and stormwater treatment: EWRI computational fluid dynamics task committee. Computational Fluid Dynamics: Applications in Water, Wastewater and Stormwater Treatment. American Society of Civil Engineers (ASCE). https://doi.org/10.1061/9780784415313
[29] ANSYS. (2013). ANSYS Fluent Theory Guide. In U.S.A.