Fatima Kerkarine![]() | Mohammed Nedjar*
| Mohammed Nedjar*![]()
© 2024 The authors. This article is published by IIETA and is licensed under the CC BY 4.0 license (http://creativecommons.org/licenses/by/4.0/).
OPEN ACCESS
This paper reports the influence of hydrolytic aging on the rupture voltage of copper wire enameled with polyestermide reinforced by a polyamide imide layer. A large population of samples was put in a climatic chamber regulated at 40℃ and 93% relative humidity. The wet aging was carried out until 15000h. Every time of 500h, 80 samples were taken from the climatic chamber and submitted to AC breakdown test. A statistic investigation of breakdown voltage values was done using Weibull model. Scale parameter, shape parameter and confidence intervals are presented. The breakdown voltage changes in function of aging time. The raise is ascribed to the arrangement in the structure of the polymer. While its lowering is assigned to the diminution in the viscosity causing a raise of mean free path of charge carriers. The shape parameter changes versus aging time. The shortening is due to the increase in the size of defects. Whereas its raise is allotted to the arrangement in the structure. TGA shows a variation of the onset temperature and the residue during the aging. The FTIR tests show a weak modification of the spectra. There is no degradation of the insulation, however a change in molecular conformation occurs. The results are analyzed and discussed.
hydrolytic aging, polyesterimide, polyamide imide, breakdown voltage, TGA, FTIR, Weibull statistic
Polymers are extensively employed in electric apparatus (cables, generators, transformers, motors, etc.) because of their excellent electrical and mechanical properties. During their service, polymeric materials are expected to work under the action of moisture. It was indicated that the water content of cable XLPE insulation, after 17778h of immersion in water at 80℃, attained 4000ppm [1]. In electric cable, water can be put during the production, transportation, stocking, laying, service, etc. as mentioned by Nikolajevic [2]. Baschek et al. [3] yielded that water absorption is affected by temperature, time of immersion, thickness of sample, and the amorphous part in a polymer. These researchers indicated that the saturated water contents in polymers vary between 0.3wt% (polycarbonate) and 10wt% (polyamide). Under electric field, the presence of moisture causes poor performance of dielectric materials and can induce rupture by water treeing [4]. Numerous works highlighted the alteration of polymers submitted to hydrolytic aging [5-9].
In a preceding investigation [5], we studied the action of moisture on the breakdown voltage of polyesterimide used in electric motors. The samples were exhibited to 90% relative humidity and 30℃ during 3000h. This investigation shows that the breakdown voltage is altered by the aging.
In another work [6], we investigated the variation of the electrical properties of crosslinked polyethylene (XLPE) under the action of moisture. The specimens were exhibited to 100% relative humidity and ambient temperature until 5600h. The study pointed a change in dielectric loss factor, permittivity, volume resistivity and dielectric strength.
The action of moisture on the dielectric strength of polyamide (aramid) paper was viewed by UI-Haq [7]. Samples were aged in water at 23℃. The author indicated a change of 12.2% in the polymer weight for duration of 2400h (100 days). It was reported a reduction in breakdown strength from 57.96MV/m to 13.11MV/m after aging.
Chauvet et al. [8] examined the influence of humidity on the breakdown strength of XLPE cable. The samples were aged at ambiant temperature, under electric field of 25kV/mm in the presence of water. Baschek et al. [3] found that the water content in the samples changes between 50 and 400ppm before aging and after 720h, respectively. These researchers reported that the wet aging affects the breakdown field of XLPE.
Diaz et al. [9] examined the hydrolytic aging of a thermoplastic polyether ester elastomer (TPEs). The samples thermoplastic polyether were placed in water at 98℃. The authors mentioned that the wet aging induces a raise in cristallinity, and a lessening of tensile strength and strain.
This work focuses on the actions of hydrolytic aging on the breakdown voltage of an insulation composed by polyesterimide and polyamide imide. The use of wires enameled with polyesterimide and polyamide imide has raised quickly because of their excellent resistance to high temperatures, good electrical and chemical properties [10]. The dielectric material is characterized by TGA and FTIR.
2.1 Samples
A spool of enameled copper wire was supplied by “TREFICUIVRE” maker in Algeria”. The diameter of the conduteurs is 0.63mm. The insulation, having a thickness of 33μm, is composed by polyesterimide covered with a thin layer of polyamide imide. The insulation is of class C (200℃).
The samples were performed as a bended copper conductor in agreement with the IEC 60851-5 Standard [11]. The length of the samples is 125mm. A twist includes 12 turns of wire. To avoid bypasses during the experiment of dielectric rupture, the extremities of the specimens were separated. In order to detect any presence of cracks, the samples were checked with a microscope.
2.2 Hydrolytic aging
A large number of samples were introduced in a climatic chamber regulated at 93% relative humidity and a temperature of 40℃. The aging time attained 15000h (625 days). After every aging time of 500h, a sampling of 80 specimens was taken from the climatic chamber.
2.3 Dielectric breakdown test
The samples were submitted to dielectric breakdown by applying an AC voltage of 50Hz frequency, with a velocity of 0.5kV/s. The experiments were accomplished in air, at room temperature. The values of the rupture voltage were recorded.
2.4 Characterization
2.4.1 Thermal gravimetric analysis
The thermal gravimetric analysis (TGA) was controlled with NETZSCH STA 409 PC/PG at temperatures locating between 40 to 1000℃ under a nitrogen atmosphere. A powder was slowly withdrawn from the enameled wire and placed in a crucible. The warming speed is 10℃/min and programmed with a computer. The average mass of the specimens is 1.5mg.
2.4.2 Fournier transform infrared spectroscopy
The insulating material was also examined by Fournier transform infrared spectroscopy (FTIR). Infrared spectra were carried out on JASCO FT/IR in the wavenumber between 4000-500cm-1. The device is connected to a computer.
The obtained values of failure voltage were analysed using Weibull statistic. This last is widely used to treat breakdown statistic data of solid insulating materials [12-16]. The two-parameter Weibull distribution is yielded by the following formula [17]:
$\mathrm{P}(\mathrm{V})=1-\exp \left[-\left(\frac{\mathrm{V}}{\mathrm{V}_{\mathrm{O}}}\right)\right]^\beta$ (1)
where,
P(V): cumulative probability;
V: rupture voltage;
V0: scale parameter that is the value of V corresponding to a cumulative probability of 63.2%;
$\beta$: shape parameter which is the incline of the straight line of Weibull plot.
The different stages of the statistical investigation are displayed below:
The cumulative failure probability Pi was calculated, for Pi was each value of Vi, by the following expression [18]:
$P_i=\frac{i}{N+1} 100 \%$ (2)
with,
i: rank of Vi after a classification by ascending order;
N: total number of samples. In this study, N=80 specimens.
The graph, representing $\log \ln \left(\frac{1}{1-p_i}\right)$ in function of log Vi, was plotted. The Weibull plots were executed by fitting the breakdown data using the maximum likelihood method. The calculation was performed employing a computer program elaborated by “Laboratoire de Génie Electrique de Toulouse, France” currently “LAPLACE”. The best straight line was chosen. The values of V0 and β were deduced. Jacquelin [19] reported that this method is generalized to deal data of dielectric failure.
The 90% confidence intervals were established employing the maximum likelihood method. In this case, we fix a risk of 10% to find an experimental point, belonging to the true distribution, outside the tolerance intervals.
4.1 Statistical analysis
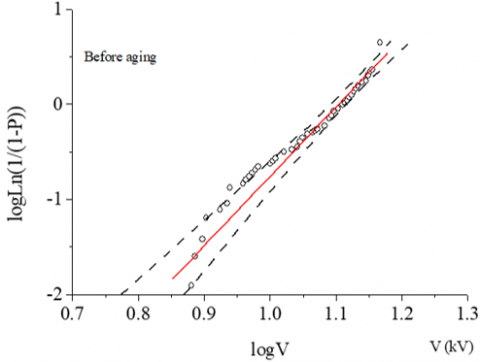
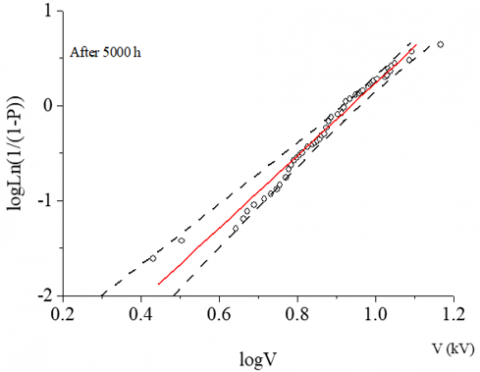
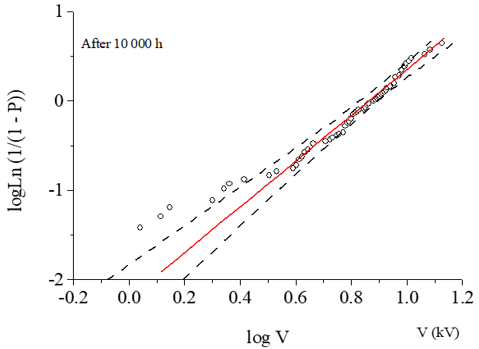
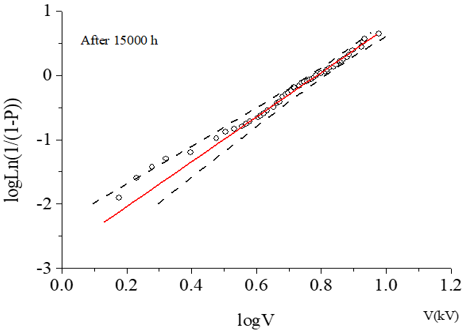
Tables 1-3 presented the values of the nominal breakdown voltage (or scale parameter), the shape parameter, the equations of Weibull plots, and the confidence intervals. For more convenience, only the Weibull plots, matching to unaged samples, and those aged after 5000h, 10000h and 15000h, will be exposed in Figure 1 (a-d).
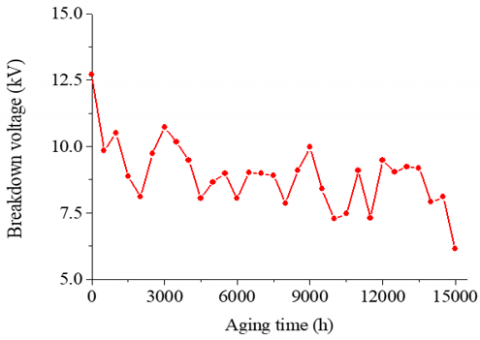
4.2 Change of breakdown voltage in function of aging time
Figure 2 shows the changing of rupture voltage (V0) versus aging time. As one can see, the figures display an irregular development with the presence of various peaks. The variation can be described after:
Table 1. Confidence intervals of breakdown voltage
|
Aging Time (h) |
Breakdown Voltage (kV) |
|
0 |
12.368<V0=12.709<13.056 |
|
500 |
9.385<V0=9.845<10.322 |
|
1000 |
10.062<V0=10.499<10.950 |
|
1500 |
8.472<V0=8.888<9.319 |
|
2000 |
7.603<V0=8.108<8.640 |
|
2500 |
9.252<V0=9.716<10.198 |
|
3000 |
10.288<V0=10.720<11.165 |
|
3500 |
9.739<V0=10.164<10.602 |
|
4000 |
9.009<V0=9.473<9.955 |
|
4500 |
7.655<V0=8.050<8.460 |
|
5000 |
8.215<V0=8.660<9.124 |
|
5500 |
8.597<V0=8.978<9.371 |
|
6000 |
7.630<V0=8.041<8.469 |
|
6500 |
8.671<V0=9.010<9.358 |
|
7000 |
8.545<V0=8.982<9.436 |
|
7500 |
8.389<V0=8.895<9.425 |
|
8000 |
7.381<V0=7.866<8.376 |
|
8500 |
8.630<V0=9.099<9.588 |
|
9000 |
9.517<V0=9.967<10.433 |
|
9500 |
7.933<V0=8.400<8.900 |
|
10000 |
6.743<V0=7.286<7.866 |
|
10500 |
6.777<V0=7.455<8.192 |
|
11000 |
8.660<V0=9.101<9.559 |
|
11500 |
6.723<V0=7.299<7.917 |
|
12000 |
9.011<V0=9.466<9.938 |
|
12500 |
8.605<V0=9.042<9.496 |
|
13000 |
8.737<V0=9.234<9.753 |
|
13500 |
8.652<V0=9.178<9.73 |
|
14000 |
7.413<V0=7.906<8.425 |
|
14500 |
7.602<V0=8.093<8.610 |
|
15000 |
5.802<V0=6.143<6.500 |
(a)
(b)
(c)
(d)
Figure 1. Weibull plot of breakdown voltage: (a) before aging; (b) after 5000h of aging; (c) after 10000h of aging; (d) after 15000h of aging
Table 2. Equations of Weibull graphs
|
Aging Time (h) |
Equation of Weibull Plot |
|
0 |
Y=7.294X-8.054 |
|
500 |
Y=4.146X-4.116 |
|
1000 |
Y=4.666X-4.764 |
|
1500 |
Y=4.140X-3.928 |
|
2000 |
Y=3.085X-2.803 |
|
2500 |
Y=4.056X-4.005 |
|
3000 |
Y=4.897X-5.045 |
|
3500 |
Y=4.613X-4.649 |
|
4000 |
Y=3.952X-3.839 |
|
4500 |
Y=3.947X-2.669 |
|
5000 |
Y=3.763X-3.528 |
|
5500 |
Y=4.578X-4.364 |
|
6000 |
Y=3.785X-3.426 |
|
6500 |
Y=5.172X-4.938 |
|
7000 |
Y=3.978X-3.793 |
|
7500 |
Y=3.391X-3.218 |
|
8000 |
Y=3.121X-2.796 |
|
8500 |
Y=3.746X-3.593 |
|
9000 |
Y=4.294X-4.288 |
|
9500 |
Y=3.391X-3.134 |
|
10000 |
Y=2.560X-2.208 |
|
10500 |
Y=2.081X-1.815 |
|
11000 |
Y=3.998X-3.835 |
|
11500 |
Y=2.413X-2.083 |
|
12000 |
Y=4.031X-3.935 |
|
12500 |
Y=4.007X-3.832 |
|
13000 |
Y=3.588X-3.464 |
|
13500 |
Y=3.362X-3.237 |
|
14000 |
Y=3.084X-2.769 |
|
14500 |
Y=3.169X-2.878 |
|
15000 |
Y=3.471X-2.737 |
Table 3. Confidence intervals of shape parameter
|
Aging Time (h) |
Shape Parameter |
|
0 |
6.151<β=7.294<8.352 |
|
500 |
3.496<β=4.146<4.747 |
|
1000 |
3.935<β=4.666<5.343 |
|
1500 |
3.491<β=4.140<4.740 |
|
2000 |
2.602<β=3.085<3.532 |
|
2500 |
3.420<β=4.056<4.644 |
|
3000 |
4.065<β=4.897<5.519 |
|
3500 |
3.884<β=4.613<5.287 |
|
4000 |
3.333<β=3.952<4.525 |
|
4500 |
3.328<β=3.947<4.519 |
|
5000 |
3.173<β=3.763<4.309 |
|
5500 |
3.861<β=4.578<5.242 |
|
6000 |
3.192<β=3.785<4.334 |
|
6500 |
4.361<β=5.172<5.922 |
|
7000 |
3.355<β=3.978<4.555 |
|
7500 |
2.860<β=3.391<3.883 |
|
8000 |
2.632<β=3.121<3.574 |
|
8500 |
3.159<β=3.746<4.289 |
|
9000 |
3.621<β=4.294<4.917 |
|
9500 |
2.860<β=3.391<3.883 |
|
10000 |
2.159<β=2.560<2.931 |
|
10500 |
1.755<β=2.081<2.383 |
|
11000 |
3.371<β=3.998<4.578 |
|
11500 |
2.035<β=2.413<2.763 |
|
12000 |
3.399<β=4.031<4.616 |
|
12500 |
3.379<β=4.007<4.588 |
|
13000 |
3.026<β=3.588<4.108 |
|
13500 |
2.835<β=3.362<3.850 |
|
14000 |
2.601<β=3.084<3.531 |
|
14500 |
2.672<β=3.169<3.629 |
|
15000 |
2.927<β=3.471<3.974 |
Figure 2. Breakdown voltage against aging time
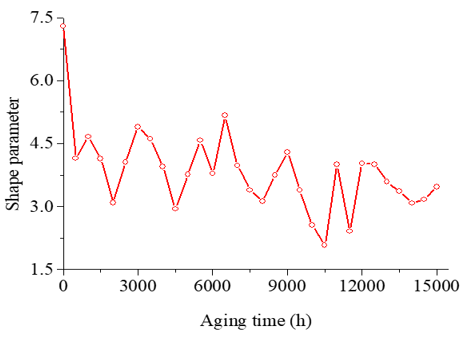
4.3 Change of shape parameter against aging time
The dependence of aging time on shape parameter (β) is presented in Figure 3 which exhibits, like Figure 2, several peaks. The evolutions can be summed below:
Figure 3. Shape parameter against aging time
(a)
(b)
(c)
(d)
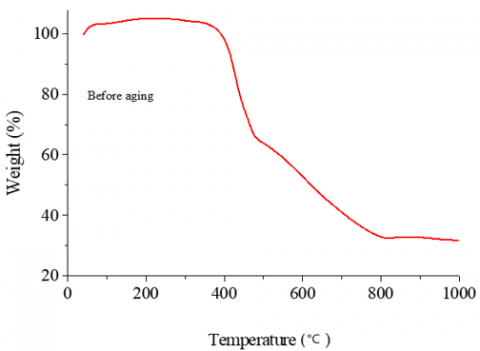
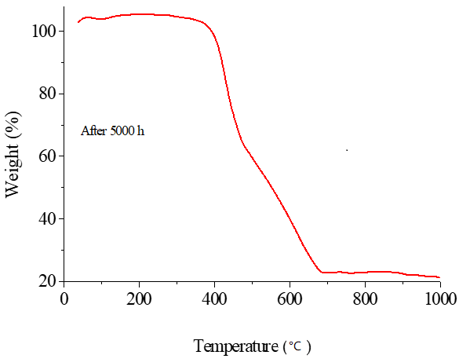
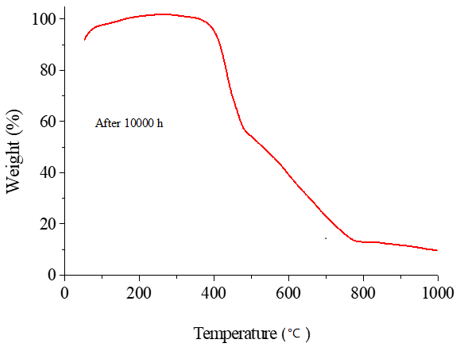
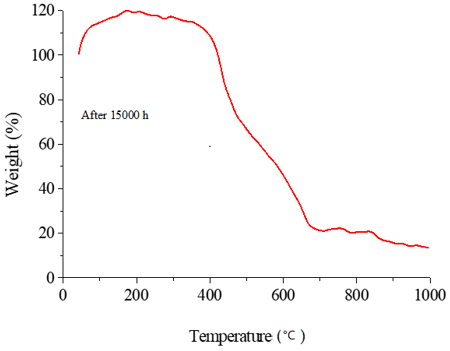
Figure 4. Thermogravimetric analysis curve: (a) before aging; (b) after 5000h of aging; (c) after 10000h of aging; (d) after 15000h of aging
(a)
(b)
(c)
(d)
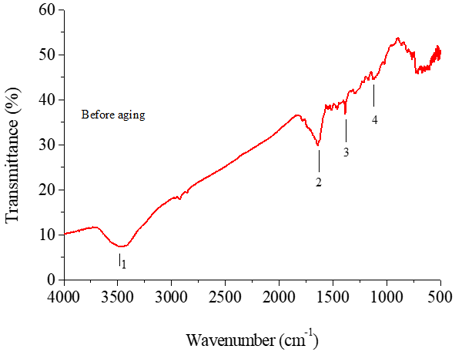
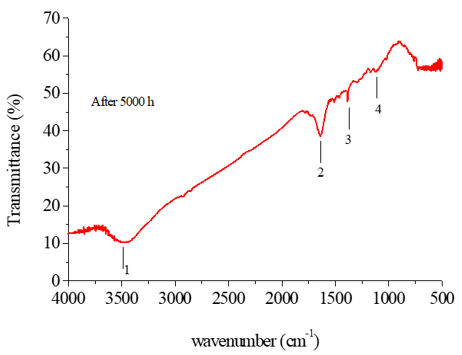
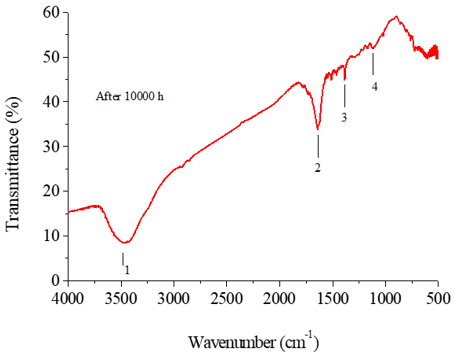
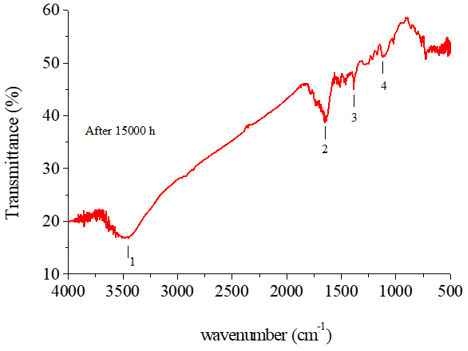
Figure 5. FTIR spectrum: (a) before aging; (b) after 5000h of aging; (c) after 10000h of aging; (d) after 15000h of aging
4.4 Thermal gravimetric analysis
The dependence of temperature on polymer weight is exposed in Figure 4 (a-d). The variations can be depicted as follows:
Table 4. Absorbance bands
|
Absorbance Band Number |
Wavenumber (cm-1) |
|
1 |
3481 |
|
2 |
1637 |
|
3 |
1385 |
|
4 |
1125 |
4.5 Fournier transform infrared spectroscopy
The meaning absorbance bands are displayed in Table 4. FTIR spectra before aging and after 5000h, 10000h and 15000h are shown in Figure 5 (a-d).
4.6 Discussion
[1] Pelissou, S., Wintle, H.J. (1992). Water content of XLPE cable insulation. In Conference Record of the 1992 IEEE International Symposium on Electrical Insulation, Baltimore, MD, USA, pp. 165-168. https://doi.org/10.1109/ELINSL.1992.247028
[2] Nikolajevic, S.V. (1999). The behavior of water in XLPE and EPR cables and its influence on the electric characteristics of insulation. IEEE Transactions on Power Delivery, 14(1): 39-45. https://doi.org/10.1109/61.736677
[3] Baschek, G., Hartwig, G., Zahradnik, F. (1999). Effect of water absorption in polymers at low and high temperatures. Polymer, 40(12): 3433-3441. https://doi.org/10.1016/S0032-3861(98)00560-6
[4] Crine, J.P., Jow, J. (2005). A water treeing model. IEEE Transactions on Dielectrics and Electrical Insulation, 12(4): 801-808. https://doi.org/10.1109/TDEI.2005.1511105
[5] Nedjar, M., Mecheri, Y., Lamure, A., Aufray, M., Drouet, C. (2010). Effect of moisture on breakdown voltage of polyesterimide used in electrical machines. In 2010 Annual Report Conference on Electrical Insulation and Dielectic Phenomena, West Lafayette, IN, USA, pp. 1-4. https://doi.org/10.1109/CEIDP.2010.5724018
[6] Mecheri, Y., Nedjar, M., Lamure, A., Aufray, M., Drouet, C. (2010). Influence of moisture on the electrical properties of XLPE insulation. In 2010 Annual Report Conference on Electrical Insulation and Dielectic Phenomena, West Lafayette, IN, USA, pp. 1-4. https://doi.org/10.1109/CEIDP.2010.5724017
[7] Ul-Haq, S. (2003). Influence of moisture on dielectric strength in polyamide (aramid) paper. In 2003 Annual Report Conference on Electrical Insulation and Dielectric Phenomena, Albuquerque, NM, USA, pp. 325-328. https://doi.org/10.1109/CEIDP.2003.1254859
[8] Chauvet, C., Laurent, C., Mayoux, C. (1989). Influence of wet ageing on the electrical breakdown strength of XLPE cable slices. In Conference on Electrical Insulation and Dielectric Phenomena, Leesburg, VA, USA, pp. 230-234. https://doi.org/10.1109/CEIDP.1989.69551
[9] Diaz, C.M., Gao, X., Robisson, A., Amarante, M., Zhu, S.S. (2018). Effect of hydrolytic degradation on the mechanical property of a thermoplastic polyether ester elastomer. Polymer Degradation and Stability, 155: 35-42. https://doi.org/10.1016/j.polymdegradstab.2018.07.002
[10] Ueda, K. (1989). Progress of magnet wire technology in Japan. IEEE Electrical Insulation Magazine, 5(3): 18-26. https://doi.org/10.1109/57.32445
[11] Wires, W. (2008). Winding wires: Test methods-part 5: Electrical properties. 4th Edition. IEC Standard, 60851-5.
[12] Dissado, L.A., Fothergill, J.C. (1992). Electrical Degradation and Breakdown in Polymers. The Institution of Engineering and Technology.
[13] Diaham, S., Zelmat, S., Locatelli, M.L., Dinculescu, S., Decup, M., Lebey, T. (2010). Dielectric breakdown of polyimide films: Area, thickness and temperature dependence. IEEE Transactions on Dielectrics and Electrical Insulation, 17(1): 18-27. https://doi.org/10.1109/TDEI.2010.5411997
[14] Nedjar, M. (2022). Breakdown behaviour of polyesterimide enamelled wire subjected to thermal aging. Annales de Chimie Science des Matériaux, 46(3): 163-168. https://doi.org/10.18280/acsm.460308
[15] Ben Saidj, I., Nedjar, M., Hocine, S., Belabbas, F. (2022). Effects of hydrothermal aging on the breakdown voltage of polyesterimide. Annales de Chimie Science des Matériaux, 46(2): 95-102. https://doi.org/10.18280/acsm.460205
[16] Nedjar, M., Ould Ouali, S.H. (2011). Statistical investigation of short-term dielectric breakdown of polyesterimide and polyamide imide used in electrical machines. Annales de Chimie Science des Matériaux, 36(2): 59-72. https://doi.org/10.3166/acsm.36.59-72
[17] Stone, G.C., Van Heeswijk, R.G. (1977). Parameter estimation for the Weibull distribution. IEEE Transactions on Electrical Insulation, EI-12(4): 253-261. https://doi.org/10.1109/TEI.1977.297976
[18] IEEE. (1987). IEEE guide for the statistical analysis of electrical insulation voltage endurance data. In ANSI/IEEE Std 930-1987, pp. 1-28 https://doi.org/10.1109/IEEESTD.1987.86250
[19] Jacquelin, J. (1993). Generalization of the method of maximum likelihood (insulation testing). IEEE Transactions on Electrical Insulation, 28(1): 65-72. https://doi.org/10.1109/14.192241
[20] Silverstein, R.M., Webster, F.X., Kiemle, D.J. (2005). Spectroscopic Identification of Organic Compounds. John Wiley & Sons, 7th edition.
[21] Tseng, I.H., Liao, Y.F., Chiang, J.C., Tsai, M.H. (2012). Transparent polyimide/graphene oxide nanocomposite with improved moisture barrier property. Materials Chemistry and Physics, 136(1): 247-253. https://doi.org/10.1016/j.matchemphys.2012.06.061
[22] Chércoles Asensio, R., San Andrés Moya, M., De la Roja, J.M., Gómez, M. (2009). Analytical characterization of polymers used in conservation and restoration by ATR-FTIR spectroscopy. Analytical and Bioanalytical Chemistry, 395: 2081-2096. https://doi.org/10.1007/s00216-009-3201-2.
[23] Hodge, R.M., Edward, G.H., Simon, G.P. (1996). Water absorption and states of water in semicrystalline poly (vinyl alcohol) films. Polymer, 37(8): 1371-1376. https://doi.org/10.1016/0032-3861(96)81134-7
[24] Van Krevelen, D.W. (1976) Properties of Polymers. Elsevier, New York, second Edition.
[25] Ait-Saadi, Z., Nedjar, M. (2023). Electrical properties of polyethylene terephthalate under hydrothermal aging. Mathematical Modelling of Engineering Problems, 10(1): 63-70. https://doi.org/10.18280/mmep.100108
[26] Ueki, M.M., Zanin, M. (1999). Influence of additives on the dielectric strength of high-density polyethylene. IEEE Transactions on Dielectrics and Electrical Insulation, 6(6): 876-881. https://doi.org/10.1109/94.822030
[27] Coppard, R.W., Bowman, J., Dissado, L.A., Rowland, S.M., Rakowski, R.T. (1990). The effect of aluminium inclusions on the dielectric breakdown of polyethylene. Journal of Physics D: Applied Physics, 23: 1554. https://doi.org/10.1088/0022-3727/23/12/011
[28] Katsuta, G., Toya, A., Katakai, S., Kanaoka, M., Sekii, Y. (1991). Influence of defects on insulating properties of XLPE cable. In Proceedings of the 3rd International Conference on Properties and Applications of Dielectric Materials, Tokyo, Japan, pp. 485-489. https://doi.org/10.1109/ICPADM.1991.172103
[29] Zhou, C., Chen, G. (2017). Space charge and AC electrical breakdown strength in polyethylene. IEEE Transactions on Dielectrics and Electrical Insulation, 24(1): 559-566. https://doi.org/10.1109/CEIDP.2015.7352027
[30] Xing, Z.L., Gu, Z.L., Zhang, C., Guo, S.W., Cui, H.Z., Lei, Q.Q., Li, G.C. (2022). Influence of space charge on dielectric property and breakdown strength of polypropylene dielectrics under strong electric field. Energies, 15(12): 4412. https://doi.org/10.3390/en15124412