Waqed H. Hassan![]() | Zahraa Mohammad Fadhe*
| Zahraa Mohammad Fadhe*![]() | Rifqa F. Thiab
| Rifqa F. Thiab![]() | Karrar Mahdi
| Karrar Mahdi![]()
© 2024 The authors. This article is published by IIETA and is licensed under the CC BY 4.0 license (http://creativecommons.org/licenses/by/4.0/).
OPEN ACCESS
This work investigates numerically a local scour moves in irregular waves around tripods. It is constructed and proven to use the numerical model of the seabed-tripod-fluid with an RNG k turbulence model. The present numerical model then examines the flow velocity distribution and scour characteristics. After that, the suggested computational model Flow-3D is a useful tool for analyzing and forecasting the maximum scour development and the flow field in random waves around tripods. The scour values affecting the foundations of the tripod must be studied and calculated, as this phenomenon directly and negatively affects the structure of the structure and its design life. The lower diagonal braces and the main column act as blockages, increasing the flow accelerations underneath them. This increases the number of particles that are moved, which in turn creates strong scouring in the area. The numerical model has a good agreement with the experimental model, with a maximum percentage of error of 10% between the experimental and numerical models. In addition, Based on dimensional analysis parameters, an empirical equation has been devised to forecast scour depth with flow depth, median size ratio, Keulegan-Carpenter (Kc), Froud number flow, and wave velocity that the results obtained in this research at various flow velocities and flow depths demonstrated that the maximum scour depth rate depended on wave height with rising velocities and decreasing particle sizes (d50) and the scour depth attains its steady-current value for Vw < 0.75. As the Froude number rises, the maximum scour depth will be large.
local scour, tripod foundation, Flow-3D, waves
New energy sources have been used by mankind since they become industrialized. The main energy sources have traditionally been timber, coal, oil, and gas, but advances in the science of new energies, such as nuclear energy, have emerged [1, 2]. Clean and renewable energy such as offshore wind has grown significantly during the past few decades. There are numerous different types of foundations regarding offshore wind turbines (OWTs), comprising the tripod, jacket, gravity foundation, suction anchor (or bucket), and monopile [3, 4]. When the water depth is less than 30 meters, Offshore wind farms usually employ the monopile type [4]. Engineers must deal with the wind's scouring phenomenon turbine foundations when planning and designing wind turbines for an offshore environment [5]. Waves and currents generate scour, this is the erosion of soil near a submerged foundation and at its location [6]. To predict the regional scour depth at a bridge pier, Jalal et al. [7-10] developed an original gene expression algorithm using artificial neural networks. Three monopiles, one main column, and several diagonal braces connecting the monopiles to the main column make up the tripod foundation, which has more complicated shapes than a single pile. The design of the foundation may have an impact on scour depth and scour development since the foundation's form affects the flow field [11, 12]. Stahlmann [4] conducted several field investigations. He discovered that the main column is where the greatest scour depth occurred. Under the main column is where the maximum scour depth occurs in all experiments. The estimated findings show that higher wave heights correspond to higher flow velocities, indicating that a deeper scour depth is correlated with finer silt granularity [13] recommends as the design value for a single pile. These findings support the assertion that a tripod may cause the seabed to scour more severely than a single pile. The geography of the scour is significantly more influenced by the KC value (Keulegan–Carpenter number)
The capability of computer hardware and software has made computational fluid dynamics (CFD) quite popular to predict the behavior of fluid flow in industrial and environmental applications has increased significantly in recent years [14].
Finding an acceptable piece of land for the turbine's construction and designing the turbine pile precisely for the local conditions are the biggest challenges. Another concern related to working in a marine environment is the effect of sea waves and currents on turbine piles and foundations. The earth surrounding the turbine's pile is scoured by the waves, which also render the pile unstable.
In this research, the main objective is to investigate numerically a local scour around tripods in random waves. It is constructed and proven to use the tripod numerical model. The present numerical model is then used to examine the flow velocity distribution and scour characteristics.
To simulate the scouring process around the tripod foundation, the CFD code Flow-3D was employed. By using the fractional area/volume method, it may highlight the intricate boundaries of the solution domain (FAVOR).
This model was tested and validated utilizing data derived experimentally from Schendel et al. [15] and Sumer and Fredsøe [6]. 200 runs were performed at different values of parameters.
2.1 Momentum equations
The incompressible viscous fluid motion is described by the three RANS equations listed below [16]:
$\frac{\partial u}{\partial t}+\frac{1}{{{V}_{F}}}\left( u{{A}_{x}}\frac{\partial u}{\partial x}+v{{A}_{y}}\frac{\partial u}{\partial y}+w{{A}_{z}}\frac{\partial u}{\partial z} \right)=-\frac{1}{\rho }\frac{\partial p}{\partial x}+{{G}_{x}}+fx$ (1)
$\frac{\partial v}{\partial t}+\frac{1}{{{V}_{F}}}\left( u{{A}_{x}}\frac{\partial v}{\partial x}+v{{A}_{y}}\frac{\partial v}{\partial y}+w{{A}_{z}}\frac{\partial v}{\partial z} \right)=-\frac{1}{\rho }\frac{\partial p}{\partial y}+{{G}_{y}}+\text{f}y$ (2)
$\frac{\partial w}{\partial t}+\frac{1}{{{V}_{F}}}\left( u{{A}_{x}}\frac{\partial w}{\partial x}+v{{A}_{y}}\frac{\partial w}{\partial y}+w{{A}_{z}}\frac{\partial w}{\partial z} \right)=-\frac{1}{\rho }\frac{\partial p}{\partial z}+{{G}_{z}}+\text{fz}$ (3)
where, respectively, u, v, and w represent the x, y, and z flow velocity components; volume fraction (VF), area fraction (Ai; I=x, y, z), water density (f), viscous force (fi), and body force (Gi) are all used in the formula.
2.2 Model of turbulence
Several turbulence models would be combined to solve the momentum equations. A two-equation model of turbulence is the RNG k-model, which has a high efficiency and accuracy in computing the near-wall flow field. Therefore, the flow field surrounding tripods was captured using the RNG k-model.
2.3 Model of sediment scour
2.3.1 Induction and deposition
Eq. (4) can be used to determine the particle entrainment lift velocity [17].
${{u}_{lift,i}}={{\alpha }_{i}}{{n}_{s}}d_{*}^{0.3}{{\left( \theta -{{\theta }_{cr}} \right)}^{1.5}}\sqrt{\frac{\parallel g\parallel {{d}_{i}}\left( {{\rho }_{i}}-{{\rho }_{f}} \right)}{{{\rho }_{f}}}}$ (4)
$\alpha$i $~$is the Induction parameter, ns the normal vector is parallel to the seafloor, and for the present numerical model, ns=(0,0,1), $\theta$cr is the essential Shields variable, g is the accelerated by gravity, di is the size of the particles, ρi is species density in beds, and d∗ The diameter of particles without dimensions; these values can be obtained in Eq. (5).
${{d}_{*}}={{d}_{i}}{{\left( \frac{\parallel g\parallel {{\rho }_{f}}\left( {{\rho }_{i}}-{{\rho }_{f}} \right)}{\mu _{f}^{2}} \right)}^{1/3}}$ (5)
$\mu$f is this equation a dynamic viscosity of the fluid. cr was determined from an equation based on Soulsby [18].
${{\theta }_{cr}}=\frac{0.3}{1+1.2{{d}_{*}}}+0.055\left[ 1-\text{exp}\left( -0.02{{d}_{*}} \right) \right]$ (6)
The equation was used to determine how quickly sand particles set Eq. (7):
${{\mathbf{u}}_{\text{nsettling},i}}=\frac{{{v}_{f}}}{{{d}_{i}}}\left[ {{\left( {{10.36}^{2}}+1.049d_{*}^{3} \right)}^{0.5}}-10.36 \right]$ (7)
vf$~$stands for fluid kinematic viscosity.
2.3.2 Transportation for bed loads
Van Rijn [19] states that the speed of bed load conveyance was determined as:
${{~}_{\text{bedload},i}}=\frac{{{q}_{b,i}}}{{{\delta }_{i}}{{c}_{b,i}}{{f}_{b}}}$ (8)
fb$~$is the essential particle packing percentage, qb, i is the bed load transportation rate, and cb, I the percentage of sand by volume i. These variables can be found in Eq. (9), Eq. (10), fb, $\mathcal{\delta}$i the bed load thickness.
${{q}_{b,i}}=8{{\left[ \parallel g\parallel \left( \frac{{{\rho }_{i}}-{{\rho }_{f}}}{{{\rho }_{f}}} \right)d_{i}^{3} \right]}^{\frac{1}{2}}}$ (9)
${{\delta }_{i}}=0.3d_{*}^{0.7}{{\left( \frac{\theta }{{{\theta }_{cr}}}-1 \right)}^{0.5}}{{d}_{i}}$ (10)
In this paper, after the calibration of numerous trials, the selection of parameters for sediment scour is crucial. Maximum packing fraction is 0.64 with a shields number of 0.05, entrainment coefficient of 0.018, the mass density of 2650, bed load coefficient of 12, and entrainment coefficient of 0.01.
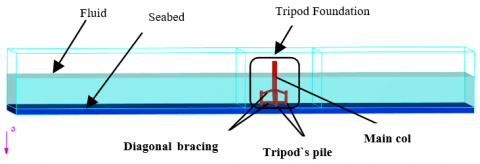
To investigate the scour characteristics near tripods in random waves, the seabed-tripod-fluid numerical model was created as shown in Figure 1. The tripod basis, a seabed, and fluid and porous medium were all components of the model. The seabed was 240 meters long, 40 meters wide, and three meters high. It had a median diameter of d50 and was composed of uniformly fine sand. The 2.5-meter main column diameter D. The base of the main column was three dimensions above the original seabed. The center of the seafloor was where the tripod was, 130 meters from the offshore and 110 meters from the onshore. To prevent wave reflection, the porous media were positioned above the seabed on the onshore side.
Figure 1. An illustration of the numerical model for the seabed-tripod-fluid
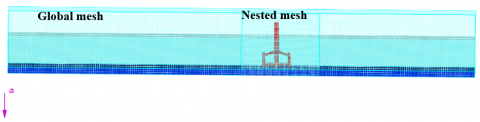
3.1 Generation of meshes
Figure 2 displays the model's mesh for the Flow-3D software grid. The current model made use of two different mesh types: global mesh grid and nested mesh grid. A mesh grid with the following measurements was created by the global hexahedra mesh grid: 240m length, 40m width, and 32m height. Around the tripod, a finer nested mesh grid was made, with dimensions of 0 to 32m on the z-axis, 10 to 30 m on the x-axis, and 25 to 15 m on the y-axis. This improved the calculation's precision and mesh quality.
Figure 2. The mesh block sketch
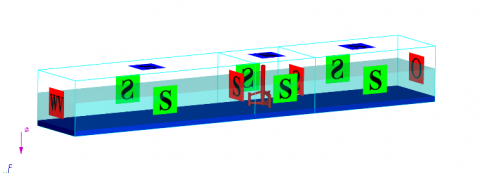
3.2 Conditional boundaries
To increase calculation efficiency, the top side, The model's two x-z plane sides, as well as the symmetry boundaries, were all specified. For u, v, w=0, the bottom boundary wall was picked. The offshore end of the wave boundary was put upstream. For the wave border, random waves were generated using the wave spectrum from the Joint North Sea Wave Project (JONSWAP). Boundary conditions are shown in Figure 3.
Figure 3. Boundary conditions of the typical problem
The wave spectrum peak enhancement factor (=3.3 for this work) and can be used to express the unidirectional JONSWAP frequency spectrum.
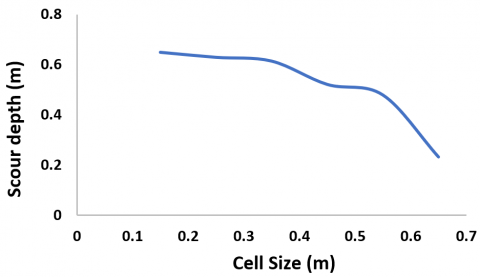
3.3 Mesh sensitivity
Before doing additional research into scour traits and scour depth forecasting, mesh sensitivity analysis is essential. Three different mesh grid sizes were selected for this section: Mesh 1 has a 0.45 by 0.45 nested fine mesh and a 0.6 by 0.6 global mesh size. Mesh 2 has a 0.4 global mesh size and a 0.35 nested fine mesh size, while Mesh 3 has a 0.25 global mesh size and a nested fine mesh size of 0.15. Comparing the relative fine mesh size (such as Mesh 2 or Mesh 3) to the relatively coarse mesh size (such as Mesh 1), a larger scour depth was seen; this shows that a finer mesh size can more precisely represent the scouring and flow field action around a tripod. Significantly, a lower mesh size necessitates a time commitment and a more difficult computer configuration. Depending on the sensitivity of the mesh guideline utilized by Pang et al., when Mesh 2 is applied, the findings converge and the mesh size is independent [20]. In the next sections, scouring the area surrounding the tripod was calculated using Mesh 2 to ensure accuracy and reduce computation time. The working segment generates a total of 14, 800,324 cells.
3.4 Model validation
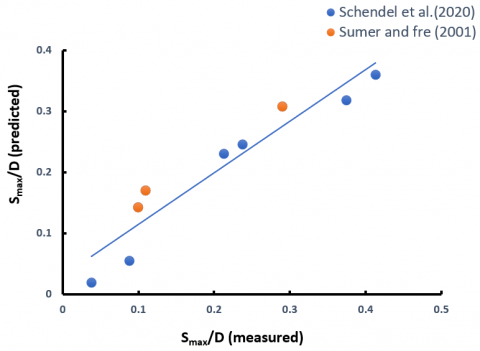
Comparisons between the predicted outcomes from the current model and to confirm that the current numerical model is accurate and suitably modified, experimental data from Sumer and Fredsøe [6] and Schendel et al. [15] were used. For the experimental results of Run 05, Run 15, and Run 22 from Sumer and Fredsøe [6], the experimental A9, A13, A17, A25, A26, and A27 results from Schendel et al. [15], and the numerical results from the current model are shown in Figure 4. The present model had d50=0.051cm, the height of the water wave(h)=10m, and wave velocity=0.854 m.s-1.
Figure 4. Cell size effect
Figure 5. Comparison of the present study's maximum scour depth with that authored by Sumer and Fredsøe [6] and Schendel et al. [15]
According to Figure 5, the highest discrepancy between the numerical results and experimental data is about 10%, showing that overall, there is good agreement between them. The ability of the current numerical model to accurately depict the scour process and forecast the maximum scour depth (S) near foundations is demonstrated by this. Errors in the simulation were reduced by using the calibrated values of the parameter. Considering these results, a suggested simulated scouring utilizing a Flow-3D numerical model is confirmed as a superior way for precisely forecasting the maximum scour depth near a tripod foundation in random waves.
3.5 Dimensional analysis
The variables found in this study as having the greatest impacts, variables related to flow, fluid, bed sediment, flume shape, and duration all had an impact on local scouring depth (t). Hence, scour depth (S) can be seen as a function of these factors, shown as:
$S=f\left(\rho, v, V, h, g, \rho s, d_{50}, \sigma g, V_w, D, d, T_v, t\right)$ (11)
With the aid of dimensional analysis, the 14-dimensional parameters in Eq. (11) were reduced to 6 dimensionless variables using Buckingham's -theorem. D, V, and were therefore set as repetition parameters and others as constants, allowing for the ignoring of their influence. Eq. (12) thus illustrates the relationship between the effect of the non-dimensional components on the depth of scour surrounding a tripod base.
$\frac{S}{D}=f\left(\frac{h}{D}, \frac{d 50}{D}, \frac{V}{V W}, F r, K c\right)$ (12)
where, $\frac{S}{D}$ are scoured depth ratio, $\frac{V}{Vw}$ is flow wave velocity, $\frac{d50}{D}$ median size ratio, $Fr $ represents the Froud number, and $Kc$ is the Keulegan-Carpenter.
4.1 Development of scour
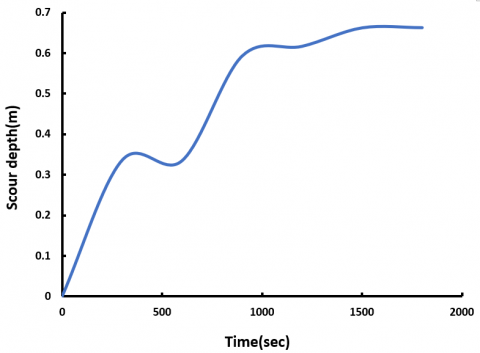
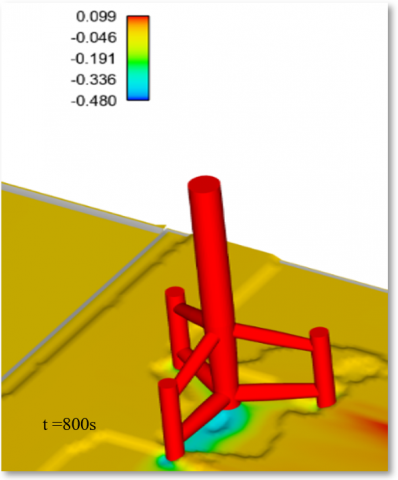
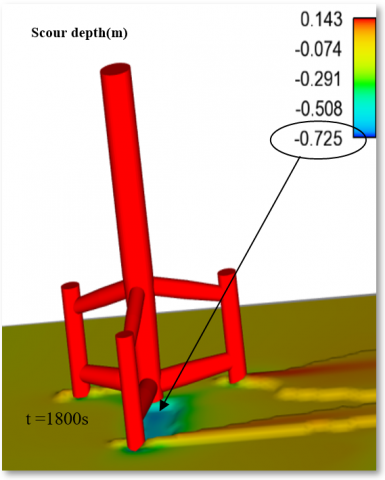
Similar to how the physical model was used, this numerical model was also used. The numerical model's boundary conditions and other crucial variables that directly influence the outcomes were applied (flow depth, median particle size (d50), and wave velocity). After the initial 0-300 s, the scour rate reduced as the scour holes grew quickly. The scour depths steadied for about 1800 seconds before reaching an asymptotic value. The findings of scour depth with time are displayed in Figure 6.
4.2 Features of scour
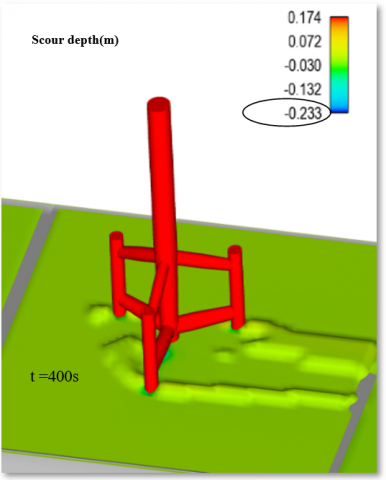
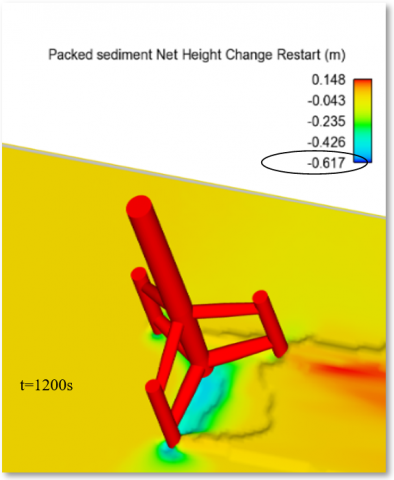
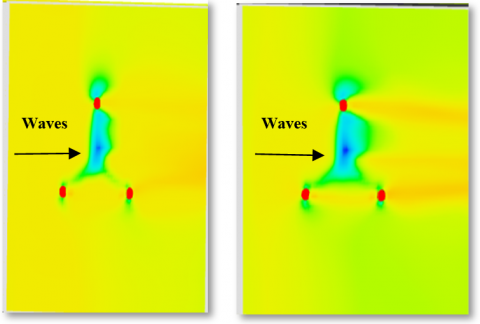
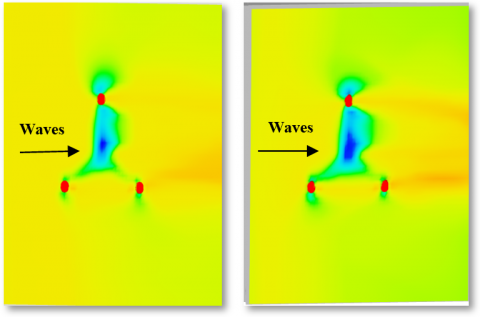
Early on (t=400s), the scour hole began to appear beneath the main column and then began to extend along the diagonal bracing connecting to the wall-facing pile. Gradually, the geography of the scour; of these results is similar to the experimental observations of Stahlmann [4] and Aminoroayaie Yamini et al. [1]. As the waves reached the tripod, there was an enhanced flow acceleration underneath the main column and the lower diagonal braces as a result of the obstructing effects of the structural elements. More particles are mobilized and transported due to the enhanced near-bed flow velocity, it also increases bed shear stress, turbulence, and scour at the site. In comparison to a single pile, the main column and structural components of the tripod have a significant impact on the flow velocity distribution and, consequently, the scour process and morphology. The main column and seabed are separated by a gap, therefore the flow across the gap may aid in scouring. The scour hole first emerged beneath the main column and subsequently expanded along the lower structural components, both Aminoroayaie Yamini et al. [1] and Stahlmann [4] made this claim. Around the tripod, there are several different scour morphologies and the flow velocity distribution as shown in Figures 7 and 8.
Figure 6. Results of scour depth with time
Figure 7. The sequence results of scour depth around tripod development (reached to steady state) simulation time
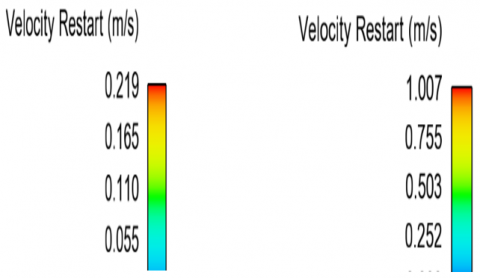
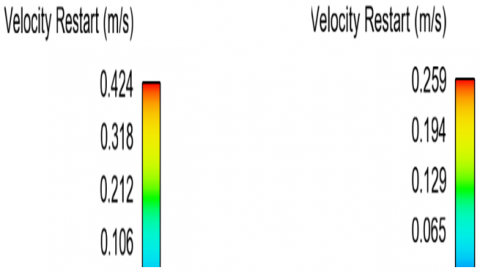
Figure 8. Random waves of flow velocity distribution around a tripod
4.3 Wave velocity's (Vw) impact on scour depth
In this study's section, we looked at how variations in wave current velocity affected the scouring depth. Bed scour pattern modification could result from an increase or decrease in waves. As a result, the backflow area produced within the pile would become stronger, which would increase the depth of the sediment scour. The quantity of current turbulence is the primary cause of the relationship between wave height and bed scour value. The current velocity has increased the extent to which the turbulence energy has changed and increased in strength now present. It should be mentioned that in this instance, the Jon swap spectrum random waves are chosen. The scour depth attains its steady-current value for Vw<0.75, Figure 9 (a) shows that effect. When (V) represents the mean velocity=0.5 m.s-1.
(a)
(b)
(c)
(d)
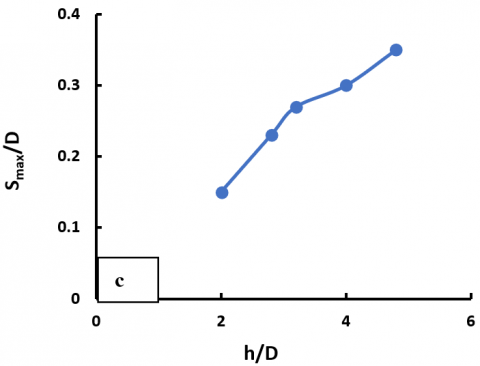
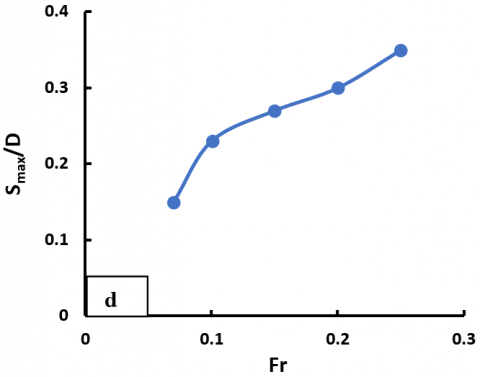
Figure 9. Main effects on maximum scour depth (Smax) as a function of column diameter (D)
4.4 Impact of a median particle (d50) on scour depth
In this section of the study, we looked into how variations in particle size affected how the bed profile changed. The values of various particle diameters are defined in the numerical model for each run numerical modeling, and the conditions under which changes in particle diameter have an impact on the bed scour profile are derived. Based on Figure 9 (b), the findings of the numerical modeling show that as particle diameter increases the maximum scour depth caused by wave contact decreases. When (d50) is the diameter of Sediment (d50). The Shatt Al-Arab soil near Basra, Iraq, was used to produce a variety of varied diameters.
4.5 Impact of wave height and flow depth (h) on scour depth
One of the main elements affecting the scour profile brought on by the interaction of the wave and current with the piles of the wind turbines is the height of the wave surrounding the turbine pile causing more turbulence to develop there. The velocity towards the bottom and the bed both vary as the turbulence around the pile is increased, modifying the scour profile close to the pile. According to the results of the numerical modeling, the depth of scour will increase as water depth and wave height in random waves increase as shown in Figure 9 (c).
4.6 Froude number's (Fr) impact on scour depth
No matter what the spacing ratio, the Figure 9 shows that the Froude number rises, and the maximum scour depth often rises as well increases in Figure 9 (d). Additionally, it is crucial to keep in mind that only a small portion of the findings regarding the spacing ratios with the smallest values. Due to the velocity acceleration in the presence of a larger Froude number, the range of edge scour downstream is greater than that of upstream. Moreover, the scouring phenomena occur in the region farthest from the tripod, perhaps as a result of the turbulence brought on by the collision of the tripod's pile. Generally, as the Froude number rises, so does the deposition height and scour depth.
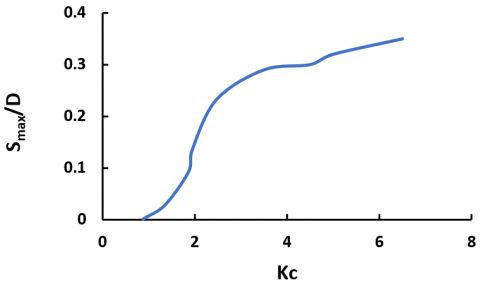
4.7 Keulegan-Carpenter (KC) number
The geography of the scour is significantly more influenced by the KC value. Greater KC causes a deeper equilibrium scour because an increase in KC lengthens the horseshoe vortex's duration and intensifies it as shown in Figure 10.
The result can be attributed to the fact that wave superposition reduced the crucial KC for the initiation of the scour, particularly under small KC conditions. The primary variable in the equation used to calculate This is the depth of the scouring hole at the bed. The following expression is used to calculate the Keulegan-Carpenter number:
$Kc=\frac{Vw*Tp}{D}$ (13)
where, the wave period is Tp and the wave velocity is shown by Vw.
Figure 10. Relationship between the relative maximum scour depth and KC
(1) The existing seabed-tripod-fluid numerical model is capable of faithfully reproducing the scour process and the flow field around tripods, suggesting that it may be used to predict the scour around tripods in random waves.
(2) Their results obtained in this research at various flow velocities and flow depths demonstrated that the maximum scour depth rate depended on wave height with rising velocities and decreasing particle sizes (d50).
(3) A diagonal brace and the main column act as blockages, increasing the flow accelerations underneath them. This raises the magnitude of the disturbance and the shear stress on the seafloor, which in turn causes a greater number of particles to be mobilized and conveyed, as a result, causes more severe scour at the location.
(4) The Froude number and the scouring process are closely related. In general, as the Froude number rises, so does the maximum scour depth and scour range. The highest maximum scour depth always coincides with the bigger Froude number with the shortest spacing ratio.
Since the issue is that there aren't many experiments or studies that are relevant to this subject, therefore we had to rely on the monopile criteria. Therefore, to gain a deeper knowledge of the scouring effect surrounding the tripod in random waves, further numerical research exploring numerous soil, foundation, and construction elements as well as upcoming physical model tests will be beneficial.
|
CFD |
Computational fluid dynamics |
|
FAVOR |
Fractional Area/Volume Obstacle Representation |
|
VOF |
Volume of Fluid |
|
RNG |
Renormalized Group |
|
OWTs |
Offshore wind turbines |
|
Greek Symbols |
|
|
ε, ω |
Dissipation rate of the turbulent kinetic energy, m2s-3 |
|
Subscripts |
|
|
d50 |
Median particle size |
|
Vf |
Volume fraction |
|
GT |
Turbulent energy of buoyancy |
|
KT |
Turbulent velocity |
|
PT |
Kinetic energy of the turbulence |
|
Αi |
Induction parameter |
|
ns |
Induction parameter |
|
$\Theta$cr |
The essential Shields variable |
|
Di |
Diameter of sediment |
|
d∗ |
The diameter of particles without dimensions |
|
µf |
Dynamic viscosity of the fluid |
|
qb,i |
The bed load transportation rate |
|
Cs,i |
Sand particle's concentration of mass |
|
D |
Diameter of pile |
|
Df |
Diffusivity |
|
D |
Diameter of main column |
|
Fr |
Froud number |
|
Kc |
Keulegan–Carpenter number |
|
G |
Acceleration of gravity g |
|
H |
Flow depth |
|
Vw |
Wave Velocity |
|
V |
Mean Velocity |
|
Tp |
Wave Period |
|
S |
Scour depth |
[1] Aminoroayaie Yamini, O., Mousavi, S.H., Kavianpour, M.R., Movahedi, A. (2018). Numerical modeling of sediment scouring phenomenon around the offshore wind turbine pile in marine environment. Environmental Earth Sciences, 77: 1-15. https://doi.org/10.1007/s12665-018-7967-4
[2] Hassan, W.H., Hashim, F.S. (2020). The effect of climate change on the maximum temperature in Southwest Iraq using HadCM3 and CanESM2 modelling. SN Applied Sciences, 2(9): 1494. https://doi.org/10.1007/s42452-020-03302-z
[3] Fazeres-Ferradosa, T., Rosa-Santos, P., Taveira-Pinto, F., Pavlou, D., Gao, F.P., Carvalho, H., Oliveira-Pinto, S. (2020). Preface: Advanced research on offshore structures and foundation design part 2. In Proceedings of the Institution of Civil Engineers-Maritime Engineering. Thomas Telford Ltd, 173(4): 96-99. https://doi.org/10.1680/jmaen.2020.173.4.96
[4] Stahlmann, A. (2013). Numerical and experimental modeling of scour at foundation structures for offshore wind turbines. In ISOPE International Ocean and Polar Engineering Conference. ISOPE, pp. ISOPE-I.
[5] Petersen, T.U., Sumer, B.M., Fredsøe, J. (2014). Edge scour at scour protections around offshore wind turbine foundations. In 7th International Conference on Scour and Erosion. CRC Press, pp. 587-592.
[6] Sumer, B.M., Fredsøe, J. (2001). Scour around pile in combined waves and current. Journal of Hydraulic Engineering, 127(5): 403-411. https://doi.org/10.1061/(ASCE)0733-9429(2001)127:5(403)
[7] Jalal, H.K., Hassan, W.H. (2020). Effect of bridge pier shape on depth of scour. In IOP Conference Series: Materials Science and Engineering. IOP Publishing, 671(1): 012001. https://doi.org/10.1088/1757-899X/671/1/012001
[8] Hassan, W.H., Jalal, H.K. (2021). Prediction of the depth of local scouring at a bridge pier using a gene expression programming method. SN Applied Sciences, 3(2): 159. https://doi.org/10.1007/s42452-020-04124-9
[9] Jalal, H.K., Hassan, W.H. (2020). Three-dimensional numerical simulation of local scour around circular bridge pier using Flow-3D software. In IOP Conference Series: Materials Science and Engineering. IOP Publishing, 745(1): 012150. https://doi.org/10.1088/1757-899X/745/1/012150
[10] Hassan, W.H., Attea, Z.H., Mohammed, S.S. (2020). Optimum layout design of sewer networks by hybrid genetic algorithm. Journal of Applied Water Engineering and Research, 8(2): 108-124. https://doi.org/10.1080/23249676.2020.1761897
[11] Hassan, W.H., Hussein, H.H., Alshammari, M.H., Jalal, H.K., Rasheed, S.E. (2022). Evaluation of gene expression programming and artificial neural networks in PyTorch for the prediction of local scour depth around a bridge pier. Results in Engineering, 13: 100353. https://doi.org/10.1016/j.rineng.2022.100353
[12] Hassan, W.H., Hh, H., Mohammed, S.S., Jalal, H.K., Nile, B.K. (2021). Evaluation of gene expression programming to predict the local scour depth around a bridge pier. Journal of Engineering Science and Technology, 16(2): 1232-1243. https://doi.org/10.1016/j.rineng.2022.100353
[13] Nerland, C. (2010). Offshore wind energy: Balancing risk and reward. In Proceedings of the Canadian Wind Energy Association's 2010 Annual Conference and Exhibition, Canada, p. 2000.
[14] Hassan, W.H., Nile, B.K., Mahdi, K., Wesseling, J., Ritsema, C. (2021). A feasibility assessment of potential artificial recharge for increasing agricultural areas in the kerbala desert in Iraq using numerical groundwater modeling. Water, 13(22): 3167. https://doi.org/10.3390/w13223167
[15] Schendel, A., Welzel, M., Schlurmann, T., Hsu, T.W. (2020). Scour around a monopile induced by directionally spread irregular waves in combination with oblique currents. Coastal Engineering, 161: 103751. https://doi.org/10.1016/j.coastaleng.2020.103751
[16] Yakhot, V., Orszag, S.A. (1986). Renormalization group analysis of turbulence. I. Basic theory. Journal of Scientific Computing, 1(1): 3-51. https://doi.org/10.1007/BF01061452
[17] Mastbergen, D.R., Van Den Berg, J.H. (2003). Breaching in fine sands and the generation of sustained turbidity currents in submarine canyons. Sedimentology, 50(4): 625-637. https://doi.org/10.1046/j.1365-3091.2003.00554.x
[18] Soulsby, R. (1997). Dynamics of marine sands. https://doi.org/10.1680/doms.25844
[19] Van Rijn, L.C. (1984). Sediment transport, part I: Bed load transport. Journal of Hydraulic Engineering, 110(10): 1431-1456. https://doi.org/10.1061/(ASCE)0733-9429(1984)110:10(1431)
[20] Pang, A.L.J., Skote, M., Lim, S.Y., Gullman-Strand, J., Morgan, N. (2016). A numerical approach for determining equilibrium scour depth around a mono-pile due to steady currents. Applied Ocean Research, 57: 114-124. https://doi.org/10.1016/j.apor.2016.02.010