Fadhil A. Jasim*![]() | Nabeel A. Jasim
| Nabeel A. Jasim![]() | Abdullah A. Al-Hussein
| Abdullah A. Al-Hussein![]()
© 2024 The authors. This article is published by IIETA and is licensed under the CC BY 4.0 license (http://creativecommons.org/licenses/by/4.0/).
OPEN ACCESS
This study examines the impact of Soil-Structure Interaction (SSI) on the response of seismic-isolated buildings. Reinforced concrete office buildings with different heights are studied. The High Damping Rubber Bearing (HDRB), Lead Rubber Bearing (LRB) and Double Sliding Pendulum (DSP) isolators are utilized to isolate the buildings base. Also, Tunned Mass Damper (TMD) is implemented at top of buildings to improve building response. Soft, medium and hard soils are modelled using direct and substructure approaches. On the other hand, the influence of foundation type on buildings response is examined. The results indicate that considering SSI in soft soil reduces base shear of 6-storey building by 30%, but increases top storey displacement from 128 mm to 182 mm. It is found that base isolators are more efficient in reducing base shear (41-66%) than TMD (10-25%). Simple equations are suggested to calculate the fundamental period based on building height. The soil layer near the foundation, around 75% of the building height, primarily determines the building's response. Therefore, soil investigation can be restricted to a maximum depth of 75% of the building height. Finally, it is found that using pile foundation in soft soil alters building response to resemble that in hard soil conditions.
base isolation, seismic isolation, soil structure interaction, seismic response, tunned mass damper
The earthquakes occur due to the relative movements of the tectonic plates at their boundaries [1]. During an earthquake, huge amounts of energy are released. The size and severity of an earthquake are estimated by two important parameters: intensity and magnitude [2]. Earthquakes can be devastating to human life and economy as well. It is found that around 10,000 persons die every year due to earthquakes [3]. The earthquakes cannot be expected or avoided. It is essential to develop methods for protecting structures and preserving human life.
A modern method was developed to isolate the structures and their occupancy from earthquake hazard. Flexible materials are used at base of the structures called isolators [4]. Using these isolators increases the period of superstructure and reduces the induced forces and deformation in the structures [5-7].
Many types of isolators are available nowadays such as HDRB, LRB, DSP etc. These isolators showed valuable efficiency in improving the seismic response of structures. On the other hand, a tuned damping can be added to structures using Tuned Mass Damper (TMD).
Many studies on seismic isolated structures often neglect the influence of soil-structure interaction and foundation type. This may lead to inaccurate assessments of base isolation systems, potentially diminishing their efficiency, particularly for structures on deformable soil [8, 9]. Therefore, the SSI should be considered to understand the real behavior of structure [10].
After 1971, SSI was given seriously attention and many research has investigated the importance of SSI for both fixed and isolated base structures [11]. Spyrakos et al. [12] revealed the importance of considering the SSI on the response of base isolated buildings. The study showed that the effect of SSI on system damping is small where the latter is influenced by the isolation system. Al-Jubair and Al-Mosawi [13] showed that considering the supporting soil has a negligible effect on base shear of base isolated structures. Bandyopadhyay et al. [14] studied the effect of SSI on fixed base and base isolated 3-storey reinforced concrete building. A dynamic analysis for fixed base building and building founded on soft soil was conducted by Kabtamu et al. [15]. The study depicted that considering SSI reduces the base shear but the inter storey drift will be increased. The influence of soil condition on multi-storey building with raft foundation was proven by Abdel Raheem et al. [16]. They found an inverse relationship between soil stiffness and the fundamental period of building. Soft soil gave higher storey displacement. Spyrakos et al. [17] showed that considering SSI is significant for light structures founded over low stiffness soil stratum. Bagheri et al. [18] carried out numerical simulation for structure with pile raft foundation to investigate the effect of soil pile interaction. Forcellini [19] showed that beneficial effects of base isolation systems are highly reduced when the structure located over deformable soil and SSI is considered. Edip et al. [20] showed that considering the side boundaries plays an important effect on seismic response of structures. Fatollahpour et al. [21] investigated the influence of considering SSI on 20-storey building response equipped with TMD at top storey. The results revealed that considering SSI can seriously increase the structure response in term of drifts. The use of TMD can improve the structure seismic performance when the soil stiffness value is medium or high [22].
Further investigation is needed to understand the relationship between building seismic response and soil properties when considering soil-structure interaction (SSI) in seismic isolation and Tuned Mass Damper (TMD) efficiency. This study includes key parameters such as isolator type, building height, seismic intensity, and foundation type.
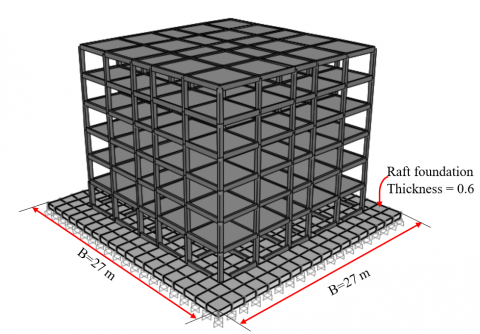
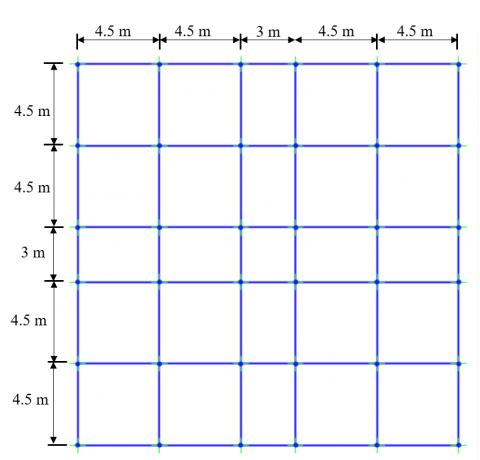
The studied 6-storey symmetric office building with raft foundation is shown in Figure 1 and the plan of the building is shown in Figure 2. The reinforced concrete columns of first storey have length of 4 m and cross-section of 500×300 mm. The columns of storey 2 to 6 are designed with length of 3 m and cross-section of 400×300 mm. The beams have a cross-section of 200×500 mm. The reinforced concrete slab has a thickness of 150 mm. The base of the raft foundation is either fixed without considering the SSI or interfaced with soil when considering the SSI.
Figure 1. 6-storey building with raft foundation
Figure 2. Plan of the building
Three types of soil are considered: soft, medium and hard soil. The properties of these soils are given in Table 1.
Table 1. Properties of soils
|
Property |
Description |
Soft Soil |
Medium Soil |
Hard Soil |
|
E (MPa) |
Modulus of elasticity |
10 |
97 |
420 |
|
ρ (kN/m3) |
Density |
15 |
16 |
18 |
|
$v$ |
Poisson’s ratio |
0.4 |
0.35 |
0.3 |
|
Vs (m/s) |
Shear wave velocity |
50 |
150 |
300 |
|
Vp (m/s) |
Dilatational wave velocity |
121 |
312 |
560 |
|
c (KPa) |
Cohesion |
10 |
40 |
120 |
|
$\phi^o$ |
Angle of internal friction |
15 |
30 |
40 |
|
$\psi^o$ |
Dilation angle |
5 |
10 |
20 |
|
G (MPa) |
Shear modulus |
3.57 |
36 |
162 |
The applied live loads are defined in according to the International Building Code 2021 (IBC 2021) [23]. In addition to the self-weight, other loads are applied as given in Table (2). The outside walls are made from thermalite bricks. All dead load and only 25 percent of the live load are considered in the seismic analysis.
Table 2. The applied loads
|
Load Type |
Value (kN/m2) |
Remark |
|
Dead load |
2 |
For all floors |
|
Live load |
1.5 |
For roof |
|
Live load |
2.5 |
For all offices |
|
Live load |
4 |
For corridors |
|
Live load |
0.72 |
Partition load |
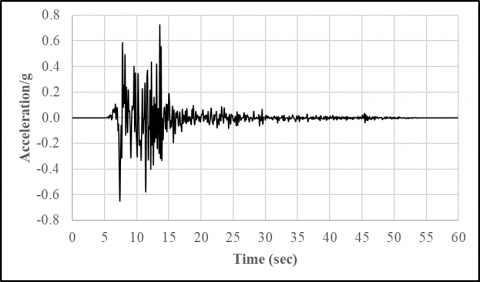
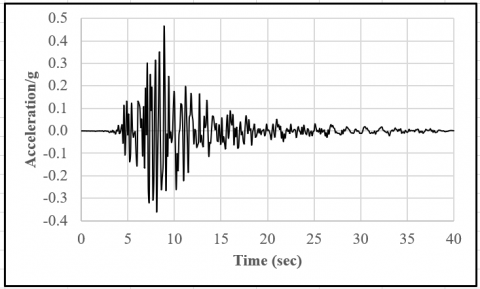
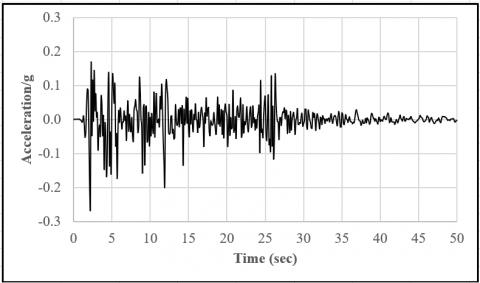
In this study, three earthquakes have been chosen based on their historical significance and their demonstrated impact on structures similar to those under investigation. They are Bam (Iran, 2003), Kobe (Japan, 1995) and El Centro (Los Angeles USA, 1940). The time history data of these earthquakes are given in Figures 3-5, respectively [24, 25]. The station name and the closest distance to rupture plane (Rrup) are written beside the name for referred figures.
Figure 3. Bam-Iran earthquake (Bam, Rrup=1.7 km) [25]
Figure 4. Kobe earthquake (Nishi-Akashi, Rrup=7.08 km) [25]
Figure 5. El Centro earthquake (El Centro Array #9, Rrup=6.09 km) [24]
In this study, three types of passive isolation systems are investigated for their availability and constructability. They are high damping rubber bearing (HDRB), lead rubber bearing (LRB) and double sliding pendulum (DSP) isolators. They are designed to provide adequate vertical load capacity with low horizontal stiffness to isolate the building from the earthquake hazard. The input and output parameters used to isolate 6-storey building are given in Table 3 and defined as follows:
TD: Design period
D: Design displacement
Kv: Vertical stiffness
Keff: Effective horizontal stiffness
Q: Characteristic strength or yield strength
K2: Inelastic stiffness or post yield stiffness
β: Effective damping
K1: Elastic stiffness or initial stiffness
Dy: Yield displacement
R: Radius of curvature of the sliding surface
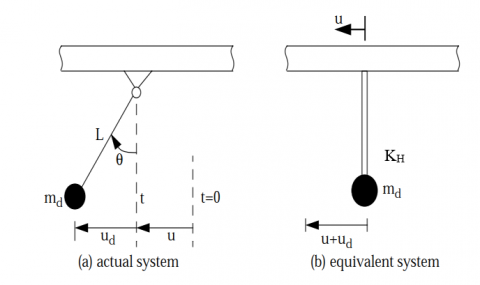
The tuned mass damper (TMD) typically consists of a heavy mass hanged at building’s top in such a way it moves in the opposite direction of building movement. Therefore, the building oscillations will be reduced [26].
The Pendulum TMD system can be modeled by a mass hanged by cables with low horizontal stiffness to thereby the system behaves as a pendulum. Figure 6 shows a simple pendulum fixed to a floor. The properties of the system are defined as: L is the cable or spring length, u is the displacement, KH is the equivalent horizontal stiffness of the cable, md is the mass of damper and Wd is the weight of damper [26].
Table 3. Properties of base isolators (6- storey building)
|
Property |
HDRB |
LRB |
DSP |
|
TD (sec) |
2.5 |
2.5 |
2.5 |
|
D (mm) |
200 |
200 |
200 |
|
Kv (kN/m) |
4,300,000 |
1,970,000 |
1,360,000 |
|
Keff (kN/m) |
1,400 |
1,370 |
1,360 |
|
Q (kN) |
113 |
141 |
47 |
|
K2 (kN/m) |
829 |
663 |
1125 |
|
Dy (mm) |
15.1 |
17.7 |
0.42 |
|
β (%) |
24 |
30 |
23 |
|
r |
0.1 |
0.077 |
0.1 |
|
R (m) |
|
|
2 |
Figure 6. Simple pendulum tuned mass damper [26]
To determine the optimal values for md and L that minimize storey displacement and base shear, the study investigates numerous md values while keeping L constant. Additionally, for a specific value of md, the research explores various L values. With that procedure, the used TMD characteristics are given in Table 4.
Table 4. Properties of the used TMD
|
Property |
Value |
|
Spring length (L) |
1 m |
|
Vertical stiffness (KV) |
490,000 kN/m |
|
Damping constant (C) |
0.07 |
|
Damper weight/total building weight% (Wd/Wt*%) |
1.3 |
|
Horizontal stiffness (KH) |
366 kN/m |
5.1 Direct approach (DA)
Indeed, utilizing a direct method for modeling soil in structural analysis offers increased accuracy and allows for a more detailed representation of soil-structure interaction. In this method, the soil is represented as a continuum along with foundation and structural elements, transmitting boundaries at the limits of the soil mesh, and interface elements at the edges of the foundation in Figure 7 [27].
In general, a limited zone of soil medium is used to model the soil properties. Therefore, an artificial boundary is applied far away from the structure to prevent reflection of waves and get accurate results. For practical reasons and simplifications, fixed boundaries can be used at the bottom of soil zone [20]. At the soil sides, viscous dampers are considered. The viscous element consists of discrete dashpots attached to all degrees of freedom on the boundaries. The dashpots perpendicular to the boundary are specified to absorb dilatational waves, and those tangential to the boundary to absorb shear waves [28].
The coefficients of these dashpots are constant quantities dependent only on the dilatational and shear wave velocities and the density of the soil immediately at the boundaries. The damping constants per unit area are defined as [28, 29]:
$C_N=A \rho V_P$ (1)
$K_N=\frac{A G}{r_b}$ (2)
$C_T=A \rho V_S$ (3)
$K_T=\frac{A G}{2 r_b}$ (4)
where, $C_N$ and $C_T$ are damping constant in normal and tangential directions, respectively. $K_N$ and $K_T$ are normal and tangential stiffness coefficients, respectively. $\rho$ is density of soil. A is the area between the nodes along the side. $r_b$ is the distance from the scattering wave source to the artificial boundary point. $V_P$ and $V_s$ are the dilatational and shear wave velocities of the soil, respectively.
Figure 7. Direct approach of soil-structure interaction [27]
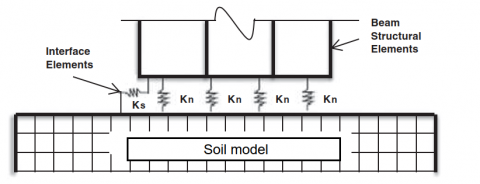
For the interface element between soil and foundation, normal stiffness $\left(k_n\right)$ and shear stiffness $\left(k_s\right)$ values are set to 10 times the equivalent stiffness of the region surrounding the interface where the interaction between soil and structure takes place in Figure 8. For the isotropic soil medium, the interface element stiffness is as follows [30]:
$k_s=k_n=10\left[\frac{\left(K+\frac{4}{3} G\right)}{\Delta_{\text {zmin }}}\right]$ (5)
where, $K$ and $G$ are the bulk and shear modulus of interface zone, respectively, and $\Delta_{z m i n}$ is the smallest width of an adjoining zone in the normal direction.
Figure 8. Soil-foundation interface element [30]
5.2 Substructure approach (SA)
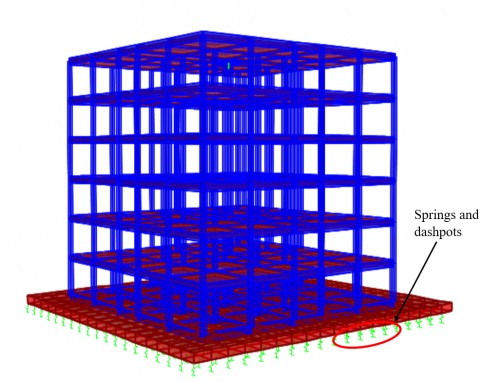
Certainly, utilizing the substructure method in soil modeling can bring about a reduction in computational efforts and enhance flexibility in the modeling process. This method is also called Winkler spring method. An equivalent object with certain properties is used to replace the volume of soil as shown in Figure 9. Generally, springs and dashpots are considered to represent the stiffness and damping at the soil foundation interface [27, 31].
Figure 9. Typical substructure approach model [31]
Gazetas’ equations are used to calculate the equivalent static spring stiffness for soil due to their simplicity, practicality, applicability to various soil conditions and consistency with SSI models. They are given in Table 5 [32].
Table 5. Spring and dashpot coefficients [32]
|
Movement |
Spring Constant |
Dashpot Constant |
|
Vertical |
$\begin{aligned} & K_Z =\frac{2 G L}{1-v}\left(0.73+1.54\left(\frac{A_b}{4 L^2}\right)^{0.75}\right)\end{aligned}$ |
$C_Z=\rho V_{L a} A_b \widetilde{C_Z}$ |
|
Horizontal, lateral |
$K_Y=\frac{2 G L}{2-v}\left(2+2.5\left(\frac{A_b}{4 L^2}\right)^{0.85}\right)$ |
$C_z=\rho V_S A_b \widetilde{C_y}$ |
|
Horizontal, longitudinal |
$\begin{array}{r}K_X=K_Y-\left(\frac{0.2}{0.75-v} G L(1\right.\left.\left.-\frac{B}{L}\right)\right)\end{array}$ |
$C_Z=\rho V_S A_b$ |
where,
B, L: half-width and half-length of the foundation
$G, v$ and $\rho$: the shear modulus, Poisson's ratio and mass density of the soil, respectively
$\mathrm{A}_{\mathrm{b}}$: actual area of bottom surface of foundation
$\widetilde{c_z}$ and $\widetilde{c_y}$: the damping adjustment coefficients of surface foundation
$V_s$: shear wave velocity of the soil
$V_{L a}$: Lymer's analogue wave velocity
SAP2000-V24 is used to model and analyze the studied buildings with and without SSI. Beams and columns are modeled as frame elements while the slabs are modeled using shell elements. Link/support elements are considered to define the non-linear properties of the isolators which are modeled between the ground floor column and foundation. Different mesh sizes are studied and the best one is found to be 0.25 m × 0.25 m for slabs and 0.25 m length for all beams and columns. The mass damper is modeled as linear link with one end fixed at the top storey and the other end free. The mass weight is assigned at the free end.
Figure 10. Soil structure interaction modeling by DA
Figure 11. Soil modeling by SA
The soil medium is assumed homogeneous, isotropic Mohr-Coulomb elasto-plastic half space. It is modeled using solid elements. The modeled soil medium is bounded with viscous dampers boundaries (VD). The viscous dampers consist of discrete dashpots attached to the boundaries. Linear link elements are used to model the interaction between soil and foundation. The boundary condition for the top of soil medium is considered as free while the bottom of soil is fixed. The dimensions of soil body are exanimated using different sizes and the best one is used to be (3 B×3 B×2 H) where B is the raft foundation width (27 m) and H is the building height (18 m). Different mesh sizes for soil are examined to find the soil mesh size that gives accurate results within a suitable running time. The results indicated that using a mesh size of (1.5×1.5×2 m) is the best choice taking into account the computational efficiency. Direct approach (DA) and substructure approach (SA) are used in this study to model the soil structure interaction as shown in Figure 10 and Figure 11.
7.1 Efficiency of soil modeling approaches
To investigate the efficiency of DA and SA of soil modeling, three soils with different elasticity moduli are used. A 6-storey building is subjected to the N-S component of El Centro earthquake. The nonlinear modal time history analysis is performed. The results of DA and SA for soil modeling are given in Table 6. It can be seen, that the difference between the results of DA and SA is not more than 8% for all values of vibration period (T), Top Storey Acceleration (TSA), Top Storey Displacement (TSD) and Base Shear (BS).
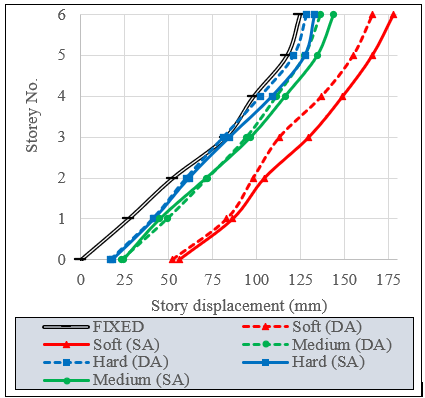
In the three soil types, the TSD obtained from DA is little lower than that found from SA, as shown in Figure 12.
In the same time, the BS found from DA are slightly higher than BS found from SA as illustrated in Figures 13.
Table 6. Results of DA and SA of soil modeling
|
Soil Type |
Parameter |
DA |
SA |
Dif.%* |
|
Soft |
T (sec) |
1.228 |
1.21 |
1.47 |
|
BS (kN) |
8932 |
8467 |
5.2 |
|
|
TSD (mm) |
166 |
177.6 |
-6.99 |
|
|
TSA (m/s2) |
5.57 |
5.32 |
4.49 |
|
|
Medium |
T (sec) |
1.102 |
1.092 |
0.91 |
|
BS (kN) |
11861 |
11521 |
2.87 |
|
|
TSD (mm) |
136 |
143.75 |
-5.70 |
|
|
TSA (m/s2) |
8.81 |
8.69 |
1.36 |
|
|
Hard |
T (sec) |
0.676 |
0.62 |
8.28 |
|
BS (kN) |
12483 |
12312 |
1.37 |
|
|
TSD (mm) |
128.2 |
133.1 |
-3.82 |
|
|
TSA (m/s2) |
8.87 |
8.77 |
1.13 |
*Dif.%=(DA-SA)×100/DA
Figure 12. Storey displacement for DA and SA of soil modeling
Figure 13. BS for DA and SA modeling of soils
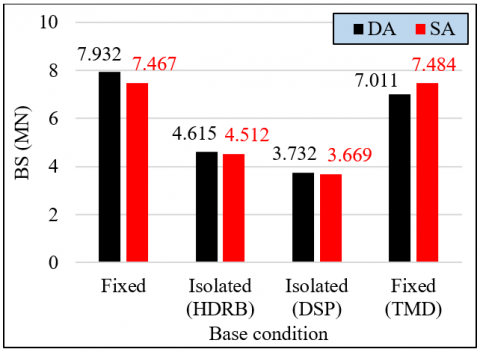
Also, it is revealed that using base isolators gives almost same values for BS for both soil modeling approaches as illustrated in Figure 14.
Figure 14. BS for DA and SA for different base conditions with soft soil
These findings indicate that SA can be used with high efficiency for modeling soils in seismic response problems due to its very short running time (52 min) as compared with the DA which takes more than 10 hours. But SA depends mainly on the input data of soil stiffness where it should be calculated with high care to get accurate results.
7.2 SSI and seismic response
To understand the effect of SSI on the seismic response of a 6-storey building, three soils with different elasticity moduli are used. They are soft, medium and hard soils. The building is subjected to the N-S component of El Centro earthquake. The Direct Approach (DA) of soil modeling is adopted and the nonlinear modal time history analysis is performed.
7.2.1 Fundamental period (T)
It is found that the soft soil gives a higher fundamental period as compared with the hard soil. The fundamental period T = 0.676 sec for hard soil and T= 1.228 sec for soft soil. The fundamental period T=0.637 sec in case of using fixed supports without considering the SSI. Thus, the soft soil increased T by 93% as compared to fixed supports without considering the soil. T for the case of hard soil is very close to that value obtained in case of using fixed supports at base without considering SSI.
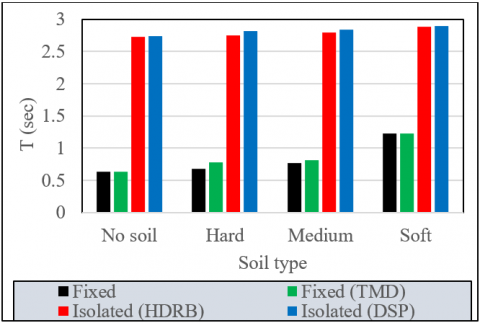
For base isolated building, it is observed that using base isolators increases the fundamental period (T) and the soft soil gives a little higher value of T as compared with the hard soils. All the isolation systems increase T by the same percentage. Also, using TMD has a negligible effect on the fundamental period of the building for all the soil types in Figure 15.
Figure 15. Fundamental period (T) and soil types
7.2.2 Base shear (BS)
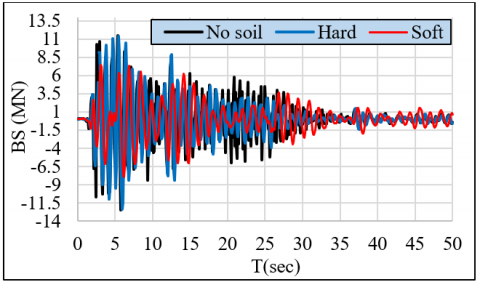
It is detected that soft soil gives lower base shear while hard soil gives higher base shear and with value very close to the base shear obtained for the case of fixed supports without considering SSI as given in Figure 16 and Figure 17.
The results depict that using base isolator are still efficient in reducing the base shear but with low reduction percentage in case of soft soil. It is noticed that using HDRB and LRB isolators leads to a reduction in BS of about 60% in case of hard soil while 42% in case of soft soil. On the other hand, using DSP isolator leads to a reduction in BS of about 65% in case of hard soil while 53% in case of soft soil. TMD shows little benefits in reducing base shear as compared with base isolators. This may be related to the fundamental mechanism of base isolators and TMD where base isolators work by decoupling the building from the ground while TMD mechanism is activated in response to the seismic excitation.
Figure 16. Base shear and soil elasticity relationship (∞ refers to fixed base without considering soil)
Figure 17. Base shear-Time relationship
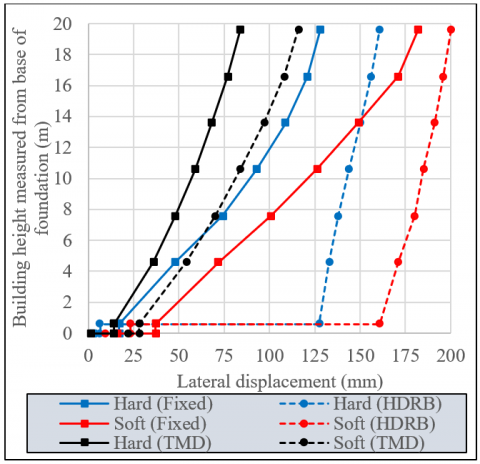
7.2.3 Lateral displacement
It is found that the soft soil leads to increase the lateral displacement for both fixed and isolated bases buildings and also in the case of using fixed base with TMD at top storey, Figure 18.
On the other hand, using base isolators is efficient in reducing the storeys drifts although the top story displacement may be increased, that increase comes from the horizontal displacement at the isolator level. Also, it is found that TMD has the ability to reduce the top story displacement and storey drift of the building stories as well. But it should be noted that the storeys drifts in case of using base isolators are less than the obtained values from using TMD.
7.3 Effect of earthquake
To investigate the relationship between earthquake intensity and soil type, the same 6-storey building with the same defined soft and hard soils are modeled. The building is subjected to Bam, Kobe and El Centro earthquakes. The direct approach of soil modeling is used and nonlinear modal time history analysis is performed. Six models are studies: no soil with fixed base (fixed connection between ground floor columns and foundation) (N-F), no soil with isolated base using HDRB (N-I), hard soil with fixed base (H-F), hard soil with isolated base using HDRB (H-I), soft soil with fixed base (S-F) and soft soil with isolated base using HDRB (S-I).
Figure 18. Lateral displacement of building
It is found that base shear values for case of N-F are higher than the ones obtained from cases with SSI for all the studied earthquakes. Also, it is found that the base shear value is higher in case of hard soil than soft soil. The reduction in base shear (as a percentage of BS values obtained in case of N-F) in case of using soft soil was (El Centro: 28%, Kobe: 18.6% and Bam:17.3%). The base shear values in case of using hard soil are close to the results of N-F case.
For isolated base case, there is a small effect for SSI on the obtained base shear values for all the studied earthquakes. The base isolation technique is efficient for all types of soil. The base shear reduction due to using base isolators in case of hard soil is in the range of 63% to 73% while in case of soft soil it is 55% to 72% in Figure 19.
Figure 19. Base shear for different earthquakes and soils
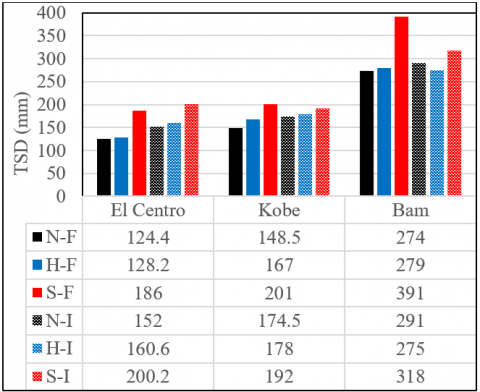
It is detected that considering SSI affects the lateral displacement of the building for all the studied earthquakes. The top storey displacement (TSD) is higher in case of soft soil compared with hard soil. Also, the case of hard soil gives TSD very close to the values obtained in case of neglecting the SSI and using fixed supports in Figure 20.
Figure 20. Top storey displacement for different earthquakes and soils
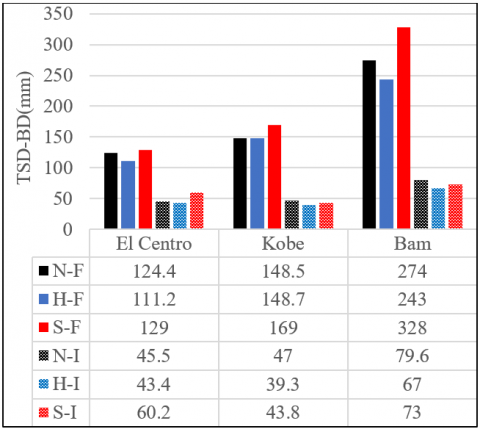
Also, it is noticed that there is a limited effect for SSI on TSD in case of isolated ground floor columns by using HDRB. The high TSD in case of base isolated building is mainly related to the lateral displacement at isolator level. Therefore, the total storey drift, which is found by subtracting the base displacement (BD) from TSD will be highly reduced in case of base isolated building as compared with fixed base in Figure 21.
Figure 21. Total storey drift (TSD-BD) for different earthquakes and soils
7.4 Effect of building height
To understand the relationship between building height and its seismic response considering SSI, six buildings are modeled with 3, 4, 6, 8, 10 and 12 storeys with fixed and isolated base using HDRB isolators. Soft and hard soils are studied. N-S component of El Centro earthquake is applied.
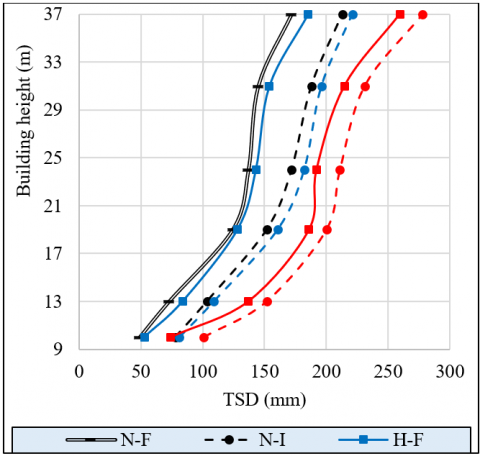
The influence of building height on vibration period (T) can be seen in Figure 22. It is observed that T is directly increased with building height. Also, hard soil gives values for T very close to those values found in the case of fixed supports. Soft soil gives higher value for T for all studied building heights. Using HDRB isolators increases the T for all studied building heights. Also, there is only minor effect for soil properties on value of T of base isolated buildings.
The following equations are suggested to calculate the fundamental period (T) in seconds based on building height (H less than 37 m) in meters:
For fixed building base without considering SSI and with considering SSI for hard soil:
$T=H / 24$ (6)
For fixed building base with considering SSI for soft soil:
$T=H / 16$ (7)
For cases of isolated building base with and without considering SSI and for both hard and soft soils:
$T=\left(T_D-0.5\right)+0.04 H$ (8)
The obtained results from using the above equations are very close to FE results in Figure 21. Alo, these results are compared with previous research results of T which show a good agreement as given in Tables 7-9.
Figure 22. Fundamental period and building height relationship for soft and hard soils
The hard soil gives base shear values close to those values found from the model of fixed supports without considering SSI. For soft soil, usually the base shear value is less than base shear value when soil is hard. In some cases, soft soil gives BS values higher than BS values obtained from hard soil or using fixed supports instead of soil. That behavior is compatible with the response spectrum of the building. Also, it is found that base isolated buildings with soft soil may be subjected to lower base shear as compared with base isolated building overlying on hard soil in Figure 23.
Table 7. Fundamental period for fixed base building
|
H (m) |
T (sec) |
|||
|
FE |
Eq. (6) |
Previous Studies [Ref.] |
||
|
10 |
0.458 |
0.417 |
0.42 [33] |
0.46 [34] |
|
13 |
0.587 |
0.542 |
0.56 [35] |
|
|
15 |
|
0.625 |
0.672 [36] |
0.73 [37] |
|
18 |
|
0.750 |
0.65 [34] |
0.79 [38] |
|
19 |
0.737 |
0.792 |
|
|
|
20 |
|
0.833 |
0.82 [39] |
|
|
24 |
1.102 |
1.000 |
0.945 [35] |
|
|
30 |
|
1.250 |
1.2 [38] |
|
|
31 |
1.215 |
1.292 |
1.36 [40] |
1.37 [35] |
|
36 |
|
1.500 |
1.4 [41] |
1.49 [40] |
|
37 |
1.506 |
1.542 |
1.727 [42] |
1.517 [35] |
|
40 |
|
1.667 |
1.768 [15] |
|
Table 8. Fundamental period for fixed base buildings with soft soil
|
H (m) |
T (sec) |
||||
|
FE |
Eq. (7) |
Previous Studies [Ref.] |
|||
|
10 |
0.704 |
0.625 |
0.66 [33] |
0.74 [34] |
|
|
13 |
0.814 |
0.812 |
|
|
|
|
15 |
|
0.937 |
0.86 [37] |
0.808 [36] |
0.94 [35] |
|
19 |
1.228 |
1.187 |
|
|
|
|
20 |
|
1.25 |
1.182 [43] |
|
|
|
21 |
|
1.312 |
1.2 [8] |
|
|
|
24 |
1.521 |
1.5 |
1.47 [35] |
|
|
|
31 |
1.777 |
1.937 |
1.88 [40] |
1.79 [35] |
1.96[33] |
|
33 |
|
2.062 |
1.93 [44] |
|
|
|
36 |
|
2.25 |
2.32 [16] |
2.2 [35] |
2.18 [42] |
|
37 |
2.167 |
2.312 |
2.404 [42] |
|
|
|
40 |
|
2.5 |
2.32 [15] |
|
|
Table 9. Fundamental period for isolated base buildings
|
H (m) |
TD (sec) |
T (sec) |
|||
|
FE |
Eq. (8) |
Previous Studies [Ref.] |
|||
|
9 |
2.5 |
|
2.321 |
2.5 [8] |
2.6 [34] |
|
10 |
2.5 |
2.341 |
2.357 |
2.21 [33] |
|
|
13 |
2.5 |
2.55 |
2.464 |
2.6 [45] |
|
|
15 |
2.5 |
|
2.535 |
3.849 [36] |
2.387 [46] |
|
19 |
2.5 |
2.88 |
2.678 |
2.9 [34] |
|
|
20 |
2.5 |
|
2.714 |
2.513 [38] |
|
|
24 |
2.5 |
2.991 |
2.857 |
2.88 [34] |
2.78 [37] |
|
30 |
2.5 |
|
3.071 |
2.87 [38] |
|
|
31 |
3 |
3.211 |
3.607 |
2.98 [40] |
|
|
35 |
3 |
|
3.75 |
3.7 [43] |
|
|
36 |
1.6 |
|
2.385 |
2.56 [42] |
|
|
37 |
3 |
3.389 |
3.821 |
3.467 [34] |
|
|
37 |
2 |
|
2.821 |
2.95 [45] |
|
|
40 |
3 |
|
3.928 |
3.7 [39] |
|
On the other hand, it is found that soft soil leads to an increase in the top storey displacement (TSD) as compared with hard soil and fixed support cases. Also, using HDRB isolators gives higher TSD for both cases of soft and hard soils as presented in Figure 24.
Figure 23. Base shear and building height relationship for soft and hard soils
Figure 24. TSD and building height relationship for soft and hard soils
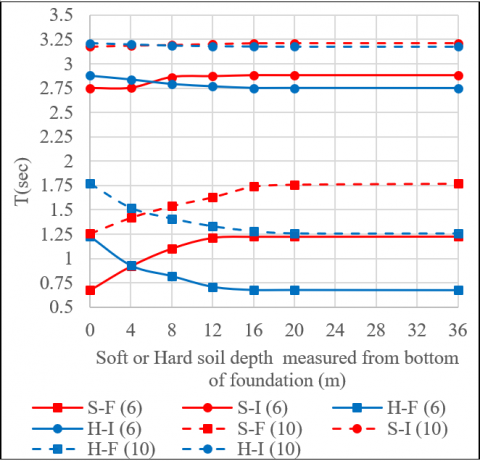
7.5 Foundation overlying layered soil
Generally, the soil under foundation consists of more than one layer with different properties. To investigate the effect of layer thickness on building response under earthquakes, 6 and 10-storey buildings are studied. The buildings are subjected to the N-S component of El Centro earthquake. The total soil thickness is considered to be 36 m. The soft soil depth under foundation is studied first. In this case, the soil is modeled to be 4 m soft soil and the rest is hard soil. Then the soft soil thickness increased by rate of 4 m up to 20 m soft soil and the rest is hard soil. The hard soil is studied in the same manner.
Figure 25. Fundamental period (T) in case of layered soils
Figure 26. Base shear (BS) in case of layered soils
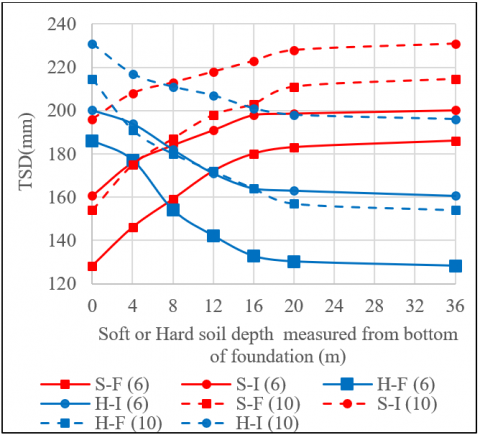
The results are illustrated in Figures 25-27. The legend of the figures is defined as soil type, base condition and number of storeys. Where letter H stands for hard soil, letter S stands for soft soil, letter F refers to fixed base and letter I refers to isolated base. It is noticed that the values of vibration period (T), base shear (BS) and top storey displacement (TSD) are sensitive to the top soil properties (soil close to the bottom of foundation). After the 16 m depth under foundation, changing soil properties has a negligible effect on the 6-storey building response. Also, the response of 10-storey building is not affected by changing soil properties after 20 m depth under foundation. It can be concluded that top soil controls the building response. The effective soil depth that controls the building response can be considered as 75% of building height. Limiting the soil investigation for seismic design in a seismic zone to a depth not exceeding 75% of the building height is a practical approach. This restriction can effectively reduce both the time and cost associated with soil investigations, offering a balance between obtaining essential geotechnical information and optimizing resource utilization in the design process.
Figure 27. Top storey displacement (TSD) in case of layered soils
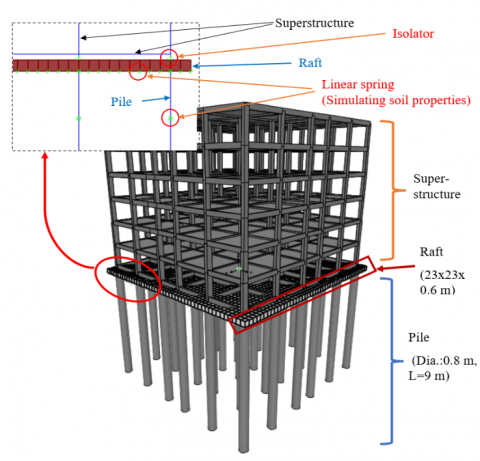
7.6 Effect of foundation type
Figure 28. Modeling of piled-raft foundation
In this section, the effect of foundation type on response of 6-storey building under N-S component of El Centro earthquake is examined. The studied cases include fixed supported base without considering foundation, raft foundation (Figure 1), piled-raft foundation (Figure 28) and pile foundation (Figure 29). Soft soil is modeled using substructure approach (SA) to simplify the modeling and analysis. The raft foundation is modeled as shell elements of size 0.5*0.5m. The piles are designed as friction piles. They are modeled as frame elements of length 0.5 m. SAP2000 deals with soil as a linear link with stiffnesses calculated by the program itself based on soil subgrade modulus (Ks) as shown in Figure 30. The Link/support elements are used to model the isolators which are used between the ground floor column and foundations. The results of analysis are shown in Table 10.
Figure 29. Modeling of pile foundation
Figure 30. Example of modeling pile foundation in SAP2000
Table 10. Effect of foundation type on building response subjected to El Centro earthquake
|
Foundation Type |
GF Condition |
T (sec) |
BS (kN) |
TSA (m/s2) |
TSD (mm) |
ID(1) (mm) |
|
Fixed support (No soil) |
Fixed |
0.737 |
12513 |
8.92 |
124.4 |
0 |
|
Isolated (HDRB) |
2.324 |
4920 |
3.72 |
162 |
126.5 |
|
|
Isolated (DSP) |
2.344 |
4325 |
3.11 |
188.1 |
158.6 |
|
|
Raft |
Fixed |
1.21 |
8467 |
5.32 |
177.6 |
0 |
|
Isolated (HDRB) |
2.79 |
4513 |
3.63 |
197 |
142 |
|
|
Isolated (DSP) |
2.91 |
3632 |
3.04 |
201 |
153 |
|
|
Piled-raft |
Fixed |
0.987 |
11312 |
5.76 |
146.7 |
0 |
|
Isolated (HDRB) |
2.71 |
4660 |
3.71 |
176.6 |
136 |
|
|
Isolated (DSP) |
2.84 |
4217 |
3.09 |
191 |
149.8 |
|
|
Pile |
Fixed |
1.08 |
10879 |
5.63 |
158 |
0 |
|
Isolated (HDRB) |
2.73 |
4596 |
3.67 |
197 |
142 |
|
|
Isolated (DSP) |
2.87 |
3875 |
3.07 |
199 |
147 |
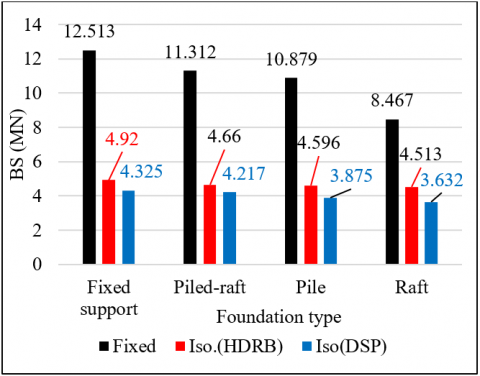
Figure 31. Base shear and type of foundation relationship
ID: Displacement at isolator level
The fundamental period (T) of fixed base building is higher in case of raft foundation than other types of foundations. Piled-raft and pile foundations give almost the same value for T. Considering fixed supports instead of modeling the soil and foundation gives the lowest value of T. For HDRB and DSP isolated building, the studied foundations have a small effect on value of T.
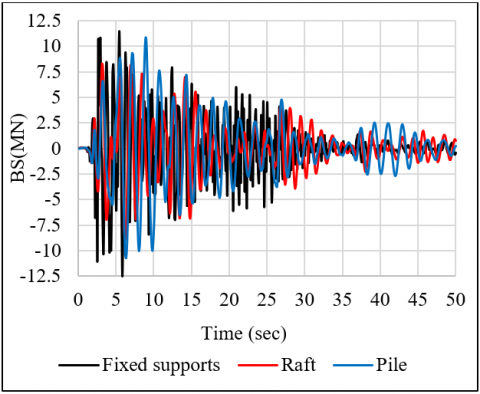
Figure 32. Time history of BS for different foundations
The base shear values for raft, pile and piled-raft foundations are found to be 8467 kN, 10978 kN and 11312 kN, respectively compared with 12513 kN for BS found in case of fixed supports. It is clearly seen that the lower base shear is obtained in case of raft foundation while the higher base shear is found in case of pile-raft foundation in Figure 31 and Figure 32. On the other hand, there is a small effect for foundation type on BS values of base isolated building using HDRB and DSP.
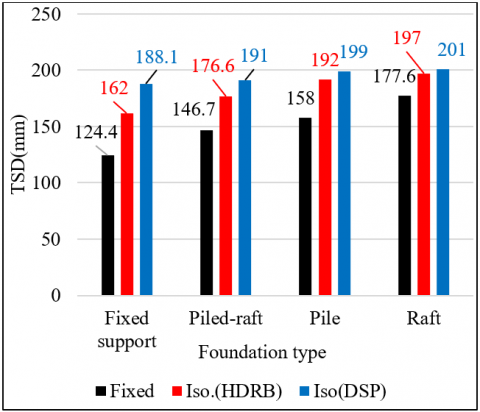
For the top storey displacement (TSD), it is revealed that using raft foundation leads to an increase in the TSD from 124.4 mm (found in case of fixed supports) to 177.6 mm while TSD increased to 146.7 mm in case of piled-raft foundation as shown in Figure 33. The results of using HDRB and DSP base isolation are slightly affected by foundation type. The total building drift for building with raft foundation is 36 mm while it is found to be 54 mm in case of pile foundation, as depicted in Figures 34.
The conclusion drawn is that all the foundations studied are suitable for the design of base-isolated buildings, and their use does not negatively impact on the seismic isolation efficiency.
Figure 33. Top storey displacement and foundation type relationship
Figure 34. Lateral displacement for different foundations
8.1 Conclusions
The following conclusions can be drawn from this study:
8.2 Limitations
This research encountered several notable limitations, including:
This work is supported by University of Basrah, College of Engineering, Civil Engineering Department in Basrah-Iraq.
|
HDRB |
high damping rubber bearing |
|
LRB |
lead rubber bearing |
|
DSP |
double sliding pendulum |
|
TMD |
tunned mass damper |
|
DA |
direct approach |
|
SA |
substructure approach |
|
BA |
base shear, MN |
|
TSD |
top storey displacement, mm |
|
TSA |
top storey acceleration, m/s2 |
|
T |
fundamental period, sec |
|
Rrup |
closest distance to rupture plane, km |
|
TD |
design period, sec |
|
D |
design displacement, mm |
|
Kv |
vertical stiffness, kN/m |
|
Keff |
effective horizontal stiffness, kN/m |
|
Q |
characteristic strength or yield strength, kN |
|
K2 |
inelastic stiffness or post yield stiffness, kN/m |
|
β |
effective damping, % |
|
K1 |
elastic stiffness or initial stiffness, kN/m |
|
Dy |
yield displacement, mm |
|
R |
radius of curvature of the sliding surface, m |
|
L |
cable or spring length, m |
|
u |
displacement, mm |
|
KH |
equivalent horizontal stiffness of the cable |
|
md |
mass of damper |
|
Wd |
weight of damper |
|
E |
modulus of elasticity, MPa |
|
C |
dimensionless damping constant |
|
$C_N$ |
damping constant in normal direction |
|
$C_T$ |
dimensionless damping constant in tangential direction |
|
$K_N$ |
normal stiffness, kN/m |
|
$K_T$ |
tangential stiffness, kN/m |
|
Vs |
shear wave velocity, m/s |
|
Vp |
dilatational wave velocity, m/s |
|
$V_{L a}$ |
Lymer’s analogue wave velocity, m/s |
|
G |
shear modulus, MPa |
|
c |
cohesion, KPa |
|
Greek symbols |
|
|
ρ |
density, kN/m3 |
|
ν |
Poisson’s ratio |
|
$\phi^\sigma$ |
angle of internal friction |
|
$\psi^o$ |
dilation angle |
[1] Chen, W.F., Lui, E.M. (2006). Earthquake Engineering for Structural Design. Taylor & Francis Group. https://doi.org/10.1201/9781420037142
[2] Duggal, K.S. (2013). Earthquake-Resistant Design of Structures. Oxford University Press.
[3] Estrada, H., Lee, L.S. (2017). Introduction to Earthquake Engineering. CRC Press, Taylor & Francis Group. https://doi.org/10.1201/b22173
[4] Cheng, F.Y., Lou, K.Y., Jiang, H.P. (2008). Smart Structures: Innovative Systems for Seismic Response Control. Taylor and Francis Group. https://doi.org/10.1201/9781420008173
[5] Chopra, A.K. (1980). Dynamic of Structures a Primer. University of California, Berkeley, The Earthquake Engineering Research Institute.
[6] Mcvitty, W.J., Michael, C.C. (2015). Property modification factors for seismic isolators: Design guidance for buildings. Technical report, University of Buffalo, State University of New York.
[7] Ismail, M. (2018). Seismic isolation of structures. Part I: Concept, review and a recent development. Hormigón y Acero, 69(285): 147-161. https://doi.org/10.1016/j.hya.2017.10.002
[8] Forcellini, D. (2022). The role of soil structure interaction on the seismic resilience of isolated structures. Applied Sciences, 12(19): 9626. https://doi.org/10.3390/app12199626
[9] Zhuang, H.Y., Yu, X., Zhu, C., Jin, D.D. (2014). Shaking table tests for the seismic response of a base-isolated structure with the SSI effect. Soil Dynamics and Earthquake Engineering, 67: 208-218. https://doi.org/10.1016/j.soildyn.2014.09.013
[10] Institution of Structural Engineers. (1989). Soil-structure-interaction: The real behavior of structures. https://civiltechnocrats.files.wordpress.com/2013/11/45874815-soil-structure-interaction-the-real-behaviour-of-structure.pdf.
[11] Aden, M.A., Al-Attar, A.A., Hejazi, F., Dalili, M., Ostovar, N. (2023). Effects of soil-structure interaction on base-isolated structures. Sustainable Civil and Construction Engineering, 357: 1-15. https://doi.org/10.1088/1755-1315/357/1/012031
[12] Spyrakos, C.C., Koutromanos, I.A., Maniatakis, C.A. (2009). Seismic response of base-isolated buildings including soil–structure interaction. Soil Dynamics and Earthquake Engineering, 29(4): 658-668. https://doi.org/10.1016/j.soildyn.2008.07.002
[13] Al-Jubair, H.S., Al-Mosawi, F.H. (2017). The effect of supporting soil on seismically isolated buildings of variable geometric configurations with and without shear walls. International Journal of Engineering Research & Technology, 6(3): 155-160.
[14] Bandyopadhyay, S., Parulekar, Y.M., Sengupta, A., Chattopadhyay, J. (2011). Structure soil structure interaction of conventional and base-isolated building subjected to real earthquake. Structures, 32: 474-493. https://doi.org/10.1016/j.istruc.2021.03.069
[15] Kabtamu, H.G., Peng, G., Chen, D.H. (2018). Dynamic analysis of soil structure interaction effect on multi story RC frame. Open Journal of Civil Engineering, 8: 426-446. https://doi.org/10.4236/ojce.2018.84030
[16] Abdel Raheem, S.E., Ahmed, M.M., Alazrak, T.A. (2015). Evaluation of soil–foundation–structure interaction effects on seismic response demands of multi-story MRF buildings on raft foundations. International Journal of Advanced Structural Engineering, 7: 11-30. https://doi.org/10.1007/s40091-014-0078-x
[17] Spyrakos, C.C., Maniatakis, C.A., Koutromanos, I.A. (2009). Soil-structure interaction effects on base-isolated buildings founded on soil stratum. Engineering Structures, 31: 729-737. https://doi.org/10.1016/j.engstruct.2008.10.012
[18] Bagheri, M., Jamkhaneh, M.E., Samali, B. (2018). Effect of seismic soil-pile-structure interaction on mid-and high-rise steel buildings resting on a group of pile foundations. International Journal of Geomechanics, 18(9): 1-27. https://doi.org/10.1061/(ASCE)GM.1943-5622.0001222
[19] Forcellini, D. (2022). The assessment of the interaction between base isolation (BI) technique and soil structure interaction (SSI) effects with 3D numerical simulations. Structures, 45: 1452-1460. https://doi.org/10.1016/j.istruc.2022.09.080
[20] Edip, K., Garevski, M., Sheshov, V., Bojadjieva, J. (2017). Boundary effects in simulation of soil-structure interaction problems. Soil Mechanics and Foundation Engineering, 54: 239-244. https://doi.org/10.1007/s11204-017-9464-2
[21] Fatollahpour, A., Tafakori, E., Arjmandi, A.A. (2023). The effects of structure-soil-structure interaction on seismic response of high-rise buildings equipped with optimized tuned mass damper. Structures, 50: 998-1010. https://doi.org/10.1016/j.istruc.2023.01.132
[22] Gorini, D.N., Chisari, C. (2009). Impact of soil-structure interaction on the effectiveness of Tuned Mass Dampers. Earthquake Engineering & Structural Dynamics, 51(6): 1501-1521. https://doi.org/10.1002/eqe.3625
[23] International Building Code. (2020). IBU-2021. International Code Council ING. 2020.
[24] Pacific Earthquake Engineering Research (PEER) Center. PEER Ground Motion Database, University of California.
[25] U.S. Geological Survey (U.S.G.S). U.S. Department of the Interior: https://www.usgs.gov.
[26] Connor, J.J. (2007). Structural Motion Engineering. Prentice Springer, Cham. https://doi.org/10.1007/978-3-319-06281-5_1
[27] Hayes, J.R., Harris, J.R. (2012). Soil-Structure Interaction for Building Structures. NEHRP Consultants Joint Venture.
[28] Al-Wakel, S.F.A. (2012). Numerical simulation of the infinite medium of dry soil in dynamic soil-structure interaction problems. Engineering and Technology Journal, 31(8): 1447-1458. https://doi.org/10.30684/etj.31.8a2
[29] Kontoe, S., Zdravkovic L., Potts D.M. (2009). An assessment of the domain reduction method as an advanced boundary condition and some pitfalls in the use of conventional absorbing boundaries. International Journal for Numerical and Analytical Methods in Geomechanics, 33(3): 309-330. https://doi.org/10.1002/nag.713
[30] Tabatabaiefar, H.R., Fatahi, B., Samali B. (2014). An empirical relationship to determine lateral seismic response of mid-rise building frames under influence of soil–structure interaction. The Structural Design of Tall and Special Buildings, 23(7): 526-548. https://doi.org/10.1002/tal.1058
[31] Abu-Aladas, F.S. (2016). Simplified conceptual equation for soil-structure interaction for simple structures due to vertical loads for practical purposes. MSc. Thesis, An-Najah National University.
[32] Gazetas, G. (1990). Formulas and charts for impedances of surface and embedded foundations. Journal of Geotechnical Engineering, 117(9): 1363-1381. https://doi.org/10.1061/(asce)0733-9410(1991)117:9(1363)
[33] Yanik, A., Ulus Y. (2023). Soil-structure interaction consideration for base isolated structures under earthquake excitation. Buildings, 13(4): 915. https://doi.org/10.3390/buildings13040915
[34] Alavi, E., Alidoost M. (2012). Soil-Structure Interaction Effects on Seismic Behavior of Base-Isolated Buildings. 15 WCEE Lisbona, pp. 1-11.
[35] Zafarkhah, E., Dehkordi, M.R. (2017). Evaluation and numerical simulation of soil type effects on seismic soil-structure interaction response of RC structures. International LTD. Journal of Vibration Engineering, 19(7): 5208-5230. https://doi.org/10.21595/jve.2017.18286
[36] Canini, A., Forcellini, D. (2018). 3D numerical simulation of a base isolated residential building with soil structure interaction. Computational Methods in Structural Dynamics and Earthquake Engineering, 12: 1155-1167. https://doi.org/10.7712/120117.5482.16931.
[37] Magade, S.B., Patankar, J.P. (2008). Effect of soil structure interaction on the dynamic behavior of buildings. Journal of Mechanical and Civil Engineering, 9-14.
[38] Patel, N., Adhikari, S. (2020). Seismic response of RC frame building considering soil structure interaction. International Journal of Scientific Research in Engineering and Management 7(10): 1-8. https://doi.org/10.55041/ijsrem26199
[39] Joseph, C., George N. (2015). Effect of soil structure interaction on frames with different base conditions. International Journal of Engineering Research & Technology, 3(29): 1-4. https://doi.org/10.17577/IJERTCONV3IS29018
[40] Hatami, F., Nademi, H., Rahaie M. (2015). Effects of soil-structure interaction on the seismic response of base isolated in high-rise buildings. International Journal of Structural and Civil Engineering Research, 4(3): 237-242. https://doi.org/10.18178/ijscer.4.3.237-242
[41] Lavanya, N., Vijaya G.S. (2018). Soil structure interaction effects on structure response with isolated footing. International Journal of Civil and Structural Engineering Research, 6(1): 173-186.
[42] Awchat, G.D., Monde A.S. (2021). Influence of soil-structure interaction on the seismic response of the structure on mat foundation. Civil Engineering Journal, 7(10): 1679-1692. https://doi.org/10.28991/cej-2021-03091752
[43] Tavakoli, R., Kamgar, R., Rahgozar, R. (2020). Optimal location of energy dissipation outrigger in high-rise building considering nonlinear soil-structure interaction effects. Periodica Polytechnica Civil Engineering, 64(3): 887-903. https://doi.org/10.3311/ppci.14673
[44] Khot, S., Waghmare, M.V. (2023). Seismic analysis of rc structure by considering soil structure interaction (SSI). International Research Journal of Engineering and Technology, 10(7): 313-317.
[45] Soyoz, S. (2004). Effect of soil structure interaction and base isolation systems on seismic performance of foundation soils. Ph.D. thesis, Middle East Technical University.
[46] Applied Technology Council. (2020). A Practical Guide to Soil-Structure Interaction. FEMA. https://www.fema.gov/sites/default/files/documents/fema-p-2091-soil-structure-interaction.pdf.