Hayder Ali*![]() | Sepanta Naimi
| Sepanta Naimi![]() | Ahmed Al-Janabi
| Ahmed Al-Janabi![]()
© 2024 The authors. This article is published by IIETA and is licensed under the CC BY 4.0 license (http://creativecommons.org/licenses/by/4.0/).
OPEN ACCESS
This study systematically examines the behavior of cantilever and anchorage sheet piles influenced by a range of variables, namely dredge level, water table level, anchor inter-anchor distance, anchors’ number, and the distance from the ground surface. Utilizing a single sheet pile material, the investigation highlights the deformations resulting from these variables, in addition to assessing the effects of different soil types and degrees of saturation. The primary objective centers on the computation of bending moments arising from these factor variations under a constant load, using the finite element theory-based software, Plaxis 2D Connect Edition V20. Sheet pile behavior could be evaluated using this tool by investigating driven depth, maximum bending moments, and horizontal displacements in both anchorage and cantilever sheet piles. To enhance the reliability and realism of findings, outcomes are compared with results from the Pro Sheet program. This comprehensive evaluation furnishes valuable insights into sheet pile deformations under diverse conditions, contributing to the existing body of knowledge and facilitating more robust engineering practices.
deformations, sheet piles, Plaxis 2D, variables
The majority of engineering problems involve figuring out the potential stress and deformation behaviour of the groundmass under applied loads. Realistic results cannot be obtained due to the nonlinear behaviour of the ground stress/deformation relationship [1-4]. Consequently, the sheet pile design and the estimation of the stress and deformation behaviour are challenging and intricate, much like any other soil-structure interaction problem. It was examined using sheet piles to limit earthquake-induced ground settling [5]. Other research examined the movement of active piles subjected to horizontal loads on the earth [6].
Except for the studies mentioned above, it has been observed in previous research papers that only the effects of sheet piles on seepage are empirically investigated. The effects of sheet piles on soil-bearing capacity are not experimentally investigated. Model tests are used in this study to investigate the behavior of sheet piles under soil and foundation loads.
This study aims to investigate two major sheet piles categories, namely anchorage sheet piles and cantilevers, in the context of sandy soil. The research will explore scenarios both without a water table and with varying depths of the water table.
Sheet piles consist of solid walls composed of steel, vinyl, wood, and reinforced concrete. To support a soil mass, they are made up of several separate parts that pierce the ground. Sheet piles are vital in construction as they divert subsurface water and rainwater away from foundation excavations. Additionally, it is used in the construction of structures such as retaining walls and wave breakers to improve building stability and reduce the possibility of groundwater intrusion into the structure [7].
The response of sheet pile walls embedded in sandy soil under foundation loading was investigated using a model-based approach in this study. To evaluate deformation in both the foundation and sheet pile elements, the analysis combined sheet pile depth adjustment with hydraulic principles. Notably, the study concentrated on assessing deformation at the central point of the sheet pile wall and both foundation extremities. A data logger recorded the collected test data in a systematic manner for subsequent analysis and interpretation [8-10].
3.1 Utilizing the finite element technique for modelling
The response of sheet piles was investigated using the finite element method (FEM).
FEM was used to analyze complex system interactions using Plaxis 2D Connect Edition V20 software, a geotechnical engineering standard. This implies numerical methods employed in similar geotechnical studies are followed. The application of this method includes evaluating the horizontal displacements, driven depth, and the maximum bending moments of two different sheet pile types: anchorage sheet pile and cantilever. The purpose of this research is to explain the behavior demonstrated by sheet piles [11-12].
The Plaxis 2D Connect Edition V20 software provides two methods for determining the dimensions in order to create an accurate case model. Mastering the skills of drawing the model and accurately entering parameters is essential for optimum utilization of Plaxis 2D.
3.1.1 Axisymmetry
It is possible to create models of circles with particular diameters by using axisymmetry. Considering equal strains in both directions (εx = εz), Figure 1 illustrates how the software takes into account the direction out of the plane (z) although the researcher works within the y-and x-axes designated cross-section [13].
Figure 1. Model measurements using the axisymmetry method and the Plaxis program [14]
3.1.2 The strain of the plane
When a segment is regular outside of the plane under study, plane strain is employed. Plane strain was taken into consideration in this paper since this option is frequently utilized to model longer roadways or excavations that are wider than they are long, as shown in Figure 2.
3.1.3 Modelling numerical data with Plaxis 2D finite element
This software analyses and studies how rocks and soils deform under the impact of various soil structures and loads. It operates in a Windows environment and uses the finite element approach. There are four primary programs in the Plaxis 2D suite [12, 15].
3.1.4 Input step
The pre-treatment stage of work in this program is where the primary data needed to define the problem being studied are entered. The engineering model’s dimensions and shape must be determined, along with various material properties involved in the model. An efficient loading system must also be defined, and the boundary and initial conditions for the issue under study—groundwater included—must be established.
3.1.5 Steps of calculation
Program for calculations and processing This program’s unique selling point is its ability to mimic the various project construction stages precisely, which makes it easier to determine the stresses and distortions associated with each stage independently.
3.1.6 Output step
It is a post-processing step that displays the computed findings and the stresses that are affecting the model of the finite element network under study in all of its manifestations. The application also offers the option to show the outcomes in tables.
3.1.7 Curves program
The software was utilized to show the trajectories of deformations and stresses at particular engineering model sites, as well as connection profiles among deformations vs. loads and relative stresses vs. distortions. The distribution of groundwater pressures can also be displayed.
Figure 2. Model dimensions using the plane strain method and the Plaxis program [14]
3.2 Sheet pile numeric modeling
3.2.1 Materials parameters and model
The retaining structures’ geotechnical behaviors were investigated utilizing anchored sheet pile numerical modeling for walls and cantilever at distinct height dredges (H). 15 node elements were employed in the plane strain model. The program produced an excellent mesh. The Mohr-Coulomb model is deemed appropriate for simulating the nonlinear behaviour of soil in general, as it is simple and can be used in the case of lateral pressures operating on sheet piles or earth pressure on sheet piles under static load in this inquiry [16].
This research utilizes varying water table levels to address the cases of dry soil, saturated soil, and partially saturated soil.
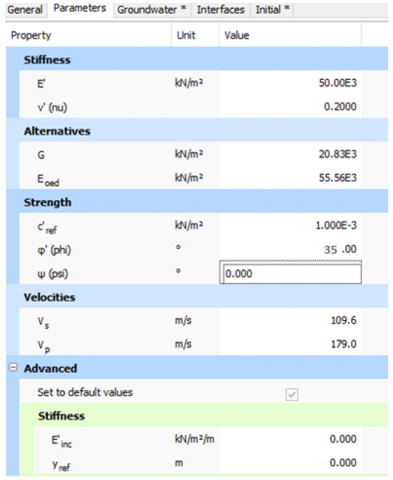
The parametric study used sand soil, and these properties of soil were characterized by Tables 1-4.
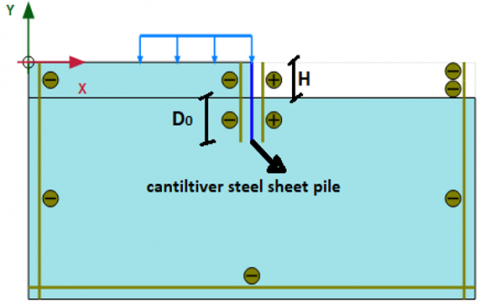
Figures 3 and 4 depict the properties of the sheet pile wall, such as the cantilever sheet pile penetration depth (Do), the dredge height, the interval between the ground surface distance to first anchor (y), the first and second anchors (S), and the anchored sheet pile penetration depth (D1).
Table 1. Sand soil properties [17]
|
Parameter |
Symbol |
Value |
Unit |
|
Friction angle |
$\varphi$ |
35.3 |
° |
|
Strength reduction factor inter |
$R_{\text {inter }}$ |
0.67 |
- |
|
Type of behaviour |
drained |
- |
- |
|
Unit weight of soil dry |
$\gamma_{d r y}$ |
16.8 |
kN ̸m3 |
|
Cohesion |
C |
0.001 |
kN ̸m3 |
|
Unit weight of saturated soil |
$\gamma_{\text {sat }}$ |
20.5 |
kN ̸m3 |
|
Poisson’s ratio |
$\upsilon$ |
0.3 |
- |
|
Unit weight of unsaturated soil |
$\gamma_b$ |
18 |
kN ̸m3 |
|
Young’s modulus |
E |
30000 |
kN ̸m3 |
|
Permeability |
(Kx, Ky) |
0.2 |
m ̸day |
|
Dilalatancy angle |
$\Psi$ |
0 |
° |
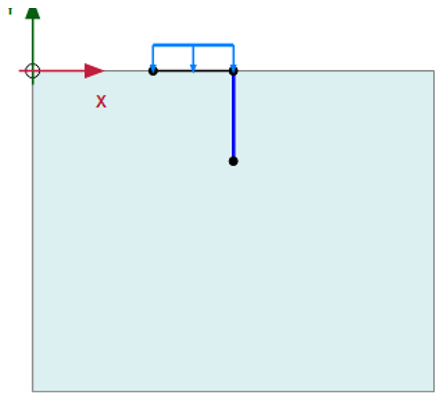
Figure 3. The cantiliver sheet pile’s 2D Plaxis model’s geometry
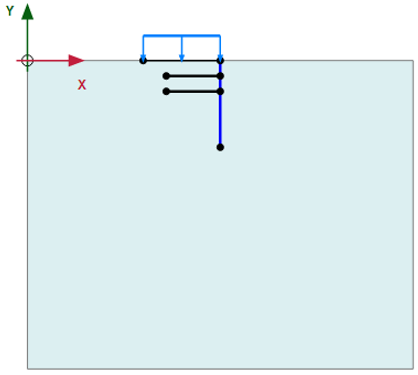
Figure 4. The shapes of the two-anchored sheet pile in the 2D Plaxis model
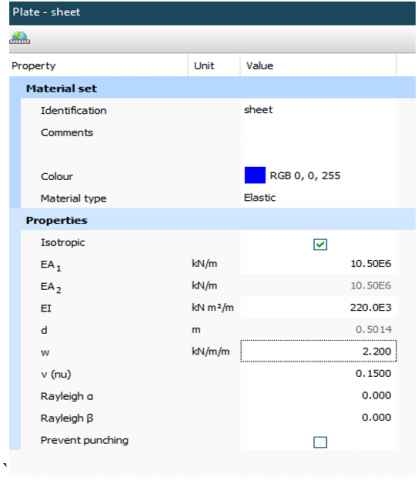
Figure 5 displays the structural characteristics selected for the AZ46-700N steel section of the sheet pile.
Figure 5. AZ46-700N sheet pile section [18]
Table 2. Sheet pile characteristics [19]
|
Symbols |
Value |
Units |
|
$\upsilon$ |
0.15 |
- |
|
EA |
10.5E6 |
kN.m-1 |
|
EI |
0.22 E6 |
kN.m-2.m-1 |
|
d |
0.501 |
m |
|
W |
2.2 |
KN.m-1 |
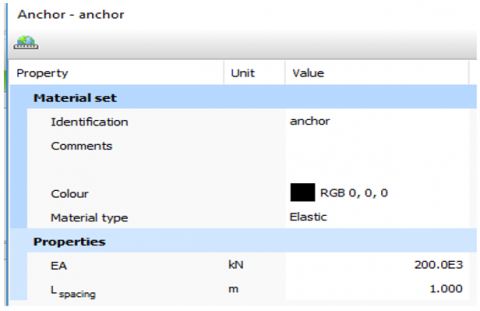
Table 3. Anchors characteristics [17]
|
Parameter |
Name |
Value |
Unit |
|
L spacing |
|
1 |
m |
|
Type of behaviour |
Material type |
Elastic |
- |
|
Normal stiffness |
EA |
2E5 |
kN ̸ m |
Table 4. Grout body characteristics [17]
|
Parameter |
Name |
Value |
Unit |
|
L spacing |
|
1 |
meter |
|
Type of behavior |
Materials type |
Elastics |
- |
|
Normal stiffness |
EA |
1.E5 |
kN ̸ m |
3.2.2 Plaxis 2D software example
The modeling technique is explained through the examination of an anchorage sheet pile under the action of a load that is uniformly distributed. The distributed load is determined at 10 KN/m2, assuming an excavation depth of 5.25 m below the dredge line and 6 m above the dredge line. Sand soil is the soil beneath the sheet pile, which is fortified against soil thrust with anchoring elements and grout material. Full explanations of the material characteristics are given in the following paragraphs as the modeling procedure is elaborated upon.
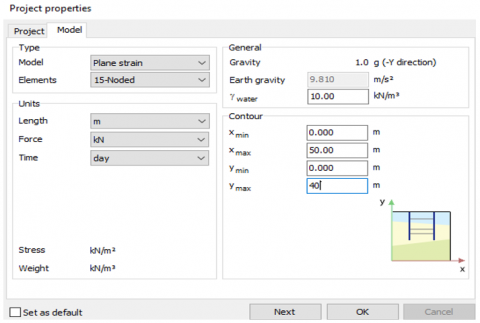
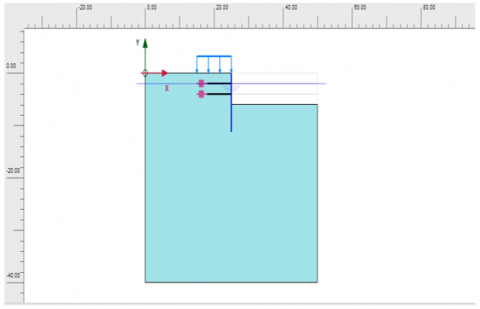
1-Firstly, a model was constructed employing a plain strain model. To ensure optimal accuracy, 15 nodes were strategically chosen, and Xmax = 50m, Xmin = 0, Ymax = 40, and Ymin = 0 model dimensions were specified, as illustrated in Figure 6.
Figure 6. Dimension of model
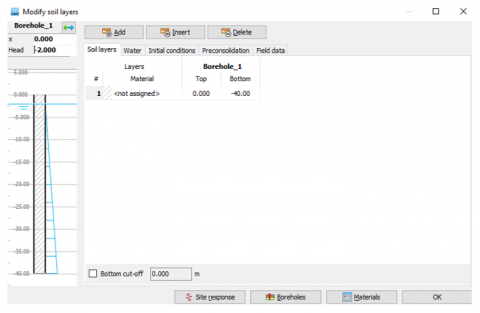
2-Once the model dimensions were established, a borehole was created with a 40 m depth, and a 2m distance water table was positioned from the sheet pile stack highest point, as depicted in Figure 7.
3-Three distinct kinds of soil were modeled, and their respective impacts on the sheet pile were examined by assessing the soils’ characteristics in behind and front the pile. Figures 8 to 10 illustrate the assigned characteristics of sandy soil (bulk and saturated unit weight).
Figure 7. Borehole dept
Figure 8. General properties of soil
Figure 9. Parameters properties of soil
Applying interfaces along the sheet pile and selecting appropriate values for Rint could be utilized to look into the interaction between the sheet pile and the soil, as demonstrated in Figure 11.
4-Steel sheet piles were modeled by accessing the “Structure” window after the soil characteristics had been finalized. The sheet pile was positioned in centre and designated as a plates utilizing the command “Create plates.” Figures 12 and 13 display pertinent information via the “Structure-Show Materials-Plate” command.
Figure 10. Ground water properties
Figure 11. Characteristics of interface
5-During this stage, soil surfaces behind and above the plate receive loadings that are evenly distributed. The load was defined as 10 kN/m2, and its location was generated utilizing the “Create line load” command, as demonstrated in Figure 14.
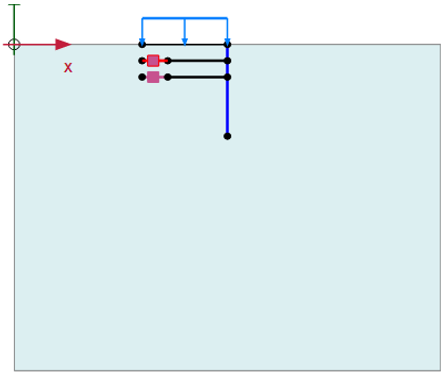
6-Anchorage and cantilever sheet piles were two forms of sheet piles taken into account. Employing the “Create node to node anchor” command, the illustration displays two anchor elements at heights of 2 and 4 m from the top of the plate, respectively. Figure 15 displays the proper dimensions for the element’s position and its initial length of 6 meters. The element’s length was changed as the research progressed.
Figure 12. Teel plate
Figure 13. Steel sheet pile properties
Figure 14. Soils’ load
Figure 15. Anchor on plate
7-The following figure shows the characteristics of this element with L spacing=1 m. These components are inspected on a metric slide, and the following command is employed to model their characteristics: Figure 16 shows “Structure-ShowMaterials-Anchor.”
Figure 16. Characteristics of anchors
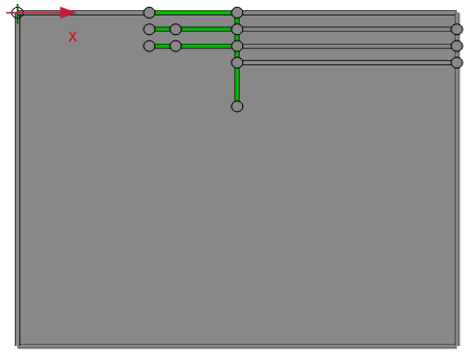
8-These anchored and reinforced elements by grout— injected cement substance into the soil at the anchoring element end—are modeled utilizing the command “Create embedded beam row,” with a length of two meters behind the element, as demonstrated in Figure 17.
Figure 17. Anchor and grout on plate
Figure 18. Grout properties
9-The characteristics of the material were modeled utilizing “Structure-ShowMaterials-Embedded BeamRow,” as demonstrated in Figure 18, with a material diameter of 0.3 meters.
10-The element will be divided into smaller, more sophisticated elements once it reaches the Mesh window. There were three options (Very Fine, Fine, and Medium) for dividing the triangular mesh within this window. A fine division was utilized to guarantee more consistent outcomes, as demonstrated in Figure 19.
Figure 19. Generating mesh
11-At three different drilling depths (2 m, 4 m, and 6 m), three separation lines were marked with the symbols “H, 0.66H, and lastly 0.33H,” in which H stands for “Sheet Pile Free Height.” Water table variations persisted for the duration of the investigation. As demonstrated by Figure 20, our illustration shows the delineation of water tables at 2 meters depth. The levels of water table contact the sheet pile throughout excavations.
Figure 20. Water table modelling
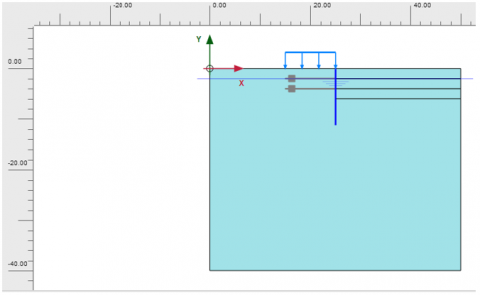
Figure 21. Surcharge loadings and activated plate in Phase 1
12-Several phases were identified in the last step, which comes before the analysis, to symbolize the model’s construction phases. The software operates in the first stage, which indicates soil modeling only, as Figure 21 demonstrates. Phase 1 of the additional phases entailed simultaneously activating the plate and surcharge loading.
13-As demonstrated in Figure 22, the initial 2 m-deep excavation was rendered inactive throughout Phase 2.
Figure 22. First excavation deactivating
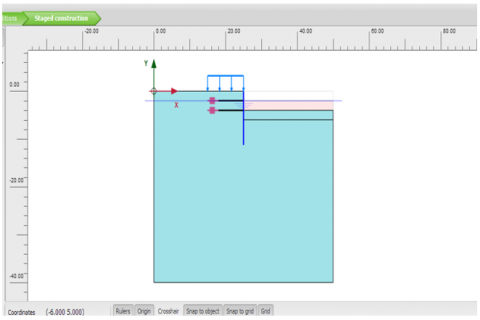
14-In order to active the grout and anchors impact, Phase 3 enabled the embedded beam and row node-to-node anchor choices, as demonstrated in Figure 23.
Figure 23. Grout body and activating anchors (Phase 3)
15-In phase 4, an excavation depth of 4 meters was reached through the creation of a previous cut into the soil 2 meters in front of the plate, as demonstrated in Figure 24.
Figure 24. Characteristics of Phase 4
16-An additional 2 meters of excavation was performed in front of the plate throughout the last phase, phase 5, bringing the total excavation depth to 6 meters. As demonstrated by Figure 25, these levels indicates the soil excavation total depth in the plate direction.
Figure 25. Characteristics of Phase 5
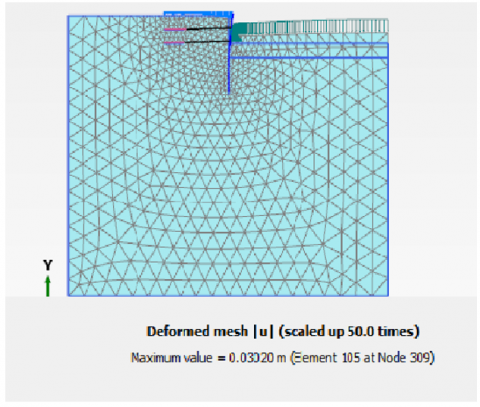
17-After all phases have been identified, the “Calculate” command started the analysis. When the fininshing analysis, the “View Calculation Results” command was used to review the findings. With the help of these findings, the distorted form was observed utilizing the “Deformation-Deformed Mesh” command, as demonstrated in Figure 26.
Figure 26. Deformed shape
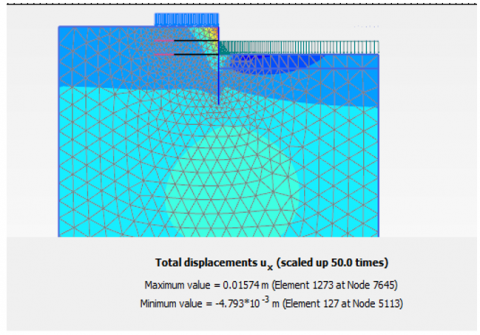
Figure 27. Total displacement-Ux
18-Furthermore, the horizontal displacement readings were detected through the utilization of the “Deformation-Total displacement-Ux” command, as illustrated in Figure 27.
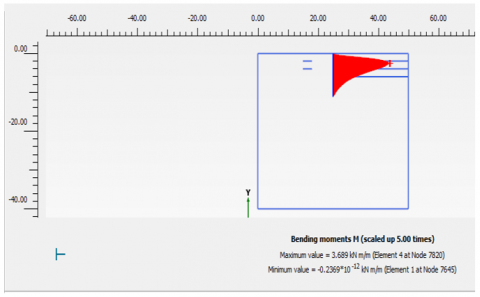
19-Additionally, the applied bending moment in plates were computed. The bending moment’s highest possible value was recognized, and this diagram was drawn, as Figure 28 demonstrates.
Figure 28. Bending moment
3.2.3 Prosheet of the design software
In order ensure the preciseness of the outcomes calculated by the Plaxis software, a comparison is conducted with the output generated by the August 2017 Ver. of the ProShee 22 design software.
Prosheet is a comprehensive sheet pile design software for cantilever and single supported retaining walls (one anchor or strut). It is based on the Blum theory, a limit equilibrium method (LEM).
It is a quite simple tool to determine all the forces required for designing a sheet pile retaining wall, and ideal for preliminary designs. The soil pressure and soil resistance factors are determined according to the theory of Caquot / Kérisel, which yields similar results to the Coulomb theory, except for granular soils with very high internal friction angles [9].
3.2.4 calculate steps in prosheet programe
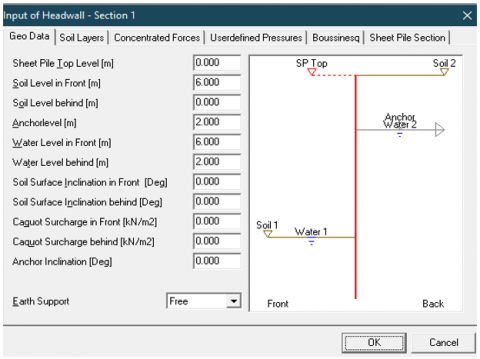
1-The Geo window was provided with all the subsequent points of data..
Figure 29. Prosheet program showing the geotechnical date
Important inputs for this window include values like the levels of water both behind of and ahead the sheet piles and soil, the anchoring element levels, and the sheet pile levels. Furthermore, the window offers options regarding the sheet pile condition. For tied sheet piles, it enables choosing among fixed or free, and for cantilevered sheet piles, it enables selection of the cantilever choice, as demonstrated in Figure 29.
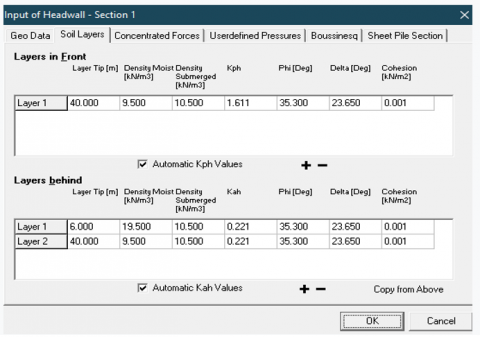
2-As depicted in Figure 30, we proceed to the soil layers window and insert the attributes for every soil layer situated both ahead and behind of the sheet piles.
Figure 30. Prosheet program soil layers
3-Following this, the surcharge loading values (distance and width from sheet piles) and surcharge loading (surcharge loading) are inserted into the subsequent window, as illustrated in Figure 31.
Figure 31. Surcharge loading
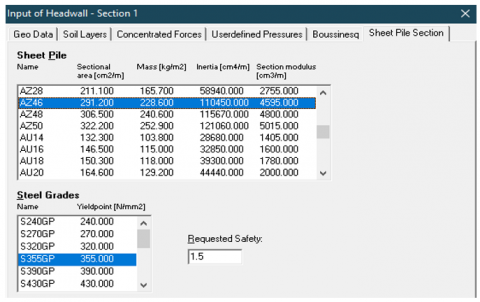
Figure 32. Section of sheet pile
4-Figure 32 demonstrates the final step, which involves filling out the sections of sheet pile and selecting the AZ46700 N pile in S355GP steel grading.
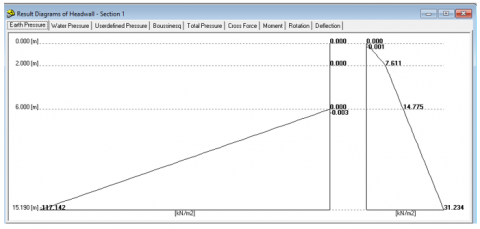
5-Upon inputting all needed information into the input window, Prosheet creates output in the form of diagrams depicting driven depth, horizontal pressure, static water pressure, moment, and horizontal deflection, that are illustrated in Figures 33 and 34.
Figure 33. Diagram of the pressure of earth
Figure 34. Diagram of deflection
Every scenario was analyzed in both programs utilizing a single anchor, though, as the Prosheet program fails to examine the effects of multiple anchors.
3.2.5 Parametric investigation
Two primary types of sheet piles (anchorage sheet piles and cantilever) were evaluated in this investigation for 3 varing soil kinds in the lack of and presence of varying depths of water tables.
3.3 Properties of the test apparatus
Table 5. Soil and sheet characteristics
|
Sandy Soil |
Sheet, h=6m |
Sheet, h=5m |
Sheet, h=3m |
|
C=0.001 KN/m2 |
d: 0.503m |
d: 0.503m |
d: 0.501m |
|
γdry=16.8 KN/m3 |
EI: 2.133E6 KN/m2 |
EI:2.133×10⁶ KNm-2 |
EI: 0.22E6 KN/m2 |
|
$\upsilon$=0.3 |
|
|
|
|
$R_{\text {inter }}$=0.67 |
|
|
|
|
E=30000 KN/m2 |
$\upsilon$: 0.15 |
$\upsilon$: 0.15 |
$\upsilon$: 0.15 |
|
Φ=35.3 |
EA: 1.008E9 KN/m |
EA: 1.008×10⁹ KNm-1 |
EA: 10.5E6 KN/m |
Table 5 demonstrates that two different types of cantilever and anchorage sheet piles were applied to sandy soil at varying dredge depths (0.3–0.67h) besides a 10 kN/m2 surcharge loading. The surcharge loadings were presumed to be constant in all situations. Table 5 indicates that the sheet pile’s parameters ranged from a dredge level of h = 3 m to h = 5–6 m. This modification was needed due to instability that was observed while utilizing AZ46-700 N for h = 5 m. This meant that a sheet pile section with greater stability had to be utilized for dredge levels starting at 5 m.
Using the Plaxis 2D program, a dredge depths range of sandy soil constrained through cantilevers sheets were analyzed. For every situation, the maximum moment values, horizontal displacements, and economic penetration depths were determined. The outputs of the Pro Sheet program’s analysis of sheet piles were then verified with these outcomes. Figure 35 summarizes the results that have been provided.
Figure 35. Cantilever sheet pile Economical depth
Figure 36. Chart of sheet pile horizontal displacement at varying levels of dredge
Figure 37. Chart of sheet pile Moment diagram at varying levels of dredge
Driven depths rise alongside the dredge level rise, as the curve above demonstrates, and there is a significant alignment in results between the two programs. Moments along the sheet pile and horizontal displacements data was gathered through Plaxis 2D software and graphically depicted in an Excel graph, as demonstrated in Figures 36 and 37.
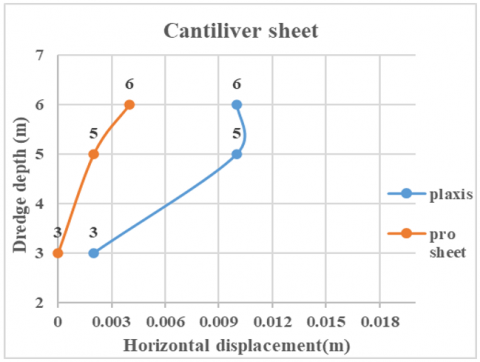
Figures 36 and 37 demonstrate the cantilever sheet piles displacements and maximum moments. Figures 38 and 39 illustrate correlations of these values alongside the equivalent ProSheet program maximum values.
Figure 38. Deformation of cantilever sheet
The displacement values reflect a rising pattern as the dredge depth develops. The Plaxis program generates higher displacement estimates than the ProSheet program.
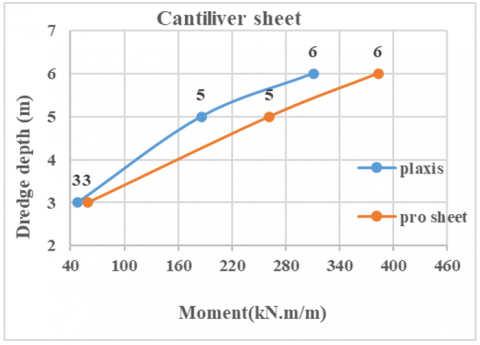
Figure 39. Cantilever sheet pile moment analysis at varying dredge depths
Table 6. Anchor characteristics
|
Aanchor h3m |
Anchor h5m |
Anchor h6m |
|
L:1.5m EA:50×103 KN.m-1 |
L:3m EA:2×10⁵ KN.m-1 |
L:4m EA:200×103 KN.m-1 |
Table 7. Properties of grout
|
Grout h:3m |
Grout h:5m |
Grout h:6m |
|
L:1m D:0.05m |
L:2m D:0.3m |
L:3m D:0.3m |
Consistent trends were also observed in the maximum moment rates displayed in Figure 39, which shows that a rise in dredge depth corresponds with a rise in maximum moment rates. It was clear that the moment values of the two examined programs were convergent. For anchorage sheet piles, parallel research was conducted, as can be seen in Tables 6 and 7. The objective of this analysis was to better understand the impact of incorporating an anchor element in conjunction with grouting on variables like driven depth, displacement, and maximal moment readings among various dredge depth.
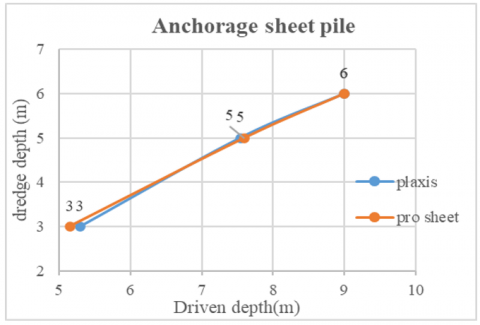
The driven depths, horizontal displacements, and moments—calculated using the Plaxis 2D program—were contrasted with those measured through Pro Sheet software. The patterns correlating to anchor sheet piles were displayed in Figure 40.
Figure 40. Anchored sheet-driven depth
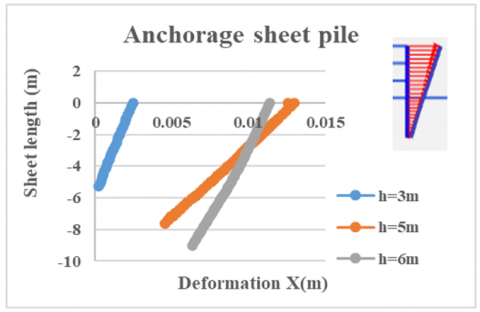
Figure 41. Anchoraged sheet deformation diagram
It is apparent from comparing Figures 35 and 41 that the driven depth in the cantilever sheet pile case is greater than that of the anchorage sheet pile case. The measurements of moments and displacements alongside the sheet piles anchorage were calculated through Plaxis 2D in a manner akin to that utilized for the cantilever sheet pile. As demonstrated in Figure 41, these results were displayed as moments and horizontal displacements alongside sheet pile anchorage utilizing an Excel spreadsheet.
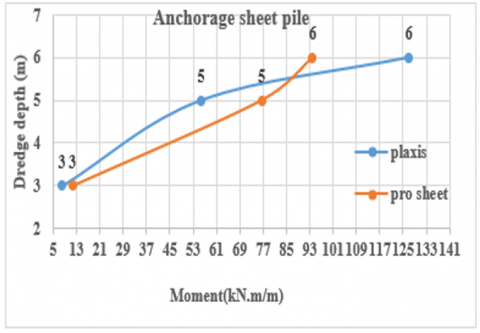
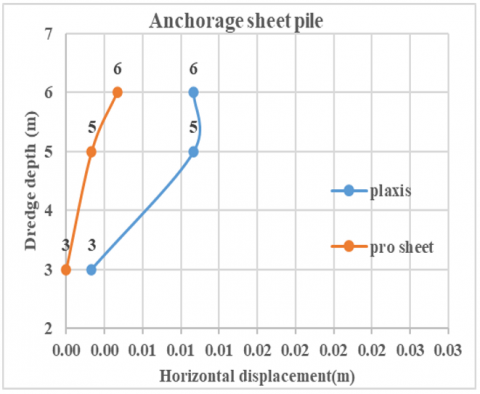
The sheet piles anchorage displacements indicated in Figures 41 and 42, respectively. Figures 43 and 44 demonstrate the maximum values generated from the ProSheet program juxtaposed with the maximum moments displayed in Figure 42.
Figure 42. Moment diagram of anchorage sheet
Figure 43. Anchored sheet deformation
Figure 44. Anchored sheet’s moment
Additionally, when compared to cantilever sheet piles, anchorage sheet piles had reduced horizontal displacement rates. The Plaxis 2D program has generated higher displacement readings than by the ProSheet program.
Furthermore, compared to the cantilever plates, the maximum moment levels in the anchorage sheet were decreased.
3.4 Water table effects
The same soil conditions have evaluated in this case for both anchorage sheet piles and cantilever sheet piles, considering into account varying depths of dredge and the water table existence at several distinct depths. ProSheet program outputs were juxtaposed with the findings of the computational analysis, which was carried out in Plaxis 2. First, an examination had been carried out on the sheet pile cantilever at three various elevations of water tables (hw = 5, 3.5, and 1.5 meters above surface). Table 8 summarizes the characteristics of the sheet pile and soil utilized for the study.
Table 8. Features of the sheet pile and soil at water table levels
|
Sandy Soil |
Sheets |
|
γsat=20.5KN/m3 |
$\upsilon$=0.15 |
|
γb=19.5 KN/m3 |
EI=5.75E6KN/m2 |
|
E=30000 |
|
|
$\upsilon$=0.3 |
|
|
$\Phi$=35.3 |
EA=12E6KN/m |
|
Rinter=0.67 |
|
|
C=0.001 KN/m2 |
w=20 KN/m |
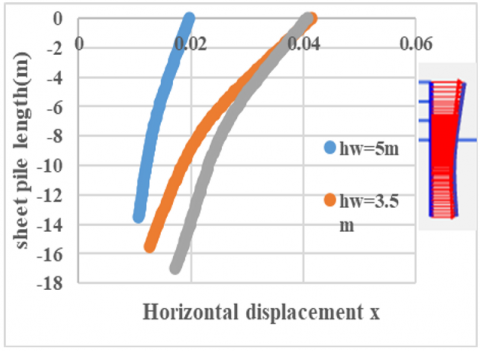
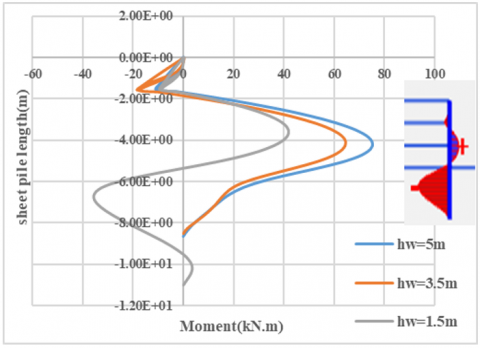
Figure 45. Deformation curves illustrating the cantilever sheets response on the water table influence
Figures 45 and 46 demonstrate an Excel chart that was utilized to illustrate the moments and horizontal displacement alongside the sheet pile cantilever during water tables situations. These data were obtained from the Plaxis 2D program.
By applying a uniformly distributed load (5 KN/m2) to the sheet pile, penetration depths, and horizontal displacements under the influence from various water table levels are contrasted
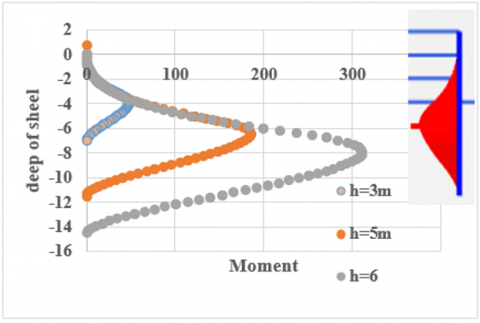
Figure 46. Moment curves illustrating the cantilever sheets response on the water table influence.
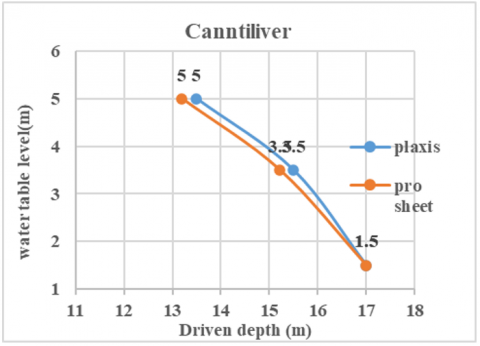
Figure 47. Cantilever sheet pile’s penetration depth under the impact of a variety of water table levels
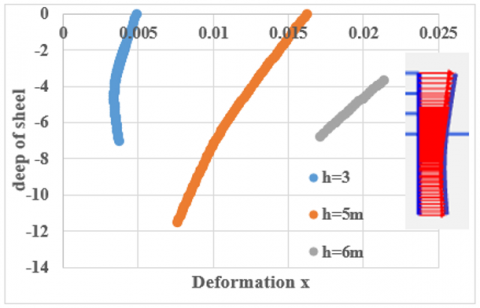
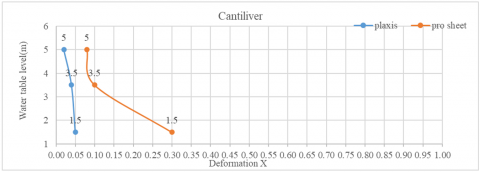
Figure 48. Cantilever sheet deformation X via varying water tables
As the water table elevation grows, each curve in Figures 46 and 47 reflects an evident rise in displacements and driven depth, which is apparent in Figure 48. The analysis of the anchorage sheet pile additionally included the application of grout and anchor elements. The best cost estimates for the grout and anchor were determined for a range of water table elevations and a uniform distributed loading of 5 kN/m2 placed on the top of the sheet pile. Table 9 provides particular information about the grout, sheet pile, and anchor.
Table 9. Features of the grout, sheet pile, and anchor where a water table is present
|
Anchored Sheet Pile |
Grout Characteristics |
Anchor Characteristics |
|
EI:5.75E6 KN/m2 |
L:4m |
L:8m |
|
EA:12E6 KN/m |
D:0.4m |
EA:3E5 KN/m |
|
$\upsilon$:0.15 |
|
|
|
W:20 KN.m |
|
|
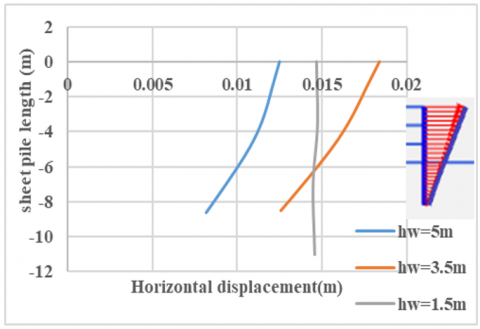
An Excel chart was employed to display the moments and horizontal displacement across the sheet pile anchorage, as supplied Plaxis 2D. Figures 49 and 50 demonstrate the charts illustrating moments and horizontal displacements alongside the sheet pile cantilever in situations where there is a water table.
Figure 49. Deformation X curves of a sheet pile with anchor in the presence of water table
Figure 50. Sheet pile moment curves with anchor in water table levels
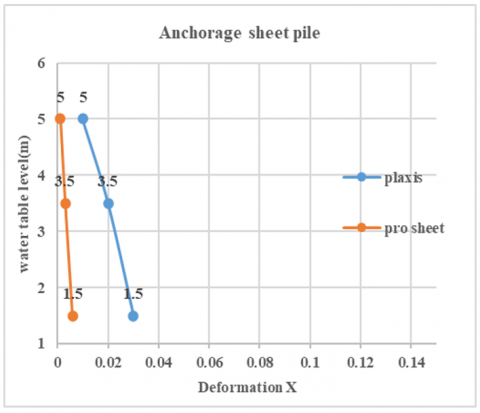
The investigation on sheet pile anchorage concentrated on horizontal displacements and driven depth. As demonstrated in Figures 51 and 52, a comparison analysis of the outcomes was conducted using ProSheet and the Plaxis program.
Figure 51. Anchorage sheet pile driven depth during water tables
Figure 52. Anchorage’s deformation X during water tables
When taking into account the water tables existence in the sheet pile anchorage, the displacements and driven depth display a rise that matches a rise in levels of water table, much like the situation involving the anchorage sheet pile.
3.5 Anchor distance impact in surface ground (y)
A considerable water table depths below the ground surface was taken into consideration, and dry sand soil was limited in order to investigate the influence of the anchor distance from the surface ground (y) on anchorage sheet piles. As previously stated, the anchor distance changed as (0.2h-0.3h-0.5h), where (h) corresponds to the dredge level. The driven depth was retained at 2.6 meters, and the dredge depth (H) stayed unchanged at 5 meters. Table 10 provides information about the anchors, grout body, and sheet pile properties.
The Plaxis 2D program produced numerical data for horizontal displacement and moment alongside the sheet pile anchorage. Figures 53 and 54 illustrate how these data were displayed using an Excel spreadsheet to show moment and horizontal displacement alongside sheet pile cantilever in situations where there is a water table.
Table 10. Features of a sheet pile anchorage with varying anchor distances from the ground
|
Sheet Pile |
Grout |
Anchor |
|
w:20 KN/m |
|
|
|
EI:2.096E6 KN/m2 |
L:2m |
L:3m |
|
$\upsilon$:0.15 |
|
|
|
EA:100.2E6 KN/m |
D:0.3m |
EA:2E5 KN/m |
|
d:0.501m |
|
|
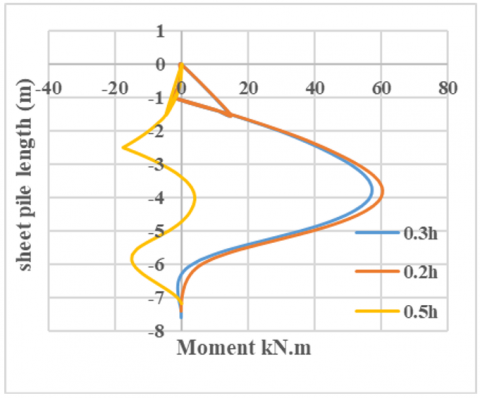
Figure 53. Anchorage sheet pile moment diagram (anchor length case)
Figure 54. Anchorage sheet pile horizontal displacement diagram (anchor length case)
Figure 55 demonstrates that the driven depth is not significantly affected by the anchor’s distances in the surface; rather, driven depths gradually drops as the anchor’s distance from the ground surface rises. Furthermore, the outcomes produced by Plaxis and ProSheet are roughly aligned.
As stated in Figure 56, there are no impacts caused by changes in the distances of anchors from ground because the horizontal displacement was maintained fixed regardless of the distance of anchors from ground.
Figure 55. Anchorage sheet pile driven depth diagram (anchor distance case)
Figure 56. Anchorage sheet pile horizontal displacement (anchor distance case)
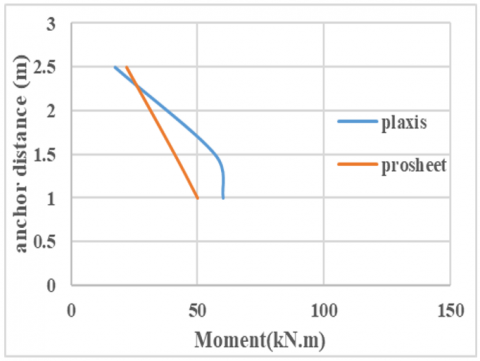
Figure 57. Anchor distance case for anchorage sheet pile moment
The maximum moment reduces with rising anchor distance from the surface, as can be observed in Figure 57. Similarly, there is a noticeable convergence of the two programs’ parameters.
3.6 Number of anchors effects
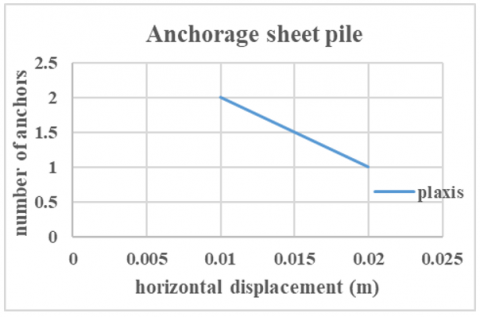
The sheet piles efficiency on situations with 1 and 2 anchors is compared in this section to explore the implications of anchor numbers. For both instances, the analysis entails computing moments, deformation, and driven depth. This study is only carried out in Plaxis 2D because ProSheet is incapable of dealing with multiple anchors. The first anchor is 1.5 meters above the ground, and the second anchor is 2.5 meters beneath the surface.
A substantial drop in horizontal displacement is apparent in Figure 58 as the number of anchors rises.
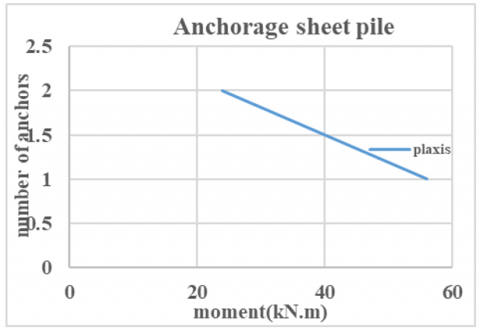
When two anchors were utilized, the maximum moment was reduced by 50% (refer to Figure 59).
Figure 58. Number of anchor case for anchorage sheet pile horizontal displacement
Figure 59. Number of anchor case for anchorage sheet pile moment
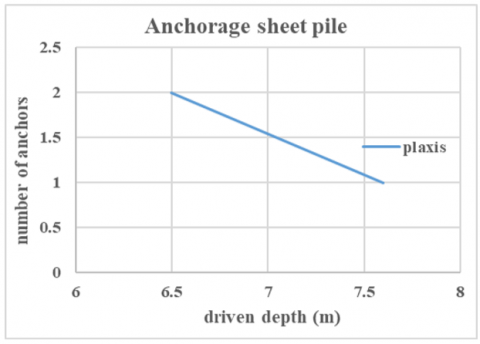
Figure 60. Number of anchor case for anchorage sheet pile driven depth
Additionally, Figure 60 demonstrates how utilizing two anchors reduced driven depth by 1 meter.
3.7 Distance between anchors effects
This section analyzes situations with one or two anchors in order to investigate how the number of anchors influences sheet pile behavior. In both cases, the evaluation includes the computation of moments, deformation, and driven depth, and it is carried out entirely in Plaxis 2D due to ProSheet’s limitation of enabling just one anchor. Table 6 summarizes the specific features of the anchors, grouted body, and sheet pile. The first anchor is 1.5 meters over the ground, and the second anchor is 2.5 meters beneath the surface. Interestingly, the driven depth is not influenced by the spacing between anchors; thereby, the economically driven depth continues at 7.6 meters.
Further, as the distance between anchors rises, Figure 61 demonstrates a slight reduction in the moment. Thus, the moment is mostly independent of the spacing between anchors.
Figure 61. Distance between anchors case of anchorage sheet pile moment
Figure 62 illustrates how the distance between anchors has minimal influence on the horizontal displacements.
Figure 62. Distance between anchors case of anchorage sheet pile horizontal displacement
The maximum moment and driven depth are directly related to the dredge depth in sandy soil. Furthermore, the horizontal displacement rises in accordance to the dredge depth behind the sheet pile, with these increases reflecting the dredge depth’s percentage rise. The findings of the analysis of the sandy cantilever sheet pile indicated convergence of the Plaxis and Pro Sheet programs. Particularly, the displacement values from Plaxis were clearly bigger, but the moment and driven depth values from the Pro Sheet program were greater. To retain stability while preventing collapse, we chose a larger sheet pile with improved rigidity and flexibility for the sandy sheet pile cantilever with dredge depths of five and seven metres. There was significant agreement between the values of two softwares for horizontal displacement and driven depths in instance of anchorage sheet pile in a comparable sandy soil condition. There were, nevertheless, variances in the maximum moment estimates between the two software.
A comparative analysis of the two types of sheet piles that were employed in dry sandy soil demonstrates that the anchorage sheet pile has a greater driven depth whenever an anchor is incorporated. Despite it being less than the comparable values found in the sheet pile cantilever in a dredge depths of three metres, these enhancement still provides a 25% increase. Yet, for 5 and 7 meters dredge depths, the enhancement rises to 30%. The findings demonstrate that the application of grouts and anchors assists in reducing the driven depth, which suggests higher economic efficiency. Variations in groundwater level generate a reduced penetration depth of roughly 14% as the groundwater level drops in the case of a 5-meter dredge depth and the cantilever sheet pile. Interestingly, in the present instance, the values that emerged from the Plaxis and Prosheet programs closely match.
Considering sandy soil and fluctuating groundwater levels, the anchorage sheet pile needed a diameter of 0.4 meters, a 8 metres anchor length, and 4 metres grout length so as to stabilize the sheet pile. A 38% decrease in the driven depth after the anchor was implemented in the presence of a water table indicates that the strategy was more cost-effective. Adjustments in spacing values had little impact on the driven depth in the examination of anchor element spacing in dry sandy soil. On the other hand, the maximum moment value dropped as the space between the elements grew. This observation signifies that in order to reduce the moment value, it is encouraged to keep a spacing from the sheet pile height at 0.5 h throughout the design phase and when utilizing multiple anchor elements.
The performance of both cantilever and anchorage sheet piles under numerous contributing conditions was the main focus of this research. Water tables and Dredge levels, ground surface anchor distance, anchor spacing, and anchors quantity were among the significant parameters that were investigated. The analysis was carried out in static conditions, which led to suggestions for additional work in the following fields:
(1) Analyze how seismic conditions impact function of sheet pile, utilizing approaches like earthquakes time history to offer better seismic designs.
(2) Optimizing sheet pile efficiency by employing safe and cost-effective methods.
(3) To identify the most economical and safer sheet pile architecture, carry out field tests that replicate actual situations and compare them with modern technologies.
(4) Analyze piping phenomena for ensuring sheet pile stability in the event of water flow, and analyze the water flow phenomenon caused by changes in levels in front and behind the sheet pile.
(5) Analyze the implications of the backfill’s inclination below the sheet pile.
[1] Bjerrum, L., Frimann, L.J., Has, M., Duncan, J.M. (1927). Earth pressures on flexible structures (state of the art report). No. R&d Rept.
[2] Amer, H.A.R. Effect of wall penetration depth on the behavior of sheet pile walls. Dissertations. University of Dayton, USA, 2013.
[3] Smoltczyk, Ulrich, (2003). Geotechnical Engineering Handbook, Procedures. Vol. 2. John Wiley & Sons.
[4] Yandzio, E. (1998). Design guide for steel sheet pile bridge abutments. https://cis.ihs.com/cis/document/248684
[5] Liu, L., R. Dobry (1997). Seismic response of shallow foundation on Liquefiable Sand. Journal of Geotechnical and Geoenvironmental Engineering, 123(6): 557-567. https://doi.org/10.1061/(asce)1090-0241(1997)123:6(557)
[6] Poulos, H.G. (1973). Analysis of piles in soil undergoing lateral movement. Journal of the Soil Mechanics and Foundations Division, 99(5): 391-406. https://doi.org/10.1061/jsfeaq.0001879
[7] Abd El Raouf, M.E. (2020). Numerical analysis of anchored sheet pile walls. Journal of Al-Azhar University Engineering Sector, 15(55): 594-603. https://doi.org/10.21608/auej.2020.87864
[8] Bilgin, Ö., Erten, M.B. (2009). Analysis of anchored sheetpile wall deformations. In Contemporary Topics in Ground Modification, Problem Soils, and Geo-Support, 137-144. https://doi.org/10.1061/41023(337)18
[9] Rowe, P.W. (1951). Cantilever sheet piling in cohesionless soil. Verlag nicht ermittelbar.
[10] Rieke, R.D., Crowser, J.C., Schroeder, W.L. (1988). Bulkhead failure investigation and redesign. Journal of Geotechnical Engineering, 114(10): 1110-1125. https://doi.org/10.1061/(ASCE)0733-9410(1988)114:10(1110)
[11] Emarah, D.A., Seleem, S.A. (2018). A numerical study of anchored sheet piles subjected to different types of sandy soils backfill. HBRC Journal 14(3): 422-430. https://doi.org/10.1016/j.hbrcj.2018.03.001
[12] Smith, I.M., Boorman, R. (1974). The analysis of flexible bulkheads in sands. In Proceedings of the Institution of Civil Engineers, 57(3): 413-436. https://doi.org/10.1680/iicep.1974.4024
[13] Pratiwi, D., Yakin, Y.A., Mahaputra, A. (2022). Analisis Stabilitas Lereng Batuan dengan Pendekatan Kriteria Keruntuhan Hoek-Brown dan Mohr Coulomb Menggunakan Metode Numerik Plaxis 2D. Publikasi Riset Orientasi Teknik Sipil (Proteksi), 4(2): 74-81. https://doi.org/10.26740/proteksi.v4n2.p74-81
[14] Maarouf, T., Mahmoud, R. (2019). Prediction of surrounding effects in soft soil deposits due to piling-A study of comparing different prediction methods.
[15] Day, R.A., Potts, D.M. (1993). Modelling sheet pile retaining walls. Computers and Geotechnics, 15(3): 125-143. https://doi.org/10.1016/0266-352X(93)90009-V
[16] Wang, P.S., Ding, H.Y., Zhang, P.Y., Zhao, E.N., Zhou, J.L., Bai, J.H. (2020). Dynamic response of saturated sandy foundation and friction pile under seismic action. International Journal of Safety and Security Engineering, 10(4): 451-458. https://doi.org/10.18280/ijsse.100403
[17] Young, R. (2012). Soil Properties and Behaviour. Elsevier.
[18] Sheet Piling -ArcelorMittal Europe Long Products, ArcelorMittal. https://sheetpiling.arcelormittal.com/products/az-46-700n/, accessed on 20 November 2023
[19] AZ 46-700N -arcelormittal -steel sheet piles, ArcelorMittal. https://sheetpiling.arcelormittal.com/products/az-46-700n/.