Baydaa M. Merzah*![]() | Muayad Sadik Croock
| Muayad Sadik Croock![]() | Ahmed Noori Rashid
| Ahmed Noori Rashid![]()
© 2024 The authors. This article is published by IIETA and is licensed under the CC BY 4.0 license (http://creativecommons.org/licenses/by/4.0/).
OPEN ACCESS
In recent years, the performance evaluation for footballers in field as traditional way is turned to the electronic platforms. This is as a relative approach to the traditional ones that suffer from human errors or need special designed equipment and expensive software. Therefore, there is a need for simple and accurate electronic system to evaluate the performance of football players at training and matches sessions, this help coaches to work better during training and to enhance the identified weakness and guide training tasks based on quantative information. The optical tracking techniques are employed mainly for processing real-time and recorded football matches to track a footballer and getting the important data. In this paper, an optical tracking model is proposed for tracking footballers in non-real-time matches’ videos using OpenCV library. Different image processing operations have been performed to include the conversions, filtering, feature extraction and identification. Moreover, the proposed model collects the tracking parameters of a footballer to be saved in a built dataset, which represents the main contribution of the work. The obtained parameters include footballer speed, crossed distance, and activity counts of each player. The proposed model is tested over match videos with maximum 64 seconds time period with 1598 frames. The tracking of a footballer is proved by its high accuracy and applied on 15 videos to create new dataset.
dataset building, feature extraction, OpenCV, optical tracking, performance analysis, player tracking, sport analytics
Football is the most popular sport in the world. Players’ performance is recorded as an important aspect in the coaches’ perspective. In sports sciences, players performance assessment has a crucial role in player development. By evaluating their performance, coaches can provide targeted feedback, identify areas for improvement, and tailor training programs to enhance specific skills. This allows players to progress and reach their full potential, both individually and as a cohesive team. The analysis of the players’ performance is started with notational analysis, done manually, that gave descriptions to the number of actions that occurred throughout the time of the match [1]. This leads the researchers to use different electronic platforms to track the player during the training and match sessions.
The “Fédération Internationale de Football Association (FIFA)” has authorized the use of three types of technologies for players’ tracking: Global Navigation Satellite Systems (GNSS), Local Positioning Systems (LPS), and Optical-Based Systems (OPTS) [2]. Athletes wear GNSS receivers that frequently send their positions to the satellite system, but the system still has limitations when it comes to tracking sudden changes in direction or speed [3]. LPS is a viable tracking solution for sports that requires multiple stations to receive signals from players' signal generators, and calculates the relative positions of the players based on the time differences between signals reaching different stations. This system sensitive to the environments’ change and impacted by the noise [4]. Recently, OPTS has become the leading tracking technology due to its reliable data availability and the absence of sensor issues [5]. Wearable and optical tracking systems tend to be expensive solutions, but recent advancements in video processing techniques and camera technology offer hope for more affordable alternatives [6].
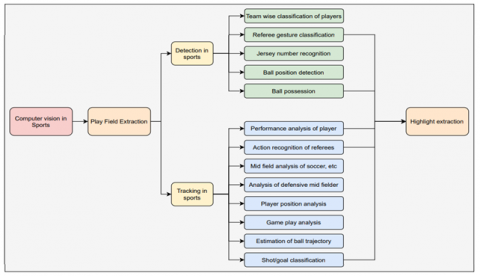
Optical tracking techniques can be used in real time and recorded videos. They translate some features of the players during the match to numerical form which is not easy to notice by the human. Such features include player’s position within each frame in the video, cross distances covered by selected players in the field, running speed, and playing activity type. These features are considered by coaches for the technical evaluation of the footballers [7]. Video analysis plays a pivotal role in the realm of sports, including the broadcast sports analysis conducted by TV presenters. Such analysis aims to annotate significant moments, such as goals, shots, penalties, and others [8, 9]. It is also used in training and coaching areas to provide help for the referee during a game [10, 11]. According to the reference [12], tracking in sport videos can be classified to many groups as shown in Figure 1.
The tracking of multiplayers enfaces numerous challenges in performance assessment [13], such as footballers change their motion unpredictably to mystify other team players. Moreover, players have the same layout jerseys with identical numbers, which leads to difficulties in identifying such player. They are frequently involved in different situations including tackles and possession that cause partial or full occlusion. Environmental conditions also have negative effects on the tracking process [14]. It creates objects shadows on the field and electronic devices’ reflections around the stadium make it hard to track the players as they moving [12, 15]. In addition, it requires localization and continuous monitoring in the playing field with different localization techniques [16, 17].
Figure 1. Optical tracking in sports [12]
In this paper, an optical tracking model is proposed using OpenCV library for players recognition and tracking in recorded match videos to extract features that can be used for assessing them automatically. Numerous image processing operations are performed on the adopted videos. The obtained features that include players speed, crossed distance and playing activity are used for creating the new dataset. This dataset is used to assess the players. The proposed model overcome the limitations of the GNSS and LPS in means of required sensors and cost. The obtained results include the prove of the efficiency of the proposed model and the collected dataset reflects the features of players. The rest of the paper is organized as: section 2: Related work, section 3: Proposed system, section 4: Results and Discussion and the last section is the Conclusion.
The use of Global Navigation Satellite Systems (GNSS) for modeling athletic performances in elite football players has been explored [3]. Previous findings have indicated that GNSS features had limited relevance in predicting individual A-V profiles. Another study focused on the comparison of two approaches, MEDIACOACH and WIMU PRO, utilized in soccer matches to assess the number and distance covered during official competitions [18]. Throughout this investigation, researchers identified inaccuracies associated with Global Positioning System (GPS) signals, which can have detrimental effects on the functionality of positioning systems. These inaccuracies have been observed to be influenced by various factors, including adverse weather conditions and unique stadium characteristics.
In reference [19], a system for player detection and tracking using drone video was proposed. This system employed template matching and particle filter techniques, exhibiting high accuracy in player detection, particularly in cases of player overlapping. However, the accuracy decreased with an increase in the number of players, making it more suitable for sports with fewer players. Similarly, Kim [20] has introduced an innovative approach for tracking multiple players in football match videos. They utilized topographic surface extraction of foreground regions (i.e., players) and employed segmentation to detect player boundaries. This approach successfully preserved the identity of each player, even in scenarios with severe occlusions, but the work confined to a particular match. Furthermore, a proposed work has been made by Aoki et al. [21] for the utilization of embedded systems in real-time video processing captured by UAVs for soccer player tracking. The authors employed object detection and next location prediction techniques, specifically nearest neighbor and motion-based prediction, to anticipate player locations. Furthermore, they incorporated failure correction mechanisms to enhance accuracy. However, a notable drawback of this system was the occurrence of ID switches.
Another group of studies have used a combination of optical tracking techniques and deep learning algorithms. The study [13] was centered around multi-player tracking using Cascade Mask R-CNN to mitigate the problem of player identity switching. This approach involved discovering patterns in jersey numbers and correlating player ID coefficients with the ID using K-shortest path algorithms. Despite achieving state-of-the-art performance, it was noted that this method incurred high computational costs. Shifting the focus to the study [22], the emphasis was placed on extracting tactical statistics directly from match videos. The study employed the Triplet CNN to extract fine-grained features and utilized the Deep Convolutional Generative Adversarial Network (DCGAN) for data augmentation. This enabled the computation of tactical statistics such as successful passes, ball possession duration, and successful steals. Players were categorized into two groups: those with ball possession and those without. Furthermore, Martins and Brito [23] developed a successful system for tracking soccer players in low-quality match videos. The approach employed Faster-RCNN-(RESNET50-FPN) for object detection and addressed challenges related to low-quality videos and various image degradations. However, it should be acknowledged that this work encountered difficulties regarding missing player IDs and further advancements required for broader applicability to any match video.
Due to the inaccuracies in GPS signals and the environmental effects on the functionality of these systems, this research proposes the use of an optical tracking model. The OPTS systems exhibit no signal loss, and the captured videos can be analyzed offline or in real-time processing. Similarly, the OPTS systems utilized in the mentioned studies still possess certain limitations, which the proposed model aims to overcome. To minimize occlusion occurrences, the tracking procedure of football teams was divided into two steps, focusing on one team at a time. Furthermore, recognizing that positional data alone is insufficient for assessing player performance, this work constructs a completely new dataset of metrics derived from match videos. Additionally, to address the computational demands of running deep learning models for video data extraction, the OpenCV library is employed, utilizing standard computer resources. Table 1 summarizes the previous studies and highlight their aims and limitations if available.
Table 1. Techniques used in previous work
|
Tech. |
Author |
Aim |
Limitations |
|
GNSS |
Imbach et al. [3] |
to quantify accelerations and decelerations |
inaccuracies of (GPS) signals affected by inclement weather and characteristics of the stadium |
|
Pons et al. [18] |
to model athletic performances |
limited for predicting individual acceleration-velocity profiles. |
|
|
OPTS |
Karungaru et al. [19] |
to detect and track players trajectories and extract their positions. |
limited number of players and occlusion |
|
Kim [20] |
to track multiple players |
the results are confined to a particular match |
|
|
Aoki et al. [21] |
to track player using an aerial video sequence |
ID switches |
|
|
DL + OPTS |
Zhang et al. [13] |
to address player identity switching |
computationally expensive It just gives the exact location of the moving object. |
|
Theagarajan and Bhanu [22] |
to compute tactical statistics |
not applicable to any match video |
|
|
Martins and Brito [23] |
to tracking players in low quality videos |
occlusion, switched id |
Explaining Numerical data makes data analysis tasks easier. Therefore, translating the physical behavior of players into numbers makes performance assessment by coaches easier and helps to determine the tactical behavior of players and the team. A series of features are required to demonstrate the behavioral dynamics of these agents, such as Cross-Distance (CD), Speed (S), and Activity Count (AC). Our proposed system can obtain these features and convert physical behaviors into numerical data. The applicability of the information obtained by this system can be oriented in different areas of execution: The orientation of training tasks and Technical-tactical development [24].
In this work, a player tracking model is proposed to translate physical features to numerical format. The model is built using OpenCV 4.6 with python 3.11 and Anaconda 2022.10 Jupyter notebook 1.0. The tracking procedure is done by OpenCV CSRT tracker. It can be applied to any match video recorded by tactical camera.
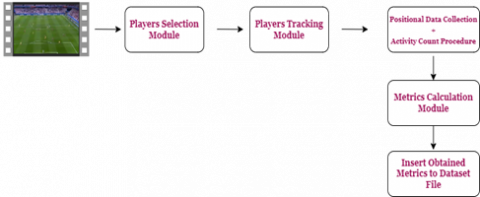
3.1 Block diagram
The overall framework and its individual modules of our approach are explained in Figure 2. The input video initially goes through the player detection module, where soccer players are selected and tracked. In the tracking module, positional data and activity count procedures are performed. Subsequently, the selected regions are processed through the player activity count procedure. Finally, the outputs of all the modules for the entire video are collected to generate a data record for each player, which is then inserted into the dataset file. The details of these three steps are explained in the next section.
Figure 2. Proposed model block diagram
3.2 Proposed algorithm
|
Algorithm 1: Pseudo Code for Collecting Players’ Data |
Tracker Type [CSRT, KCF, MIL,] Number of players to track k=10 Positions.csv = empty Dataset.csv = empty
For i=1 to k Select Region of Interest to Detect Players (Frame) Associate the Tracker with the (Frame) END For
While Continue read the rest of the video Save Positional Data (Tracker Update (Frame)) Activity Count Procedure Until EoV (Video)
Repeat steps 3, 4
Read (Positions.csv) Calculate: Cross-Distance for each player Calculate Speed for each player
|
1. Initialization: In this step, the code initializes various global parameters. One of the key components is the tracker, which is an essential part of the work. As mentioned in the previous section, the OpenCV library is utilized for player tracking. OpenCV offers multiple trackers (CSRT, KCF, MIL), each designed for specific environments. After conducting several experiments, the CSRT tracker is selected, and its details will be discussed further in this section. Furthermore, the number of players to be tracked is determined as ten, excluding the goalkeeper. The "Positions.csv" file is used to store the positions of the selected players in all frames of the video, while the "Dataset.csv" serves as the output file for saving the calculated metrics.
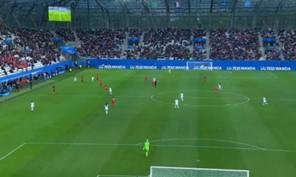
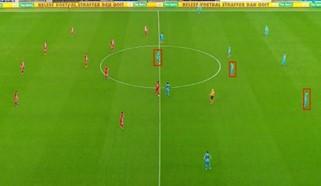
2. Read Football Match Video→ View 1st Frame: Reading an image or video serves as the initial step in commencing any visual data processing task. Generally, video processing involves analyzing a sequence of frames to capture the variations in the tracked player based on the selected features. Figure 3 showcases a sample frame from a video recorded by a tactical camera.
3. Detection: Select 1st Team Players: In this step, the object detection process is carried out by manually selecting the region of interest (player). Automatic detection of moving objects in football matches poses challenges due to occlusion, rapid movement, and the presence of other undesired individuals on the field, such as referees, who may trigger detections. Therefore, the approach of manually selecting the player as the region of interest is adopted.
Figure 3. Tactical camera view
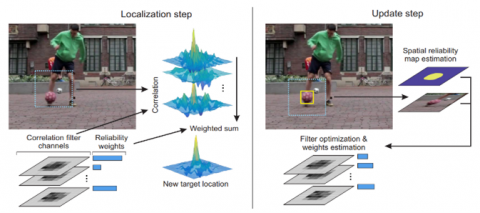
Figure 4. CSRT tracker main steps [25]
4. Tracking: The Channel and Spatial Reliability Tracking (CSRT) tracker is employed in the player tracking procedure. This tracker operates in two main steps: the localization step and the update step, as depicted in Figure 4. The CSRT tracker incorporates various underlying principles, including discriminative correlation filters (DCF), channel and spatial reliability, model update, and multi-channel features, to achieve high performance. It utilizes features such as HoG in conjunction with other feature descriptors like color histograms to construct a multi-channel feature representation of the tracked object. The resulting HoG feature vector captures local texture and edge information, making it an effective descriptor for object detection and tracking. This enables the tracker to effectively capture both the appearance and motion characteristics of the object, leading to robust and accurate tracking performance [25]. The tracking steps are:
Figure 5. Position parameters
The Cross-Distance (CD) is calculated as the sum of the Euclidean distance [26] between two points, representing the player's position in two consecutive frames of the video. It is computed using Eq. (1) then Eq. (2):
$\mathrm{d}=\sqrt{\left(\mathrm{x}_2-\mathrm{x}_1\right)^2+\left(\mathrm{y}_2-\mathrm{y}_1\right)^2}$ (1)
$\mathrm{CD}=\sum_{\mathrm{i}=1}^{\mathrm{n}} \mathrm{di}$ (2)
The cross-distance measurement in pixels is subsequently converted to real-world meters using Eqs. (3)-(4). The calculation of the Pixels Per Meter ratio (ppm) involves utilizing the standard drawing scale relationship and the standard size of a soccer field [27]. Following this, the distance in meters (dm) is calculated as per the method described in the reference [28]. Additionally, the speed for each player is computed using Eq. (5) [29]:
ppm $=\frac{\text { Distance in image }}{\text { Real distance }}$ (3)
$\mathrm{dm}=\frac{\text { Cross }- \text { Distance }(\mathrm{CD})}{\text { ppm }}$ (4)
speed $=\frac{\text { Distance }}{\text { Time }}=\frac{\text { Cross }- \text { Distance }}{\text { Video time }}$ (5)
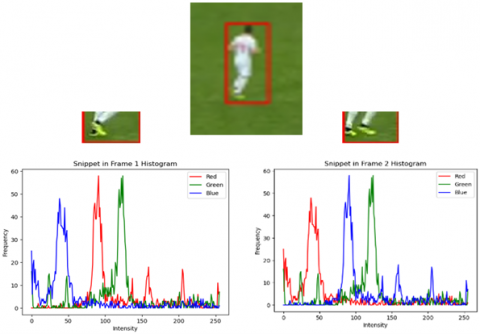
After that, compute the activity count metric for each player. This metric quantifies the activity level of each player, considering actions such as ball passes, ball touches, tackling, and contact with other players. To detect variations in player movements and activity between consecutive frames of the video, an image histogram is utilized. Specifically, the region of interest (ROI) is determined as the lower part of the player's body (feet and legs) using Eq. (6). The histograms of this region in two successive frames are compared using correlation, where a correlation value of 1 indicates identical histograms. Any deviation from a correlation value of 1 result in an increment of 1 to the activity count for the player. To perform this analysis, the target players are initially selected, and then the position of the lower part of their bodies is determined using Eq. (6):
ROI $=\operatorname{frame}[\mathrm{y}+\operatorname{int}(\mathrm{h} * 0.75): \mathrm{y}+\mathrm{h}, \mathrm{x}: \mathrm{x}+\mathrm{w}]$ (6)
7. Insert Metrics to Dataset.csv: After completing the metrics calculations module, the data is prepared as records of players to include the following data:
ID: is the identification record of the player, each player has a unique identifier.
Gender: the analyzed videos were for men and women teams, so to distinguish between men's and women's teams, a value of 1 was assigned to the former and 0 to the latter.
Area: players in the playing field categorized to main groups. Each group is encoded as the following:
Forwarders → 1
Defenders → 2
Midfielders’ → 3
CD: is the computed cross distance of each player
S: is the calculated speed of each player
AC: is the activity count number.
After preparing the players records, CSV file is created to be the Dataset.csv saved for future work.
4.1 Player selection module (Step 1)
Figure 6. Player’s selection
To apply the proposed model, three football players are manually selected to determine three regions of interest and start the tracking module, as shown in Figure 6 and the following steps.
4.2 Player tracking module (Step 2)
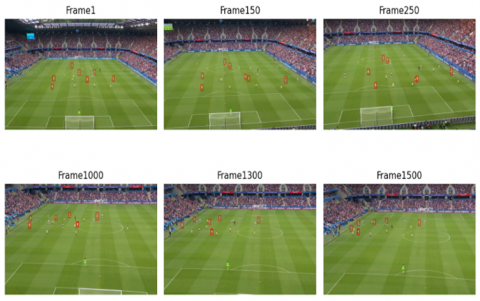
The tracking process is carried out using the CSRT tracker. The CSRT tracker extracts features, such as HoG and color histograms, from the player within the bounding box. These features are weighted based on their importance using channel reliability, while spatial reliability is utilized to weigh the search area according to the likelihood of finding the player within that region. Next, the CSRT tracker predicts the player's position in the next frame based on its previous position and velocity, initiating a search for a match in the predicted positions. Upon locating the player, the tracker updates its position and recalculates the weights. Samples of players' tracking in multiple frames of the adopted video are illustrated in Figure 7. Throughout this module, the positions of each player in each frame are saved in separate lists to enable the calculation of the related metrics. This module continues until the end of the video.
4.3 Metrics calculation module (Step 3)
The cross-distance is computed based on Eq. (2). The total distance samples for player 1, 2, and 3 are calculated to be 65, 63, and 53 meters, respectively. Subsequently, the speed is computed for the same selected players using Eq. (5), resulting in values of 65, 53, and 69 meters per second. Another metric, activity count, is based on histogram analysis. The histogram is computed for the lower part of the player, determined by Eq. (6). When there are ball passes, ball touches, tackling, or other player interactions in successive frames, the histogram value changes, as depicted in Figure 8. If the correlation between the two histograms is less than one, the metric counter increases by one.
All the calculated metrics are collected to form a data record for each player and inserted to a csv file to form the final Dataset file.
To verify the proposed work, three experiments were conducted using three different videos recorded by a tactical camera. These experiments aimed to calculate the accuracy of tracking varying numbers of players throughout the videos. Additionally, a comparison was made between the proposed work and the related work, which utilized the OPTS technique for evaluation. Finally, a statistical analysis of the players' performance was conducted on the obtained dataset.
Table 2. Experiment 1
|
Issues |
1 Player |
3 Players |
5 Players |
7 Players |
10 Players |
|
Occlusion |
$\checkmark$ |
$\checkmark$ |
$\checkmark$ |
$\checkmark$ |
$\checkmark$ |
|
Switch ID |
$\checkmark$ |
$\checkmark$ |
$\checkmark$ |
$\checkmark$ |
$\checkmark$ |
|
Lost tracking |
$\checkmark$ |
$\checkmark$ |
$\checkmark$ |
$\checkmark$ |
$\checkmark$ |
|
Accuracy |
100% |
100% |
100% |
100% |
100% |
Table 3. Experiment 2
|
Issues |
1 Player |
3 Players |
5 Players |
7 Players |
10 Players |
|
Occlusion |
☒ |
☒ |
☒ |
☒ |
☒ |
|
Switch ID |
☒ |
☒ |
☒ |
☒ |
1 $\checkmark$ |
|
Lost tracking |
☒ |
☒ |
☒ |
☒ |
1 $\checkmark$ |
|
Accuracy |
100% |
100% |
100% |
100% |
80% |
Table 4. Experiment 3
|
Issues |
1 Player |
3 Players |
5 Players |
7 Players |
10 Players |
|
Occlusion |
☒ |
☒ |
☒ |
☒ |
☒ |
|
Switch ID |
☒ |
☒ |
☒ |
☒ |
☒ |
|
Lost tracking |
|
☒ |
☒ |
$\checkmark$ 1 |
$\checkmark$ 1 |
|
Accuracy |
100% |
100% |
100% |
90% |
90% |
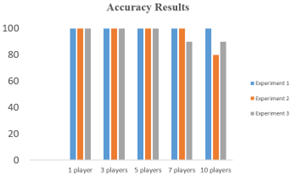
The results of the first phase are shown in Tables 2, 3, and 4, indicating the accuracy computed for the correctly tracked players in the videos. The accuracy of this work was calculated using Eq. (7) and can be viewed in Figure 9. Figures 10, 11 and 12 represent tracking different number of players during the experiments. It was observed that Experiment 1 demonstrated consistently high accuracy across all player configurations, suggesting a high level of performance regardless of the number of players involved. On the other hand, Experiment 2 showed a decline in accuracy specifically for the 10-player configuration, which may indicate that the task becomes more challenging or less manageable with a larger number of players. Similarly, Experiment 3 revealed a slight decrease in accuracy for both the 7-player and 10-player configurations, indicating that the addition of players beyond a certain threshold may impact accuracy to some extent.
Figure 9. Experiments accuracy results
Figure 10. Experiment 1
Figure 11. Experiment 2
Figure 12. Experiment 3
Accuracy $=\frac{\text { Number of correctlly tracked players }}{\text { Total number of selected players }}$ (7)
In the second phase, a comparison was conducted between the collected metrics from our work and other aspects, as presented in Table 5. Most of the related works successfully tracked the positions and trajectories of players in each frame. However, our work expanded the dataset by incorporating the speed variable. Similarly, references [20, 21] showcased superior performance in tracking a larger number of players. Additionally, Aoki et al. [21] introduced a new feature of motion prediction, while our work introduced activity count as a novel aspect. Furthermore, there was variation in the total number of processed frames across the studies, with reference [19] having the lowest value and our work having the highest. Overall, the proposed work excelled in accuracy and demonstrated superior performance across three metrics: speed, activity count, and the number of frames. Finally, the proposed work stood out by creating a new dataset (Dataset.csv) that included the mentioned metrics for 300 players from 15 videos. A sample of the dataset is shown in Table 6 and general statistics viewed in Table 7.
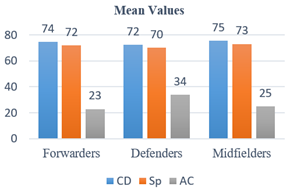
Finally, the statistical analysis of the obtained dataset reveals that midfielders display superior performance compared to other positions, as indicated by their highest mean value. Defenders, on the other hand, exhibit slightly lower average performance when compared to forwarders and midfielders, as evidenced by their lowest mean value. Defenders also cover less ground and have a slower pace during the activity, as reflected in their lowest distance and speed values. Furthermore, defenders show greater involvement or contribution during the activity, as evidenced by their higher activity score. Meanwhile, forwarders and midfielders demonstrate similar mean, distance, and speed values, with midfielders slightly outperforming forwarders, indicating a slightly superior overall performance in terms of higher mean and distance values. Area-based mean values were presented in Figure 13.
Table 5. Proposed work vs. related papers: metric and performance comparison
|
Work |
Position |
Distance |
Speed |
|
[19] |
$\checkmark$ |
$\checkmark$ |
- |
|
[20] |
$\checkmark$ |
$\checkmark$ |
- |
|
[21] |
$\checkmark$ |
$\checkmark$ |
- |
|
Our |
$\checkmark$ |
$\checkmark$ |
$\checkmark$ |
|
Work |
Activities |
No. of Frames |
No. of Players |
|
[19] |
- |
215 - 244 |
3 |
|
[20] |
- |
1000 and 300 |
22 |
|
[21] |
Motion prediction |
3000 per dataset |
22 |
|
Proposed |
Activity count |
5418 per 3 experiments videos |
10 |
Table 6. Dataset samples
|
ID |
Gender |
Area |
CD |
S |
AC |
|
1 |
1 |
1 |
65 |
63 |
1 |
|
2 |
1 |
2 |
65 |
63 |
19 |
|
3 |
1 |
2 |
55 |
53 |
3 |
|
4 |
1 |
3 |
58 |
56 |
11 |
|
5 |
1 |
3 |
65 |
62 |
2 |
|
6 |
0 |
1 |
78 |
74 |
3 |
|
7 |
0 |
2 |
69 |
65 |
2 |
|
8 |
0 |
2 |
72 |
68 |
0 |
|
9 |
0 |
3 |
72 |
68 |
9 |
|
10 |
0 |
3 |
73 |
69 |
8 |
Table 7. Dataset general statistics
|
Function |
Cross Distance |
Speed |
Activity Count |
|
Min |
23 |
21 |
0 |
|
Max |
163 |
157 |
430 |
|
Mean |
74 |
71 |
29 |
|
STDV |
18 |
18 |
55 |
Figure 13. Area-based mean values
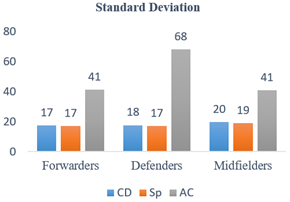
The analysis of standard deviation Figure 14 reveals that there is consistent variability in distance and speed across the positions. However, there is greater variability in the activity and speed performance of defenders compared to forwarders and midfielders. Additionally, midfielders exhibit greater variability in distance and activity compared to forwarders.
Figure 14. Area-based standard deviation
Soccer is a popular sport worldwide. Player tracking and data collection play a crucial role in enhancing training tactics for coaches. This paper proposes an optical tracking model for tracking players in recorded videos and extracting essential metrics to quantify their performance. The model selectively collects useful features from specific players, employing the OpenCV library for player tracking and obtaining metrics such as player positions in each video frame. The computed features include distance, speed, and player activity. The proposed model demonstrates high tracking accuracy and facilitates the creation of a new dataset with extracted performance metrics. However, a noticed drawback of the used tracker is the decline in tracking accuracy when the number of players exceeds a certain threshold. Therefore, future work aims to incorporate more accurate trackers to increase the number of tracked players in different camera views. Additionally, the model's applicability to other sports and the collection of additional valuable metrics opens avenues for future research.
|
AC |
Activity count |
|
CD |
Cross distance |
|
dm |
Distance in meters |
|
ppm |
Pixels per meter |
|
ROI |
Region of Interest |
|
S |
Speed |
[1] Krizkova, S., Tomaskova, H., Tirkolaee, E.B. (2021). Sport performance analysis with a focus on racket sports: A review. Applied Sciences, 11(19): 9212. https://doi.org/10.3390/app11199212
[2] Fifa. (2022). Handbook of Test Methods. pp. 1-17. Retrieved from https://digitalhub.fifa.com/m/18bc36e988d629c1/original/Portrait-Master-Template.pdf.
[3] Imbach, F., Ragheb, W., Leveau, V., Chailan, R., Candau, R., Perrey, S. (2022). Using global navigation satellite systems for modeling athletic performances in elite football players. Scientific Reports, 12(1): 15229. https://doi.org/10.1038/s41598-022-19484-y
[4] Alt, P.S., Baumgart, C., Ueberschär, O., Freiwald, J., Hoppe, M.W. (2020). Validity of a local positioning system during outdoor and indoor conditions for team sports. Sensors, 20(20): 5733. https://doi.org/10.3390/s20205733
[5] Rico-Gonzalez, M., Los Arcos, A., Nakamura, F.Y., Moura, F.A., Pino-Ortega, J. (2020). The use of technology and sampling frequency to measure variables of tactical positioning in team sports: A systematic review. Research in Sports Medicine, 28(2): 279-292. https://doi.org/10.1080/15438627.2019.1660879
[6] Działowski, K., Forczmański, P. (2021). Football players movement analysis in panning videos. In International Conference on Computational Science, pp. 193-206. http://doi.org/10.1007/978-3-030-77977-1_15
[7] Gai, Y., Volossovitch, A., Leicht, A.S., Gómez, M.Á. (2019). Technical and physical performances of Chinese Super League soccer players differ according to their playing status and position. International Journal of Performance Analysis in Sport, 19(5): 878-892. https://doi.org/10.1080/24748668.2019.1669356
[8] Torgler, B. (2020). Big data, artificial intelligence, and quantum computing in sports. 21st Century Sports: How Technologies Will Change Sports in the Digital Age, 153-173. https://doi.org/10.1007/978-3-030-50801-2_9
[9] Lindström, P., Jacobsson, L., Carlsson, N., Lambrix, P. (2020). Predicting player trajectories in shot situations in soccer. In Machine Learning and Data Mining for Sports Analytics: 7th International Workshop, MLSA 2020, Co-located with ECML/PKDD 2020, Ghent, Belgium, pp. 62-75. http://doi.org/10.1007/978-3-030-64912-8_6
[10] Theagarajan, R., Pala, F., Zhang, X., Bhanu, B. (2018). Soccer: Who has the ball? Generating visual analytics and player statistics. In Proceedings of the IEEE Conference on Computer Vision and Pattern Recognition Workshops, Salt Lake City, UT, USA, pp. 1749-1757. http://doi.org/10.1109/CVPRW.2018.00227
[11] Thomas, G., Gade, R., Moeslund, T.B., Carr, P., Hilton, A. (2017). Computer vision for sports: Current applications and research topics. Computer Vision and Image Understanding, 159: 3-18. http://doi.org/10.1016/j.cviu.2017.04.011
[12] Naik, B.T., Hashmi, M.F., Bokde, N.D. (2022). A comprehensive review of computer vision in sports: Open issues, future trends and research directions. Applied Sciences, 12(9): 4429. http://doi.org/10.3390/app12094429
[13] Zhang, R., Wu, L., Yang, Y., Wu, W., Chen, Y., Xu, M. (2020). Multi-camera multi-player tracking with deep player identification in sports video. Pattern Recognition, 102: 107260. http://doi.org/10.1016/j.patcog.2020.107260
[14] Ahmed, H.M., Rashid, A.N. (2022). Wireless sensor network technology and adoption in healthcare: A review. In AIP Conference Proceedings, 2400: 020021. https://doi.org/10.1063/5.0112148
[15] Mohanty, A., Mohanty, S.K., Jena, B., Mohapatra, A.G., Rashid, A.N., Khanna, A., Gupta, D. (2022). Identification and evaluation of the effective criteria for detection of congestion in a smart city. IET Communications, 16(5): 560-570. https://doi.org/10.1049/cmu2.12344
[16] Uthaib, M.A., Croock, M.S. (2020). Vehicle plate localization and extraction based on hough transform and bilinear operations. Indonesian Journal of Electrical Engineering and Computer Science (IJEECS), 20(2): 1088-1097. https://doi.org/10.11591/ijeecs.v20.i2.pp1088-1097
[17] Bradski, G., Kaehler, A. (n.d.). Learning OpenCV.
[18] Pons, E., García-Calvo, T., Cos, F., Resta, R., Blanco, H., Lopez del Campo, R., Pulido-González, J.J. (2021). Integrating video tracking and GPS to quantify accelerations and decelerations in elite soccer. Scientific Reports, 11(1): 18531. https://doi.org/10.1038/s41598-021-97903-2
[19] Karungaru, S., Matsuura, K., Tanioka, H., Wada, T., Gotoda, N. (2019). Ground sports strategy formulation and assistance technology development: Player data acquisition from drone videos. In 2019 8th International Conference on Industrial Technology and Management (ICITM), Cambridge, UK, pp. 322-325. http://doi.org/10.1109/ICITM.2019.8710735
[20] Kim, W. (2019). Multiple object tracking in soccer videos using topographic surface analysis. Journal of Visual Communication and Image Representation, 65: 102683. http://doi.org/10.1016/j.jvcir.2019.102683
[21] Aoki, R., Oki, T., Yokokawa, H., Miyamoto, R. (2019). A computationally efficient tracking scheme for localization of soccer players in an aerial video sequence. In Proceedings of the 2019 3rd International Symposium on Computer Science and Intelligent Control, Amsterdam Netherlands, pp. 1-6. http://doi.org/10.1145/3386164.3389091
[22] Theagarajan, R., Bhanu, B. (2020). An automated system for generating tactical performance statistics for individual soccer players from videos. IEEE Transactions on Circuits and Systems for Video Technology, 31(2): 632-646. https://doi.org/10.1109/TCSVT.2020.2982580
[23] Martins, E., Brito, J.H. (2021). Soccer player tracking in low quality video. ArXiv Preprint ArXiv:2105.10700. https://doi.org/10.48550/arXiv.2105.10700
[24] Felipe, J.L., Garcia-Unanue, J., Gallardo, L., Sanchez-Sanchez, J. (2021). Tracking systems used to monitor the performance and activity profile in elite team sports. Sensors, 21(24): 8251. http://doi.org/10.3390/s21248251
[25] Alan, L., Vojíř, T., Čehovin, L., Matas, J., Kristan, M. (2018). Discriminative correlation filter tracker with channel and spatial reliability. International Journal of Computer Vision, 126(7): 671-688. https://doi.org/10.1007/s11263-017-1061-3
[26] Danielsson, P.E. (1980). Euclidean distance mapping. Computer Graphics and Image Processing, 14(3): 227-248. https://doi.org/10.1016/0146-664X(80)90054-4
[27] Raiola, G., Esposito, G., Sgrò, F. (2020). The formative value of soccer rules. Journal of Human Sport and Exercise, 15: S656-S663. http://doi.org/10.14198/jhse.2020.15.Proc3.18
[28] Kamoji, S., Koshti, D., Dmonte, A., George, S.J., Pereira, C.S. (2020). Image processing based vehicle identification and speed measurement. In 2020 International Conference on Inventive Computation Technologies (ICICT), Coimbatore, India, pp. 523-527. http://doi.org/10.1109/ICICT48043.2020.9112419
[29] Koyuncu, H., Koyuncu, B. (2018). Vehicle Speed detection by using Camera and image processing software. International Journal of Engineering and Science, 7(9): 64-72. http://doi.org/10.9790/1813-0709036472