Hatam K. Kadhom*![]() | Aseel J. Mohammed
| Aseel J. Mohammed![]() | Mika Sillanpää
| Mika Sillanpää![]()
© 2024 The authors. This article is published by IIETA and is licensed under the CC BY 4.0 license (http://creativecommons.org/licenses/by/4.0/).
OPEN ACCESS
In this research paper, interference fit was studied in order to verify the change in the thickness of the models used, as well as the value of the interference fit ratio, and to study its effect on the fatigue phenomenon. Three variables were taken for the thickness of the board: 2, 4, and 6 mm, and three ratios of interference fit: 1.5, 2.4, and 4.7, to see its effect on the phenomenon of fatigue. As the results showed, high pressure is required for the process to pass the pin inside the hole. The deformation value increases with the thickness of the sample. The ANSYS program was used for the purpose of simulation. High pressure is required for the pin to pass inside the hole. The deformation value increases with the thickness of the sample. The highest stress value is 0.063mm, which is the highest value compared to other solutions. It is necessary to obtain results that represent the trajectory on the three axes of the mouth of the pin. The interference fit's pressures and deformations must be used to get findings that depict the route along the mouth's three axes. Changes in the route indicated by the edge of the sample along its length to the center of the pin result in x-axis deformations; it is evident that when the interference fit becomes tighter, the deformation value also rises. In the scenario where the ratio fits 4.7%, deformation has reached 0.1mm, which is the largest amount compared to other instances. The maximum stress value of any known solution is 3.7 GPa. The value of the stresses on the y axis varies throughout the track and rises at the second-third of the axis track length. The deformation value in the situation when the ratio fits 4.7 percent has reached 0.27mm, which is the largest value.
interference fit, fatigue phenomenon, fit ratio, deformation
The connection technique of composite fasteners has been a hotspot of study because of the widespread usage of high-performance composite materials. Matrix degradation and delamination are the major causes of plate failure in the composite. The fastener's pull-out performance was investigated using pull-through resistance testing. Fastener pre-tightening and pulling performance were enhanced by adjusting structural factors using the response surface method (RSM) [1]. There is mounting evidence that new blood may restore functions lost with aging. Extracellular vehicles (EVs) have a therapeutic impact on a wide range of disorders and prevent bone loss in aged mice. Several miRNAs with anti-bone-loss properties were tested using a quantitative real-time polymerase chain reaction assay in vitro. Using a miRNA micro ribonucleic acid inhibitor of particular target sequences, seven different cell types were analyzed [2]. At the limit of maximum primary stress, linear elastic carbon fibers break. The matrix of epoxy resin is elastoplastic due to its malleability. Interface debonding between the fiber and matrix may be simulated with the use of a cohesive zone model. A 30-degree angle between normal pressure and fiber direction is shown to be the weakest part of the hole opening [3]. Cold extension and obstruction fit were displayed to build the exhaustion life of a latch opening, and this improvement was viewed as owing to both an adjustment of the weakness harm improvement at the pivotal point and a lessening in most extreme pressure or stress plentifulness. Weakness harm movement is demonstrated once the opening virus grows or the pin disrupts its mate [4]. In the planning of composite overlay developments, the thought of nonuniform pressure circulation around obstruction fit joints is of extraordinary significance. An insightful model for pressure circulation is made in view of the mind-boggling expected hypothesis of Lekhnitskii. The discoveries affirm the legitimacy of the logical model and uncover that the overlay property and utilization direction essentially influence the pattern of the pressure dispersion [5]. In this article, we examine how interference fitting might extend the useful life of components. The characteristics of stainless steel and aluminum alloys affect the distribution of contact stresses in such a fitting. Interference fitting could be utilized in riveted joints or other applications using permanent fasteners [6]. A review has investigated the interchange between the screw opening fit conditions and the preloads of the latches on the heap bearing capacity of single-lap composite-to-titanium catapulted joints. A three-layered limited component moderate disappointment investigation model is introduced to expect the impacts of the obstruction fit and clasp's preloads on the mechanical ways of behaving of the joints. The outcomes demonstrate the way that the right fit conditions can further develop the contact states of the stacked joints, which thus defers the fiber disappointments around the clasp openings [7]. The plan and testing of lap plate examples with a scope of impedance fit sizes and the inclusion of a hex bolt into an obstruction fit A two-layered axisymmetric limited component model was made in the business limited component program ABAQUS to recreate the bolt inclusion process. Subsequent to embedding the impedance-fitted bolt, we saw the variable elements of the non-uniform opening extension and bulge as the obstruction fit size developed [8]. The principal justification behind the impedance fit shafts emerging from the planet transporter after 65. h of planetary stuff minimizer working is not entirely set in stone by doing a three-dimensional limited component multi-contact recreation under rotating loads and examining the subsequent relocation history. By applying warm burdens to the shafts with orthotropic coefficients of warm extension, a planet transporter and shafts gathering with impedance Fit were displayed. For the thick-wall chamber, the contact pressure was checked utilizing a three-dimensional limited component contact model, and it was viewed as similar to that of Lamé's situations [9]. Interference-fit pins are used to improve the strength and fatigue resistance of fiber-reinforced composites. In a simulation, we looked at the stress and strain distributions during the installation of an interference-fit pin. Good agreement was found between strain gauge experimental data and FEA-obtained radial and tangential strains around the hole. Strain magnitudes increased with increasing interference fit % following pin insertion. While minor damage was detected for 0.4 percent interference-fits, micro-scale fiber damage occurred in the immediate areas surrounding the hole during pin testing [10]. The fatigue life of double shear lap joints formed from holed plates of Al 2024-T3 has been studied experimentally and numerically. The effect of cold expansion and interference fit on fatigue life and failure mechanisms was investigated by subjecting the specimens to fatigue testing. Finite element simulations were also used to provide an explanation for the experimental findings [11]. Influence and ductile testing uncovered an effect sturdiness KV of 43J at room temperature, an extreme rigidity of around 1100 MPa, and a yield strength of around 1000MPa. Hub weariness tests were finished on holed examples regardless of a pin, built of a similar material, and press-fit despite everything left inside their middle opening. A mathematical examination was done to inspect the pressure field utilizing a versatile plastic 2D reproduction utilizing business-limited component programming [12]. The reason for this exploration is to decide what freedom and obstruction fit mean for the disappointment mode, disappointment burden, and bearing strength of pin-stacked joints under foothold loads. Exploratory and mathematical techniques are utilized to determine the disappointment burden and disappointment mode. ANSYS programming is utilized to make limited component models in three aspects. An electron magnifying instrument is likewise used to review the damage [13]. The effect of bolt interference fit on the fatigue life of lap joints under double shear was investigated using a combination of analytical FE modeling and experimental fatigue testing. In the experimental part, we tested double lap joints made from plates of aluminum alloy 2024-T3 with bolts whose clearance varied from zero to complete interference. Using 3-D FE models that mimicked the various pin-in-hole fits assessed, the numerical analysis reproduced the behavior of the S-N curve observed experimentally [14]. Coupon fastener holes were subjected to a stress gradient by installing three different-sized interference-fit pins. This stress gradient's impact on coupon fretting fatigue performance was measured. Non-linear three-dimensional finite element techniques were used to simulate stress and strain states at the fastener hole. The installation of the pin caused a warped deformation in the hole's vicinity, which may account for the generation of tensile tension on the entry side [15]. Most of the previous research did not address the subject of interference due to the difference in thickness of the material used in a simulated way. The results can be extracted in more detail, and the deformation and stress axes can be understood. At the same time, this difference is considered the real originality of this work.
The aim of this work is to study the effect of sample thickness and fatigue phenomenon on deformations that occur because of interference fit. In order to achieve this goal, the following objectives are achieved:
- How plate thickness affects interference fit
- The impact of interference fit on deformities and stress
- Plate thickness's impact on interference fit and fatigue load
- The impact of interference fit on fatigue load-related stress and deformities
The simulation process of interface fit requires a modeling process with a high-precision program in dimensions to obtain interference with exact percentages. The models were designed with the SOLIDWORKS program, which is an accurate engineering program for modeling geometric shapes. Figure 1 represents the real design of the panels and the method of attaching them to the pin.
Figure 1. Geometry design
Whereas, the diameter of the pin hole is 10mm, the length of the test samples is 100mm, and the width is 30mm, and the thickness of the boards varies according to the cases with which they were compared. Three dimensions of the thickness of the boards 2, 4, and 6 mm were used. As for the pin, a dimension of 10mm was taken which is the dimension and clearances of the typical sample [11]. These dimensions represent the logical dimensions in the laboratory reality of the load and fatigue testers, but it increased by dividing the clearance by 1.5%, 2.4%, 4.7% according to the previous reference [11]. This ratio is the division of the diameter of the pin by the diameter of the hole.
Table 1. Mesh independency
|
Case |
Element |
Node |
Maximum Deformation (m) |
|
1 |
417077 |
1342776 |
0.000215 |
|
2 |
521289 |
1965408 |
0.000183 |
|
3 |
632343 |
2356967 |
0.000177 |
|
4 |
729684 |
2722157 |
0.000176 |
After the design process, a grid of high accuracy must be made. To ensure the number of elements, the reliability of the grid must be used, i.e., the increase in the number of elements must be used to reach stable results that do not change with the increase in the number of elements. The value of the element number reached 729684 when obtaining the maximum deformation of 0.000176m, as shown in Table 1. And the size of the element was 0.0005m, as shown in Figure 2.
Figure 2. Geometry mesh
In the context of computational simulations, mesh independence refers to the condition where the results of a simulation remain relatively unchanged as the size and number of elements in the mesh are refined. It is a crucial consideration in numerical analysis to ensure the accuracy and reliability of the simulation results.
The size and number of elements in a mesh can have a significant impact on the accuracy of the simulation results. When the mesh is coarse or contains fewer elements, it may not capture the fine details or variations in the physical system being simulated. This can lead to inaccurate predictions and a lack of convergence in the solution. On the other hand, using a very fine mesh with excessive elements can unnecessarily increase computational costs without providing significantly improved results as Figure 3 shows boundary condition.
Figure 3. Path of result at: (a) x axis; (a) y axis; (a) z axis
Where the simulation process was done in two ways, the first represented the deformations and stresses that got on the sample as a result of the large diameter of the pin, i.e., the effect of interference fit. In the second case, with the presence of interference fit, the sample obtains a state of fatigue with a fully reverse load by applying pressure on the edge of the sample of 60000Pa, and all samples are made of aluminum alloys, as shown in Figure 4.
Figure 4. Aluminum alloys properties
The overall equilibrium equations for linear structural static analysis are:
$\left[ K \right]\left\{ u \right\}=\left\{ F \right\}$ (1)
or
$\left[ K \right]\left\{ u \right\}=\left\{ {{F}^{a}} \right\}+\left\{ {{F}^{r}} \right\}$ (2)
where,
[K]=$\mathop{\sum }_{m=1}^{N}~\left[ {{K}_{e}} \right]$=total stiffness matrix
{u}=nodal displacement vector
N=number of elements
$\left[ {{K}_{e}} \right]$=component solidness network (portrayed in Component Library) (may incorporate the component stress firmness lattice (depicted in Pressure Solidifying))
{$\text{F}\}$=reaction load
{${{F}^{r}}\}$=reaction load vector
{${{F}^{a}}\}=$the absolute applied load vector, is characterized by:
$\left\{ {{F}^{a}} \right\}=\left\{ {{F}^{nd}} \right\}+\left\{ {{F}^{ac}} \right\}+\mathop{\sum }_{m=1}^{N}~\left( \left\{ F_{e}^{th} \right\}+\left\{ F_{e}^{pr} \right\} \right)$ (3)
where,
{${{F}^{nd}}\}$=applied nodal load vector
{${{F}^{ac}}\}=-\left[ M \right]\left\{ {{a}_{c}} \right\}=$acceleration load vector
$\left[ M \right]=\mathop{\sum }_{m=1}^{N}~\left[ {{M}_{e}} \right]$=total mass matrix
$[{{M}_{e}}$]=component mass network (depicted in Deduction of Primary Lattices)
$\{{{a}_{c}}$}=all out speed increase vector (characterized in Speed increase Impact)
{$F_{e}^{th}\}$=component warm burden vector (depicted in Deduction of Primary Frameworks)
{$F_{e}^{pr}\}$=component pressure load vector (portrayed in Deduction of Underlying Frameworks)
Consider a one-component segment model that is exclusively stacked by its own load to show the heap vectors. Response Burden Vectors and Applied Burden Vectors Albeit the lower applied gravity load is applied straightforwardly to the forced removal thus doesn't make strain, it contributes similarly as a lot to the response load vector as the higher applied gravity load. Furthermore, any applied burdens on a specific DOF are ignored assuming the solidness for that DOF is 0.
Paper titles should be written in upper-case and lower-case letters, not all upper-case, e.g., “Instructions for preparing papers for Mathematical Modelling of Engineering Problems”. Do not use capital letters for prepositions, articles or conjunctions unless one is the first word.
Avoid writing long formulas with subscripts in the title; short formulas that identify the elements are fine (e.g., “Nd-Fe-B”).
4.1 The effect of plate thickness on interference fit
The testing process in the study involved subjecting a sample to deformation and measuring its response. The exact nature of the deformation and measurement techniques may vary depending on the specific experiment and materials being studied, but I'll provide a general overview. First, the sample is prepared, which could be a physical object or a computational model, depending on the nature of the study. In the case of a physical sample, it could be a solid component or a test specimen. The sample is typically designed or chosen to represent a particular system or behavior of interest. The path of the sample refers to the specific loading or deformation conditions applied to it during the experiment. This could involve subjecting the sample to external forces, displacements, or other types of applied loads. By changing the path, the authors mean altering the manner in which the sample is deformed or the specific loading conditions applied. The authors may vary the path of the sample to investigate different deformation scenarios or loading conditions and their effects on the behavior of the system. This allows them to study the response of the sample under different conditions and assess its mechanical properties or performance. Regarding the term "interference fit," it refers to a type of joint or connection between two or more components where the mating parts are intentionally designed to have a slight interference or overlap in their dimensions. In other words, the parts are intentionally made slightly larger or smaller than their nominal sizes to create a tight fit when assembled. The purpose of an interference fit is to achieve a secure and rigid connection between the components, typically without the need for additional fasteners or adhesives. The interference or overlap between the mating parts creates friction and pressure, which helps to maintain the joint integrity and transfer forces effectively between the components. In the study, an interference fit may be employed as a means of connecting different parts of the sample or to simulate real-world conditions where such fits are commonly used. The specific details of the interference fit, such as the dimensions of the mating parts or the amount of interference, would be provided in the study to ensure reproducibility and clarity. Overall, the testing process involves subjecting the sample to controlled deformations or loading conditions, measuring the response of the sample, and analyzing the obtained data to draw conclusions about the behavior, performance, or mechanical properties under investigation.
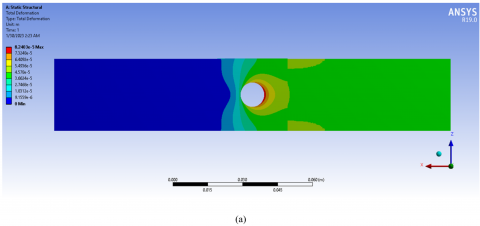
The increase in the thickness of the sample helps to reduce the stresses and deformations that occur as a result of the interference fit process, but at the same time, there is difficulty in the process of inserting the pin, which therefore requires high pressure for the process of passing the pin inside the hole. Figure 5 represents the deformations, strains, and stresses resulting from interference fit.
Figure 5. Contour of thickness 2mm and interference fit 1.5% at: (a) deformation; (b) strain; (c) stress
It is necessary to obtain results that represent the trajectory on the three axes of the mouth of the stresses and deformations that occur as a result of the interference fit. Figure 6 shows the deformations that occur on the x axis with the change of the path represented by the edge of the sample along its length to the center of the pin. Where it can be seen from Figure 6 that the deformation value increases with the increase in the thickness of the sample. The reason for this is that the increase in the thickness of the sample requires a great force to insert the pin into the sample.
Figure 6. Deformation with length at x-axis from center of pin at different thickness plate
Figure 7 shows the deformations that are counted in the y axis, which shows that the deformation value increases with the increase in the thickness of the sample, as the path length y represents the thickness of the sample, and therefore the phase varies from one test to another, where g, where the value of the deformation in the case where the thickness of the sample is 6mm, has reached 0.014mm, which is the highest value compared to the other cases.
Figure 7. Deformation with length at y-axis from center of pin at different thickness plate
Figure 8 shows the deformations that are counted in the z axis, which shows that the deformation value increases with the increase in the thickness of the sample, as the deformation value in the case where the thickness of the sample was 6mm had reached 0.063mm, which is the highest value compared to the other cases
Figure 8. Deformation with length at z-axis from center of pin at different thickness plate
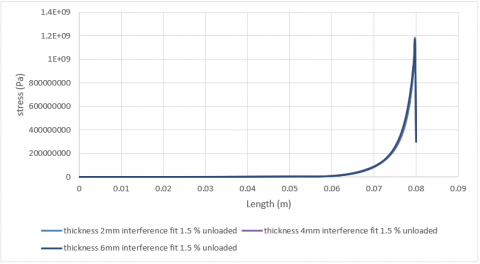
The increase in the thickness of the samples increases the deformations resulting in the simulation process, and thus it increases the value of the stresses generated within the samples, as Figure 9 shows the value of the deformations that occur on the x axis 1.15GPa, which is the highest stress value compared to other solution. Figure 10 shows the value of the stress that occur on the y-axis 1.18 GPa. As Figure 11 shows the value of the stress that occur on the z-axis 1.18 GPa.
Figure 9. Stress with length at x-axis from center of pin at different thickness plate
Figure 10. Stress with length at y-axis from center of pin at different thickness plate
Figure 11. Stress with length at z-axis from center of pin at different thickness plate
Figure 12 illustrates the deformation of a material in relation to its length along the x-axis, measured from the center of a pin.
Figure 12. Deformation with length at x-axis from center of pin at different thickness plate
Figure 13 depicts the deformation of a material, but this time the measurements are taken along the y-axis from the center of a pin.
Figure 13. Deformation with length at y-axis from center of pin at different thickness plate
As Figure 14 shows the value of the deformation that occur on the z-axis 0.00021 m.
Figure 14. Deformation with length at z-axis from center of pin at different thickness plate
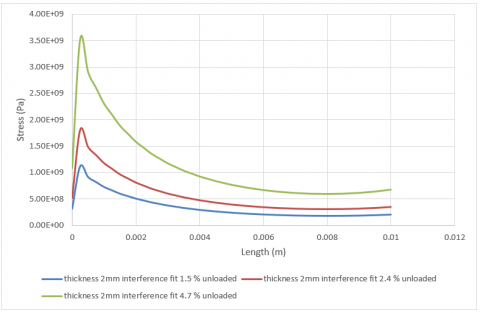
Figure 15 displays the value of the deformations that occur along the x axis as a function of the inference fit, demonstrating that an increase in the inference fit increases the deformations resulting from the simulation process and, in turn, increases the value of the stresses generated within the samples. The maximum stress value of any known solution is 3.7GPa.
Figure 15. Stress with length at x-axis from center of pin at different thickness plate
Figure 16 depicts the influence of the track on the interference fit process, showing how the value of the stresses varies along the track and rises at the second third of the y axis track length.
Figure 16. Stress with length at y-axis from center of pin at different thickness plate
As Figure 17 shows the value of the stress that occur on the z-axis 3.6 GPa.
Figure 17. Stress with length at z-axis from center of pin at different thickness plate
4.2 The effect of plate thickness on interference fit with fatigue load
The increased sample thickness helps in reducing stresses and deformations brought on by the interference fit process, but it also makes it more difficult to insert the pin and necessitates the use of high pressure to do so. The deformations, strains, and stresses brought on by interference fit are shown in Figure 18.
Figure 18. Contour of thickness 2mm and interference fit 1.5% at: (a) deformation; (b) strain; (c) stress
The stresses and deformations brought on by the interference fit must be represented in the findings in terms of their trajectory along the mouth's three axes. The deformations on the x-axis that result from changing the route taken by the sample's edge along its length to the pin's center are shown in Figure 19. Figure 19 illustrates this point, showing how the deformation value rises as sample thickness decreases. The reason for this is because, in contrast to the other example, the tiny thickness does not carry the value of deformations caused by the load; instead, the significant difference is seen in the overlapping values of the deformations that are overlaid on them, or the phenomenon of fatigue.
Figure 19. Deformation with length at x-axis from center of pin at different thickness plate
Figure 20 displays the deformations that are counted along the y axis. It demonstrates that the deformation value increases as the sample thickness decreases because the path length y represents the sample thickness. As a result, the phase changes from one test to the next. For example, in the case where the sample thickness is 2mm, the deformation value reached 0.2mm, the highest value when compared to the other cases.
Figure 20. Deformation with length at y-axis from center of pin at different thickness plate
Figure 21 displays the deformations that are tallied along the z-axis. This figure demonstrates that the deformation value rises as the sample thickness decreases, with the case of the thickest sample (2mm) having the greatest deformation value at 0.18mm.
Figure 21. Deformation with length at the z-axis from the center of the pin at different thickness plate
The value of the deformations that occur on the x axis is shown in Figure 22. As the thickness of the samples is increased, the deformations that arise from the simulation process are reduced, increasing the value of the stresses created inside the samples. The maximum stress value as compared to other solutions is 1.2GPa. As Figure 23 shows the value of the stress that occur on the y-axis 3.3 GPa.
Figure 22. Stress with length at the x-axis from the center of the pin at different thickness plate
Due to the influence of the track on the interference fit process, the value of the stresses on the y-axis, which is shown by Figure 23, vary throughout the track and rise at the second third of the axis track length.
Figure 23. Stress with length at the y-axis from the center of the pin at different thickness plate
As Figure 24 shows the value of the stress that occur on the z-axis 1.18 GPa.
Figure 24. Stress with length at the z-axis from the center of the pin at different thickness plate
4.3 The effect of interference fit on stress and deformities with fatigue load
In order to describe the route on the three axes of the mouth from the pressures and deformations caused by interference fit, findings must be obtained. Figure 25 depicts the x-axis deformations that take place when the route indicated by the sample's edge varies along its length to the pin's center. Figure 25 makes it obvious that the deformation value rises as the interference fit does. This is because a rise in the ratio necessitates a strong force to insert the pin into the sample.
Figure 25. Deformation with length at x-axis from center of pin at different thickness plate
The deformations estimated in the y axis are shown in Figure 26. The deformation value is shown to grow with the interference fit, where the route length y indicates the sample thickness and the stage changes from test to test. When compared to other scenarios, the deformation value in the situation when the ratio fit 4.7 percent has reached 0.27mm, which is the largest value.
Figure 26. Deformation with length at y-axis from center of pin at different thickness plate
Figure 27 displays the deformations that are computed along the z axis. As the deformation value in the case of the interference fit of 4.7 percent has reached 0.3mm, the greatest value compared to the other instances, it can be seen that the deformation value rises as the interference fit increases.
Figure 27. Deformation with length at z-axis from center of pin at different thickness plate
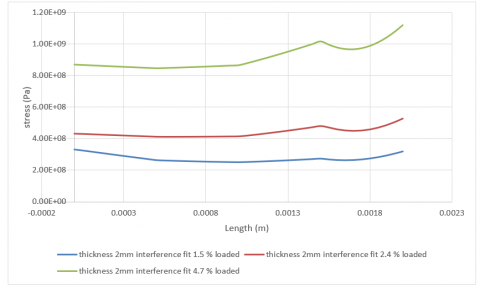
The value of the deformations that occur on the x axis is shown in Figure 28. An increase in the inference fit causes an increase in the deformations produced by the simulation process, which raises the value of the stresses created within the samples. The maximum stress value as compared to other solutions is 3.7GPa.
Figure 28. Stress with length at x-axis from center of pin at different thickness plate
Due to the influence of the track on the interference fit process, the value of the stresses on the y-axis, which is shown in Figure 29, varies throughout the track and rises at the second third of the axis track length.
Figure 29. Stress with length at y-axis from center of pin at different thickness plate
As Figure 30 shows the value of the stress that occur on the z-axis 3.6 GPa.
The results of the research paper contribute greatly to the construction of vehicles or huge pieces that need interference fit in their field and understanding the proportions and dimensions that need to be used.
Figure 30. Stress with length at z-axis from center of pin at different thickness plate
This study provides valuable insights into the deformation behavior of the sample under different loading conditions and highlights the importance of mesh independence in computational simulations. The findings have practical implications for various industries and lay the groundwork for future research directions. By building upon this work, we can advance our understanding of similar systems, improve design methodologies, and optimize the performance of components and structures in real-world applications.
In future work, a specific application can be used complicated geometries and calculate the stresses and deformations that occur as a result of interference fit.
Authors would like to thank the University of Technology-Iraq, for supporting the present work.
[1] Liu, Y., Li, M., Lu, X., Li, Q., Zhu, X. (2021). Pull-out performance and optimization of a novel Interference-fit rivet for composite joints. Composite Structures, 269: 114041. https://doi.org/10.1016/j.compstruct.2021.114041
[2] Hu, Y., Xu, R., Chen, C.Y., Rao, S.S., Xia, K., Huang, J., Yin, H., Wang, Z.X., Cao, J., Liu, Z.Z., Tan, Y.J., Luo, J., Xie, H. (2019). Extracellular vesicles from human umbilical cord blood ameliorate bone loss in senile osteoporotic mice. Metabolism, 95: 93-101. https://doi.org/10.1016/j.metabol.2019.01.009
[3] Song, D., Li, Y., Zhang, K., Cheng, H., Liu, P., Hu, J. (2016). Micromechanical analysis for microscopic damage initiation in fiber/epoxy composite during interference-fit pin installation. Materials & Design, 89: 36-49. https://doi.org/10.1016/j.matdes.2015.09.118
[4] Pradhan, B., Ramesh Babu, P. (2007). Assessment of beneficial effects of interference-fit in pin-loaded FRP composites. Journal of Reinforced Plastics and Composites, 26(8): 771-788. https://doi.org/10.1177/0731684407076713
[5] Song, D., Li, Y., Zhang, K., Liu, P., Cheng, H., Wu, T. (2015). Stress distribution modeling for interference-fit area of each individual layer around composite laminates joint. Composites Part B: Engineering, 78: 469-479. https://doi.org/10.1016/j.compositesb.2015.04.013
[6] Imran, M., Haneef, M., Zameer, S. (2015). Interference fit simulation on pin joint by using ANSYS. International Journal of Research in Engineering and Technology, 4(5): 579-583. https://doi.org/10.15623/ijret.2015.0405107
[7] Liu, L., Zhang, J., Chen, K., Wang, H. (2014). Combined and interactive effects of interference fit and preloads on composite joints. Chinese Journal of Aeronautics, 27(3): 716-729. https://doi.org/10.1016/j.cja.2014.04.014
[8] Jiang, J., Bi, Y., Dong, H., Ke, Y., Fan, X., Du, K. (2014). Influence of interference fit size on hole deformation and residual stress in hi-lock bolt insertion. Proceedings of the Institution of Mechanical Engineers, Part C: Journal of Mechanical Engineering Science, 228(18): 3296-3305. https://doi.org/10.1177/0954406214531250
[9] Hao, D., Wang, D. (2013). Finite-element modeling of the failure of interference-fit planet carrier and shaft assembly. Engineering Failure Analysis, 33: 184-196. https://doi.org/10.1016/j.engfailanal.2013.04.029
[10] Kim, S.Y., He, B., Shim, C.S. (2013). An experimental and numerical study on the interference-fit pin installation process for cross-ply glass fiber reinforced plastics (GFRP). Composites Part B: Engineering, 54: 153-162. https://doi.org/10.1016/j.compositesb.2013.05.006
[11] Chakherlou, T.N., Taghizadeh, H., Aghdam, A.B. (2013). Experimental and numerical comparison of cold expansion and interference fit methods in improving fatigue life of holed plate in double shear lap joints. Aerospace Science and Technology, 29(1): 351-362. https://doi.org/10.1016/j.ast.2013.04.006
[12] Croccolo, D., De Agostinis, M., Ceschini, L., Morri, A., Marconi, A. (2013). Interference fit effect on improving fatigue life of a holed single plate. Fatigue & Fracture of Engineering Materials & Structures, 36(7): 689-698. https://doi.org/10.1111/ffe.12039
[13] Kiral, B.G. (2010). Effect of the clearance and interference-fit on failure of the pin-loaded composites. Materials & Design, 31(1): 85-93. https://doi.org/10.1016/j.matdes.2009.07.009
[14] Chakherlou, T.N., Mirzajanzadeh, M., Vogwell, J. (2009). Experimental and numerical investigations into the effect of an interference fit on the fatigue life of double shear lap joints. Engineering Failure Analysis, 16(7): 2066-2080. https://doi.org/10.1016/j.engfailanal.2009.01.009
[15] Li, G., Shi, G., Bellinger, N.C. (2007). FE simulation of stresses in hole vicinity induced by interference-fit pin. In 19th Aerospace Structures and Materials Symposium, Canadian Aeronautics and Space Institute, Toronto, Canada.