Noor S. Hussein*![]() | Abdul H. Shukur
| Abdul H. Shukur![]() | Zaid H. Majeed
| Zaid H. Majeed![]()
© 2023 IIETA. This article is published by IIETA and is licensed under the CC BY 4.0 license (http://creativecommons.org/licenses/by/4.0/).
OPEN ACCESS
The effect of pile-cap elevation and skew angles on the local scour brought on by clear-water flow around complex bridge piers was investigated experimentally. The complex Selebat and suspension bridge piers in the Al-Muthana and Al-Basra Governorates, respectively, were replicated using two river models scaled at a ratio of one to fifty. Three different pile-cap altitudes and four different pier skew angles (0, 30, 45, and 60) were varied in the experiment. The results show that the equilibrium depth of scour (ds) is greatly increased by even a little skew angle added to previously aligned piers. Due to its wide-pier characteristic, the column contribution to the scour depth becomes predominate when a pier is located asymmetrically in relation to the flow. Three forms of pier skewness were distinguished: aligned piers (=0°), slightly skewed piers (=30°), and severely skewed piers (45°). The influence of pile-cap and pile group on the scouring action decreased as the skewness increased. Furthermore, equilibrium scour holes often reveal pier components uniformly, independent of the undisturbed bed level, particularly strongly skewed piers with entirely buried pile-caps. This study provides insightful information on the roles of pile-cap height and skew angles in flow-induced scouring, which may help designers and maintenance professionals develop more efficient design and preventative measures.
scour, skewness, complex piers, clear water, pile-cap, pile group
Scour at bridge piers under clear-water conditions can require a significant duration to reach equilibrium, especially when the flow velocity is proximate to the threshold for the initial movement of sediment. This is due to the fact that equilibrium scour depth is determined by equating the work performed by flowing water, as it interacts with the pier under the action of vortices, with the work done by the total volume of sediment particles removed from the scour hole. Equilibrium scour depth is achieved when the scour depth no longer changes over time [1].
Modern bridge construction primarily utilizes complex pier designs that feature a wall-like column supporting the bridge deck and additional superstructures, a pile-cap positioned underneath the column, and a group of piles supporting the pile-cap. This design has been globally adopted in response to hydraulic, structural, and geotechnical challenges. Due to the complexity of the flow field, the scour process and pattern at complex piers are considerably more challenging to manage than at single piles or pile groups [2, 3].
A limited number of studies have been conducted for the computation of local scour depth [4, 5], and a few have analyzed flow patterns around complex bridge pier structures [6-11], predominantly those with circular-shaped piers and pile-caps or rectangular piers with rounded ends [12]. Experiments have been conducted to investigate the three-dimensional turbulent flow field around a rectangular complex bridge pier (with a rectangular pile-cap) installed on a fixed rough bed. In these configurations, all pier components (column, pile-cap, and piles) are exposed to the incoming flow. These investigations have identified key characteristics of flow around the complex pier that dictate the scouring process. The confined flow below the pile-cap and towards the piles, strong downward flow along the edges of the pile-cap in the upstream zone of the pier, and vortex flow behind the pile-cap are the primary causes [13, 14].
Few researchers have undertaken studies investigating scour around complex bridge piers with varying pier structure shapes, flow conditions, and pile-cap elevations [15]. The third reference proposed a methodology for predicting local scour depth at complex piers, aiming to evaluate the relative scouring capabilities of different pier components and the development of scour phenomena across varied pile-cap elevations [16, 17]. Experimental studies were conducted on scour around complex bridge piers of various configurations to determine the effect of pile-cap thickness on the variation of maximum scour depth [18]. Research focusing on the relationship between the depth of scour in complex pier groups, combined pile bridges, and different parameters, such as variations in inflow velocity, distance, and duration, was provided [19]. An experimental evaluation was conducted on three complex bridge pier models (rectangular with rounded ends) under steady-state, clear-water flow conditions. The influence of relative column and pile-cap widths on the equilibrium depth of scour was evaluated when the pile-cap was positioned above the sand bed (Situation 1), partially buried in the sand bed (Situation 2), and fully buried in the sand bed (Situation 3) [20].
The development of methodologies to accurately estimate local scour at bridge piers in cohesive soils is of critical importance. Recently, a site-specific approach known as SRICOS (Scour Rate in Cohesive Soils) was developed to estimate scour-depth-versus-time curves for circular piers supported by clay [21]. SRICOS involves establishing an empirical relationship between the rate of erosion and the applied bed shear stress by collecting soil samples at the bridge pier and analyzing them in an erosion device [22].
Only a handful of studies, those by studies [23, 24], have used clay–sand mixtures for investigating cylinder scouring, with the clay proportion (C) ranging from 0.05 to 0.4 and 0.1 to 0.6, respectively. According to the study [25], as the clay content increased, the maximum scour depth decreased. However, in general, an increase in water content (Wc) extended the maximum equilibrium depth of scour [26]. In similar experimental conditions, the maximum equilibrium depth of scour in cohesive sediments might be less or more than those of non-cohesive particles. Furthermore, the water content of the sediment before the onset of scour was identified as a key factor controlling the position of the deepest scour in cohesive particles [27, 28].
The primary objective of the current research is to examine scour around pile foundations that are skewed and aligned to the direction of flow, under clear-water conditions near the onset of particle movement. This study also aims to investigate the influence of pile-cap height, relative column width, three different situations, varying discharges for various Iraqi soil types, and the number and configuration of piles in a pile group, on the maximum depth of scour at complex pier foundations.
With test observations, an illustration of complex pier for river was created at scale of one to fifty. Produced from wood that was coated to prevent absorption of water, treated for efficiency of production, efficiency of joining parts, efficiency of handle and setup, delivering cost, and low-carbon, sustainable alternative. test purpose was achieved by the treated wood piers through experimental tests for complex bridge piers was compatible with pervious study results. These structures featured cylinder-shaped supported by column pile group and rectangular pile top. Parts' final configuration consists of two alignments of three cylindrical piles. Depicted Figure 1, Complex pier models' longitudinal axes were aligned ($\alpha$ = 0°) and skew-angled ($\alpha$ = 60°, 45°, 30°) with approach flow. Design's geometric properties are explained in Table 1.
Figure 1. (a) Selebat; (b) Suspension: complex bridge pier model
Table 1. Model of Selebat and suspension complex pier dimensions
|
Variable |
Dc |
Lc |
bpc |
Lpc |
T |
fcl |
fcb |
Dpg |
Sm |
Sn |
|
Dimension |
2.5 |
10 |
14 |
23 |
2.5 |
1 |
2.75 |
3 |
6 |
6 |
According to the study [29], in order to eradicate effect of constriction on depth of scour, flume width must minimum ten times pier width, and constant depth of flow must seven centimeters.
3.1 Selebat bridge in Al-Muthana Governorate
Bed material utilized in the studies was a mixture of clay and fine sand (50% clay and 50% sand) with a thickness (20 cm). The sand was taken from the river at a depth of 5-6 m, and sieve analysis was used to determine the particle size distribution. The chosen sand meets the requirements for non-uniform river fine sand with hardness 7, since $\sigma_g$ is more than 1.3. At a depth of 5-6 m, clay was also collected from the river (w. c=24.5, L. L=24, and P. L=15).
3.2 Suspension bridge in Al-Basra Governorate
According to soil studies conducted by Al-Mawal Company for Soil Investigation. Soil collected from Al-Basra River at depth of 5.5-6 m and sieved again before being, soil within test segment is classified sandy loam (medium river sand). Bed material is twenty centimeters thick, and its slope is aligned to top of the channel (S0 = 0).
4.1 Effect of pile-cap position and pier skewness for Selebat
Figure 2. Situation 1, 2, 3: photograph of maximum scour hole for Selebat bridge
The outcomes shown in Table 2, when complex piers are aligned with flow ($\alpha$=0°), scour depth increases when pile-cap is located above initial bed (Hc/T=3). Eventually, as result of pile-lowering cap's elevation, pile-cap cap's reaches undisturbed level and falls below bed level. During this phase, scour depth sharply decreases, and a pile-cap forms as a collar around the piers. In situation 3, there is no indication of scour due to the cohesiveness clay's protective effect on the piers. Figure 2 shows the photograph of Selebat bridge.
Series of laboratory flume experiments were conducted to assess the effect skewness on the scouring of complex piers built on a cohesive bed. Experiments were conducted to determine influence of three different skewness angles ($\alpha$=30°, 45°, and 60°) on the scour hole developed by steady flow. After 24 hours of continuous testing, the dimensions and geometry of the scour holes developed were reported. At a flow velocity close to the initial motion of the sand fraction of the bed material, the scour was studied. 75% of scour depth is formed in first quarter of test time, after that the scour hole depth decreases down to the equilibrium scour depth when the scour depth does not change with time. The purpose is to determine influence of complex pier's skewness angle on local scour in comparison to a complex pier situated parallel to the flow direction. Figure 3 shows the measured scour hole around the complex piers in the flume test.
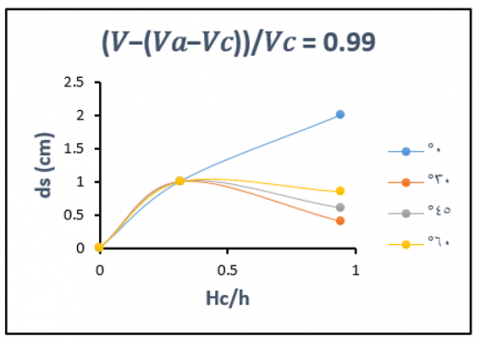
Figure 3. Influence of pile-cap position from initial bed on temporal evaluation of scour depth for Selebat bridge
When 45°, bottom hole of equilibrium scour generally reaches around equal depth under piling cap regardless of location of bed level undisturbed. Indicates pile cap elevation has negligible effect on capacity of hole equilibrium scour to expose when significant skew angle is present.
From Figure 4, in situation 1, the maximum scour hole recorded in the front pier when the piers are parallel to flow direction decreases in ($\alpha$=30°and 45°) and then increases again in ($\alpha$=60°) related to an increase in exposed area to flow. The eroded particle in the rear of the upstream piers and the irregular erosion in the layout of the rear zone of the piers. At each pier, a separate scour hole was constructed. In circumstance 2, maximum scour depth is same regardless of whether complex piers are vertical or skewed due to influence of pile-cap location and thickness. Due to clay content of sediment, there is no scour record for all instances in situation 3, and pile-cap produced broad base to protect the piers from scour.
Figure 4. Changing of equilibrium scour depth relative to bridge skewness angle
Pile-cap elevation and pier skewness have a substantial effect on depth of scour. For aligned piers, scour depth is minimum when bottom of pile-cap is close to bed, and it increases dramatically as the pile-cap level decreases. A small skewness may greatly enhance depth of scour at complex piers under conditions do not cause scour at aligned piers. Sensitivity of depth scour to pier skewness changes oppositely with pile-cap elevation and pier skewness. For highly skewed piers, wide-pier aspect of column becomes prominent, while pile-cap effect tends to decrease.
4.2 Effect of pile-cap position and pier skewness for suspension
Figure 5 shows the photograph of maximum scour depth for suspension bridge.
Figure 5. Situation 1, 2, 3: photograph of maximum scour hole for suspension bridge
Table 2. Overview of experimentally measured model data for Selebat River
|
Run |
$\boldsymbol{\alpha}^{\circ}$ |
Q (l/s) |
V (m/s) |
Vc (m/s) |
Va (m/s) |
$\frac{V-(V a-V c)}{V c}$ |
Hc/h |
ds (cm) |
Rp |
F |
|
1 |
0 |
12.4 |
0.177 |
0.295 |
0.236 |
0.80 |
1.1 |
0.9 |
5310 |
0.214 |
|
2 |
0 |
14.5 |
0.207 |
0.295 |
0.236 |
0.90 |
1.1 |
1.5 |
6210 |
0.250 |
|
3 |
0 |
16.3 |
0.233 |
0.295 |
0.236 |
0.99 |
1.1 |
2.0 |
6990 |
0.281 |
|
4 |
30 |
16.3 |
0.233 |
0.295 |
0.236 |
0.99 |
1.1 |
0.4 |
6990 |
0.281 |
|
5 |
45 |
16.3 |
0.233 |
0.295 |
0.236 |
0.99 |
1.1 |
0.6 |
6990 |
0.281 |
|
6 |
60 |
16.3 |
0.233 |
0.295 |
0.236 |
0.99 |
1.1 |
0.85 |
6990 |
0.281 |
|
7 |
0 |
12.4 |
0.177 |
0.295 |
0.236 |
0.80 |
0.36 |
0.5 |
5310 |
0.214 |
|
8 |
0 |
14.5 |
0.207 |
0.295 |
0.236 |
0.90 |
0.36 |
0.7 |
6210 |
0.250 |
|
9 |
0 |
16.3 |
0.233 |
0.295 |
0.236 |
0.99 |
0.36 |
1.0 |
6990 |
0.281 |
|
10 |
30 |
16.3 |
0.233 |
0.295 |
0.236 |
0.99 |
0.36 |
1.0 |
6990 |
0.281 |
|
11 |
45 |
16.3 |
0.233 |
0.295 |
0.236 |
0.99 |
0.36 |
1.0 |
6990 |
0.281 |
|
12 |
60 |
16.3 |
0.233 |
0.295 |
0.236 |
0.99 |
0.36 |
1.0 |
6990 |
0.281 |
|
13 |
0 |
12.4 |
0.177 |
0.295 |
0.236 |
0.80 |
0 |
0.0 |
5310 |
0.214 |
|
14 |
0 |
14.5 |
0.207 |
0.295 |
0.236 |
0.90 |
0 |
0.0 |
6210 |
0.250 |
|
15 |
0 |
16.3 |
0.233 |
0.295 |
0.236 |
0.99 |
0 |
0.0 |
6990 |
0.281 |
|
16 |
30 |
16.3 |
0.233 |
0.295 |
0.236 |
0.99 |
0 |
0.0 |
6990 |
0.281 |
|
17 |
45 |
16.3 |
0.233 |
0.295 |
0.236 |
0.99 |
0 |
0.0 |
6990 |
0.281 |
|
18 |
60 |
16.3 |
0.233 |
0.295 |
0.236 |
0.99 |
0 |
0.0 |
6990 |
0.281 |
Table 3. Overview of experimentally measured model data for Suspension River
|
Run |
$\boldsymbol{\alpha}^{\circ}$ |
Q (l/s) |
V (m/s) |
Vc (m/s) |
V/Vc |
Hc/h |
ds (cm) |
Rp |
F |
|
1 |
0 |
10.8 |
0.154 |
0.192 |
0.80 |
1.1 |
1.0 |
4620 |
0.186 |
|
2 |
0 |
12.0 |
0.173 |
0.192 |
0.90 |
1.1 |
1.5 |
5190 |
0.209 |
|
3 |
0 |
13.3 |
0.190 |
0.192 |
0.99 |
1.1 |
2.0 |
5700 |
0.229 |
|
4 |
30 |
13.3 |
0.190 |
0.192 |
0.99 |
1.1 |
3.0 |
5700 |
0.229 |
|
5 |
45 |
13.3 |
0.190 |
0.192 |
0.99 |
1.1 |
4.0 |
5700 |
0.229 |
|
6 |
60 |
13.3 |
0.190 |
0.192 |
0.99 |
1.1 |
5.0 |
5700 |
0.229 |
|
7 |
0 |
10.8 |
0.154 |
0.192 |
0.80 |
0.36 |
0.2 |
4620 |
0.186 |
|
8 |
0 |
12.0 |
0.173 |
0.192 |
0.90 |
0.36 |
0.3 |
5190 |
0.209 |
|
9 |
0 |
13.3 |
0.190 |
0.192 |
0.99 |
0.36 |
0.5 |
5700 |
0.229 |
|
10 |
30 |
13.3 |
0.190 |
0.192 |
0.99 |
0.36 |
0.6 |
5700 |
0.229 |
|
11 |
45 |
13.3 |
0.190 |
0.192 |
0.99 |
0.36 |
0.75 |
5700 |
0.229 |
|
12 |
60 |
13.3 |
0.190 |
0.192 |
0.99 |
0.36 |
0.5 |
5700 |
0.229 |
|
13 |
0 |
10.8 |
0.154 |
0.192 |
0.80 |
0 |
0.6 |
4620 |
0.186 |
|
14 |
0 |
12.0 |
0.173 |
0.192 |
0.90 |
0 |
0.8 |
5190 |
0.209 |
|
15 |
0 |
13.3 |
0.190 |
0.192 |
0.99 |
0 |
1.3 |
5700 |
0.229 |
|
16 |
30 |
13.3 |
0.190 |
0.192 |
0.99 |
0 |
2.0 |
5700 |
0.229 |
|
17 |
45 |
13.3 |
0.190 |
0.192 |
0.99 |
0 |
2.7 |
5700 |
0.229 |
|
18 |
60 |
13.3 |
0.190 |
0.192 |
0.99 |
0 |
1.0 |
5700 |
0.229 |
Figure 6. Influence of pile-cap position from initial bed on temporal evaluation of scour depth for suspension bridge
In Figure 6, values of ds are determined by plotting Hc/h for three described models. In general, ds variation with Hc/h for three models is comparable. As demonstrated in Figure 6, increase in ds values associated with each model is proportional to equivalent reduction of pile-cap front.
For Situation 1, when pile cap and column are out of water, model suggests improve in ds with improving skewness, as seen in figure above. In this case, the scour process begins in front of each of the upstream piles with separate openings, which eventually form into a single hole; the greatest depth for scour can be found in front of the upstream piles of the group, increase with skew-angle increasing. This improve is justified by exposed frontal region for flow. In Situation 2, when pile cap is placed close to original bed, scour follows same trend of increasing with skewness, except when ($\alpha$=60°). This behavior is primarily attributable to influence of pile-cap overflow length on flow structure surrounding column above pile cap. Length of pile-cap overhang is sufficient to deflect down-flow down column and weaken horseshoe vortex to affect and disrupt scouring process.
In Situation 3, the skewed complex piers with deeply buried pile-cap, column's obstruction to flow, which is proportional to pier skew angle, is crucial, since the column will produce the majority of scour-inducing flow features (e.g., down-flow at column face and flow contraction at both flanks). the equilibrium scour depth behavior is comparable to that determined by studies [30, 31] for cylindrical piers supported by cylindrical caissons. The ds decrease caused by the action of pile cap overhanging column, which becomes active once top of this element is reached and interferes with scour hole development process (by physical blockage on hole and by reduced flow structure caused by column while constrained by nearby sand bed.). As demonstrated Figure 7, the maximum scour depth increases with increasing skewness except when ($\alpha$=60°). This increase is justified by exposed frontal region to flow, as shown in Table 3 above.
Maximum depth scour shows at leading end of skewed complex piers, either beneath pile-leading cap's edge or at first row of piles. For aligned complex piers, scour begins at both lateral corners, and maximum depth of scour occurs at upstream end of downstream side of pier. As column significantly contributes to flow obstruction and resulting down-flow, pier's components are often exposed to incoming asymmetrical flow.
Figure 7. Changing of equilibrium scour depth relative to bridge skewness angle
When complex pier is aligned with flow, deepest depth of scour happens when pile cap is above initial bed level (100%) compared to when pile cap is immersed to bed level (35%) for Selebat and suspension bridges. This is comparable to findings from prior investigations. Protection influence of pile cap reduces depth of scour considerably following appearance of optimum value as pile cap position increases in front of pier by disrupting down-flow.
Depth of scour equilibrium of asymmetrical complex piers is considerably greater than that of aligned piers. Increase in depth of scour is corresponding to skew angle, with values of (29.4%, 33.3%, and 80%) for (60°, 45°, 30°, and 0°) for Selebat, and (20%, 25%, and 33%) for Suspension. Vulnerability of scour generation to pier skew angle develops as pile-cap elevation rises, especially if it is entirely above initial bed with pile-cap height that is entirely above original bed with increases of 100%, 100%, and 100% for (30°, 45°, and 60°) repeatedly compared to pile-cap fully buried to bed level for Selebat and (33.3%, 32.5%, and 80%) for suspension bridge.
This research presents new knowledge on pier scour in clay–sand mixes, offers new knowledge into scouring procedure in clay–sand mixtures. Influence of clay- and water-content on deepest equilibrium depth of scour depth, equilibrium scour hole form, scouring process, and temporal variance of scour was studied. In previous studies of local scour around cylinders in cohesive beds, diverse observations were made, including: (a) maximum equilibrium depth of scour in cohesive beds was comparable to that of sand; (b) deepest equilibrium depth of scour in cohesive beds was lesser or as well as greater than of sand; and (c) deepest equilibrium depth of scour reduced with developing in cohesive material content.
|
$\alpha$ |
Complex pier alignment angle |
|
$\mathrm{D}_{\mathrm{c}}$ |
Column diameter |
|
$\mathrm{L}_{\mathrm{c}}$ |
Column length |
|
$\mathrm{b}_{\mathrm{pc}}$ |
Pile-cap width |
|
$\mathrm{L}_{\mathrm{pc}}$ |
Pile-cap length |
|
T |
Pile-cap thickness |
|
$\mathrm{f}_{\mathrm{cl}}$ |
Longitudinal extension length of pile cap face out from the nearest pile front face |
|
$\mathrm{f}_{\mathrm{cb}}$ |
Extension length of pile cap face out from column face |
|
$\mathrm{b}_{\mathrm{pg}}$ |
Pile group diameter |
|
$\mathrm{S}_{\mathrm{m}}$ |
Pile spacing in the direction m |
|
$\mathrm{S}_{\mathrm{n}}$ |
Pile spacing in the direction n |
|
Q |
Flow discharge |
|
$\mathrm{H}_{\mathrm{c}}$ |
Column position (distance from initial bed level to bottom surface of column) |
|
h |
Approach flow depth |
|
$\mathrm{d}_{\mathrm{s}}$ |
Scour depth |
|
V |
Mean flow velocity |
|
$\mathrm{V}_{\mathrm{c}}$ |
Critical velocity |
|
$\mathrm{V}_{\mathrm{a}}$ |
Armor Peak Velocity |
|
$\mathrm{R}_{\mathrm{p}}$ |
Pier Reynold number |
|
F |
Froude number |
[1] Yang, Y.F., Melville, B.W., Macky, G.H., Shamseldin, A.Y. (2020), Temporal evolution of clear-water local scour at aligned and skewed complex bridge piers. Journal of Hydraulic Engineering, 146(4). https://doi.org/10.1061/(ASCE)HY.1943-7900.0001732
[2] Ettema, R., Constantinescu, G., Melville, B. (2017). Flow-field complexity and design estimation of pier-scour depth: Sixty years since Laursen and Toch. Journal of Hydraulic Engineering, 143(9). https://doi.org/10.1061/(ASCE)HY.1943-7900.000133
[3] Yang, Y.F., Melville, B.W., Macky, G.H., Shamseldin, A.Y. (2020). Experimental study on local scour at complex bridge pier under combined waves and current. Coastal Engineering, 160: 103730. https://doi.org/10.1016/j.coastaleng.2020.103730
[4] Melville, B.W., Coleman, S.E., Priestley, S. (2006). Local scour at complex piers. World Environmental and Water Resource Congress, ASCE. https://doi.org/10.1061/40856(200)176
[5] Akib, S., Jahangirzadeh, A., Basser, H. (2014). Local scour around complex pier groups and combined piles at semi-integral bridge. Journal of Hydrology and Hydromechanics, 62(2): 108-116. https://doi.org/10.2478/johh-2014-0015
[6] Beheshti, A.A., Ataie-Ashtiani, B. (2010). Experimental study of three-dimensional flow field around a complex bridge pier. Journal of Engineering Mechanics, 136(2). https://doi.org/10.1061/ASCEEM.1943-7889.0000073
[7] Beheshti, A.A., Ataie-Ashtiani, B. (2016). Scour hole in-fluence on turbulent flow field around complex bridge piers. Flow Turbulence Combust. Flow, Turbulence and Combustion, 97: 451-474. https://doi.org/10.1007/s10494-016-9707-8
[8] Baghbadorani, D.A., Ataie-Ashtiani, B., Beheshti, A., Hadjzaman, M., Jamali, M. (2018). Prediction of current-induced local scour around complex piers: Review, revisit, and integration. Coastal Engineering, 133: 43-58. https://doi.org/10.1016/j.coastaleng.2017.12.006
[9] Yang, Y.F., Melville, B.W., Sheppard, D.M., Shamseldin, A.Y. (2018). Clear-water local scour at skewed complex bridge piers. Journal of Hydraulic Engineering, 144(6). https://doi.org/10.1061/(ASCE)HY.1943-7900.0001458
[10] Gautam, P., Eldho, T.I., Mazumder, B.S., Behera, M.R. (2019). Experimental study of flow and turbulence characteristics around simple and complex piers using PIV. Experimental Thermal and Fluid Science, 100: 193-206. https://doi.org/10.1016/j.expthermflusci.2018.09.010
[11] Alemi, M., Pêgo, J.P., Maia, R. (2019). Numerical simulation of the turbulent flow around a complex bridge pier on the scoured bed. European Journal of Mechanics-B/Fluids, 76: 316-331. https://doi.org/10.1016/j.euromechflu.2019.03.011
[12] Sousa, A.M., Ribeiro, T.P. (2019). Local scour at complex bridge piers - experimental validation of current prediction methods. ISH Journal of Hydraulic Engineering, 27: 286-293. https://doi.org/10.1080/09715010.2019.1639223
[13] Yang, Y.F., Melville, B.W., Macky, G.H., Shamseldin, A.Y. (2019). Local scour at complex bridge piers in close proximity under clear-water and live-bed flow regime. Water, 11(8): 1530. https://doi.org/10.3390/w11081530
[14] Yang, Y.F., Melville, B.W. Shamseldin, A.Y., Friedrich, H. (2017). Effect of skewness on clear-water scour at complex bridge piers. Proceedings of the 37th IAHR World Congress, Kuala Lumpur, Malaysia.
[15] Ferraro, D., Tafarojnoruz, A., Gaudio, R., Cardoso, A.H. (2013). Effects of pile cap thickness on the maximum scour depth at a complex pier. Journal of Hydraulic Engineering, 139(5). https://doi.org/10.1061/(ASCE)HY.1943-7900.0000704
[16] Ahmed, N., Melville, B., Mohammad, T., Ali, F., Yusuf, B. (2016). Clear-water scour at long skewed bridge piers. Journal of the Chinese Institute of Engineers, 40(1): 10-18. https://doi.org/10.1080/02533839.2016.1259021
[17] Castiblanco, M. (2016). Experimental study of local scour around complex bridge piers. Thesis Submitted for the Fulfilment of the Requirements for the Degree of Doctoral Program in Civil Engineering.
[18] Devi, Y.S., Barbhuiya, A.K. (2017). Bridge pier scour in cohesive soil: A review. Sādhanā, 42(10): 1803-1819. https://doi.org/10.1007/s12046-017-0698-5
[19] Badal, M., John, S., Angelica, S., Jon, Z. (2021). Scour hole development in natural cohesive bed sediment around cylinder-shaped piers subjected to varying sequential flow events. Water, 13: 3289. https://doi.org/10.3390/w13223289
[20] Moreno, M., Maia, R., Couto, L. (2015). Effects of relative column width and pile-cap elevation on local scour depth around complex piers. Journal of Hydraulic Engineering, 142(2). https://doi.org/10.1061/(ASCE)HY.1943-7900.0001080
[21] Briaud, J.L., Ting, F.C.K., Chen, H.C., Gudavalli, R., Perugu, S., Wei, G. (1999). SRICOS: Prediction of scour rate in cohesive soils at bridge piers. Journal of Geotechnical and Geoenvironmental Engineering, 125(4): 237-246. https://doi.org/10.1061/(ASCE)1090-0241(1999)125:4(237)
[22] Haoyin, S., Jerry, S., Roger, K., Kornel, K. (2015). Scour in Cohesive Soils. Federal Highway Administration, 6300 Georgetown Pike. McLean, VA, 22101-2296.
[23] John, S., Angel, M. (2018). Evaluation and prediction of bridge pier and contraction scour of cohesive river sediments in Tennessee. University of Tennessee, Neyland Drive, Knoxville, Tennessee, 37996.
[24] Ting, F.C.K., Briaud, J.L., Chen, H.C., Gudavalli, R., Perugu, S., Wei, G. (2001). Flume tests for scour in clay at circular piers. Journal of Hydraulic Engineering, 127(11). https://doi.org/10.1061/(ASCE)0733-9429(2001)127:11(969)
[25] Najafzadeh, M., Barani, G. (2014). Experimental study of local scour around a vertical pier in cohesive soils. Transactions on Civil Engineering (A), 21(2): 241-250.
[26] Molinas, A., Hosny, M.M., (1999). Experimental study on scour around circular piers in cohesive soil. Proceedings 2nd International Conference on Scour and Erosion (ICSE-2), Singapore, Singapore: Nanyang Technological University.
[27] Ansari, S.A., Kothyari, U.C., Ranga Raju, K.G. (2002). Influence of cohesion on scour around bridge piers. Journal of Hydraulic Research, 40(6): 717-729. https://doi.org/10.1080/00221680209499918
[28] Debnath, K., Chaudhuri, S. (2010). Laboratory experiments on local scour around cylinder for clay and clay-sand mixed beds. Engineering Geology, 111(1-4): 51-61. http://doi.org/10.1016/j.enggeo.2009.12.003
[29] Melville, B.W., Coleman, S.E. (2000). Bridge Scour. Water Resources Publications, LLC, Colorado, U.S.A.
[30] Melville, B.W., Raudkivi, A.J. (1996). Effect of foundation geometry on bridge pier scour. Journal of Hydraulic Engineering, 122(4): 203-209. https://doi.org/10.1061/(ASCE)0733-9429(1996)122:4(203)
[31] Umeda, S., Yamazaki, T., Yuhi, M. (2010). An experimental study of scour process and sediment transport around a bridge pier with foundation. Proceedings of International Conference on Scour and Erosion, pp. 66-75. https://hdl.handle.net/20.500.11970/100211.