Mohammed Gollapalli![]() | Atta-ur Rahman*
| Atta-ur Rahman*![]() | Mustafa Youldash
| Mustafa Youldash![]() | Dorieh Alomari
| Dorieh Alomari![]() | Shatha Alismail
| Shatha Alismail![]() | Fatimah Khawaher
| Fatimah Khawaher![]() | Aljawharah Alkhadair
| Aljawharah Alkhadair![]() | Fatimah Aljubran
| Fatimah Aljubran![]() | Razan Alzannan
| Razan Alzannan![]() | Dania Alkhulaifi
| Dania Alkhulaifi![]() | Maqsood Mahmud
| Maqsood Mahmud![]()
© 2023 IIETA. This article is published by IIETA and is licensed under the CC BY 4.0 license (http://creativecommons.org/licenses/by/4.0/).
OPEN ACCESS
The accurate prediction of demographic attributes of users, including age and gender, is a pivotal challenge in personalized search, ad targeting, and other related fields. This information enables companies to refine their target audience and enhance the overall user experience and quality of service (QoS). Among these, the Saudi Telecommunication Company (STC), a premier telecommunications provider in Saudi Arabia, Middle East, and Africa, recognizes the substantial role of age-prediction systems. This study, therefore, explores the application of machine learning (ML) techniques to predict user age, thus assisting in the delivery of age-appropriate ads and offers. We utilized a dataset provided by STC, comprising three million samples with key user and device features. Four ML algorithms were employed in this analysis: the Artificial Neural Network (ANN), Random Forest (RF), Gradient Boosting (GB), and Decision Tree (DT). These models were compared and evaluated based on their predictive performance. The ANN emerged as the optimal classifier, achieving an accuracy of 60%, comparable to similar studies conducted within the telecommunications industry. The implications of these findings suggest that ML techniques can effectively predict user information, thereby enabling service providers to tailor their offerings to the specific age demographics of their users. The findings from this study contribute to the broader understanding of user age prediction and its practical implications for telecommunications companies. Future research could extend this work by exploring other demographic prediction challenges and applying the ML approach to other sectors.
machine learning, Saudi Telecommunication Company, age prediction, smart devices, quality of service
In the present digital era, telecommunication companies play an instrumental role in ensuring smooth and efficient user experience. These companies have revolutionized information access, automated fundamental operations, and negated the necessity for centralized offices, thereby connecting businesses globally [1]. Among these, the Saudi Telecommunication Company (STC) emerges as a prominent player, providing a comprehensive range of services, including data, Internet, and telephone services [2].
Concurrently, the digital landscape provides innovative marketing and advertising avenues such as online advertising and social network marketing, which significantly contribute to business revenue generation and customer service expansion [3]. Consequently, marketers are continually seeking novel strategies to effectively reach their target audience. In the context of telecommunication services, understanding the age and preferences of users could be instrumental in delivering age-appropriate advertisements [4].
The primary objective of this study is to develop a system capable of determining the users' age. A substantial dataset provided by STC forms the foundation for this system, which, once operational, could enable STC to deliver age-specific advertisements, thereby optimizing their resources for the most relevant user group [5].
Artificial Intelligence (AI) and Machine Learning (ML) systems have become indispensable for businesses, with ML analyzing past behavior data and interpreting them using various algorithms [6]. ML enhances business operations and scalability, ensuring an excellent customer experience [7]. Specifically, telecommunication companies have begun incorporating ML and AI techniques to improve their services. These techniques enable the analysis of substantial customer data and aid in the development of superior user services. Further, ML facilitates reaching the appropriate user demographic with tailored advertisements [8].
Several studies have employed ML models for age prediction with varying degrees of success. For instance, Abu Nada et al. [9] utilized a Convolutional Neural Network (CNN) to predict users' age and gender, achieving 82% accuracy for gender prediction and 57% for age prediction. Similarly, Hassan et al. [10] proposed a CNN model for age prediction from shoe prints, which recorded an impressive accuracy of 86.07% but a considerable error of 40.23% for the prediction of five-year-old individuals. Kim et al. [11] proposed two CNN models using ResNet-152 and DenseNet-169 for age and gender prediction from paranasal sinus images, with the second model achieving a higher accuracy of 77.6 ± 1.5% for age prediction. Nemati et al. [12] proposed an ensemble model using four ML algorithms for gender and age prediction, achieving an accuracy of 60% for age prediction and 83% for gender prediction. Asogwa and Anigbogu [13] developed a ML model for predicting author's age from text using the Naïve Bayes algorithm, attaining a prediction accuracy of 80%.
These studies underscore the potential and challenges of employing ML techniques for age prediction, providing a foundation for this study's endeavor to develop an effective ML-based age prediction system for telecommunication users.
This research is primarily focused on the application of Machine Learning (ML) algorithms for the prediction of users' age. The impetus for this study stems from the company's aim to enhance user experience by appropriately tailoring their services according to the user's age. The multinational population residing in the Kingdom of Saudi Arabia (KSA) provides a diverse demographic wherein age-specific service offerings could significantly improve the quality of service provided. Furthermore, literature research suggests that ML classifiers show promising results in similar age-prediction studies.
Therefore, this study aims to employ and assess the performance of four ML classifiers: Gradient Boosting, Naïve Bayes, Multi-Layer Perceptron, and Logistic Regression. The ultimate goal is to identify the model that provides the highest accuracy using different performance metrics. By predicting user's age, the company could offer more personalized services to its users.
The dataset provided for this study includes several key features and a large number of samples, which will assist in developing a robust ML model for predicting the users' age.
The remainder of the paper is structured as follows: Section 2 presents a review of related work. In Section 3, the preprocessing of the dataset is discussed. Section 4 details the materials and methods employed in the study. Sections 5, 6, and 7 outline the experimental setup, present the results and discussion, and compare this study with previous works, respectively. Finally, Section 8 concludes the paper.
In a study conducted by Abu Nada et al. [9], a Convolutional Neural Network (CNN) model was developed to predict user gender and age using a single image. The model linked birth information with the user's image for prediction. The dataset, comprising 430 students aged between 20 and 55, was used to train the model. The primary objective was to provide a double-check layer for entered data by comparing it with the user's image. The model was implemented using web services and evaluated with university students' images. Although the model achieved 82% accuracy in predicting gender, it struggled with age prediction, achieving only 57% accuracy, which remains a significant limitation.
Conversely, Hassan et al. [10] proposed a deep learning model to predict human ages using shoeprints. The rationale behind using shoeprints for age prediction is the influence of environmental and physical changes on human gait patterns. The researchers created a dataset containing 100,000 shoeprints from individuals aged between 7 and 80 years, which was fed into the model. The dataset was divided into three sets, with 47,591 used for training, 10% of the training set for validation, and 3,000 for testing. The researchers used a skip mechanism to combine multiple CNN models for age estimation. The model achieved 86.07% prediction accuracy. However, it had a high error rate of 40.23% when predicting the age of five-year-olds.
Kim et al. [11] utilized Para-nasal sinus images to propose a deep learning model for predicting people's ages and gender. The ages were categorized into three intervals: 20-39, 40-59, and 60+ years. The dataset comprised 4,160 Para-nasal sinus X-ray images from 4,160 patients. The data was divided into training (80%), validation (10%), and test (10%) sets. Two CNN models were developed to predict people's ages and gender using special features from the X-ray images. The first model, adopting the ResNet-152 architecture, outperformed the second model in gender prediction, achieving 98.0% accuracy. The second model, based on the DenseNet-169 architecture, surpassed the first model in age prediction, achieving an accuracy of 77.6±1.5%.
Nemati et al. [12] proposed a machine learning model to predict age and gender based on text documents. The aim was to estimate multilingual profile attributes from the text. The dataset, divided into training (80%) and testing (20%) sets, consisted of gender and age data. The ages were grouped into three categories: 15-19, 20-24, and 25-xx. The researchers proposed an ensemble model comprising four machine learning models: Gradient Boosting Classifier, Multi-Layer Perceptron classifier, Multinomial Naive Bayes classifier, and Logistic Regression CV classifier. The model achieved 83% accuracy in gender prediction, 60% in age prediction, and 49% in predicting both.
Asogwa et al. [13] proposed a machine learning model to estimate an author's age based on their written text. The objective was to understand political and social opinions of different age groups and assist marketers in promoting products tailored to these groups. The dataset, divided into training (90%) and testing (10%) sets, included 100 samples. The researchers proposed using Naïve Bayes to predict the author's age. The model, developed using Java language and Weka program, used topic-based, content-based, and style-based features. The model achieved 80% accuracy in predicting the author's age based on their written text.
Dash et al. [14] proposed a user behavior prediction approach based on a neuro-fuzzy approach. The dataset, collected on a proxy server, consisted of user machine, network, and web usage logs. The approach combined a fuzzy rule-based system (FRBS) [15-20] and Gaussian Radial basis Function Neural Network (GRBF-NN) [21-25] in the neuro-fuzzy model, which showed promising prediction and classification accuracy.
Summarizing the literature review, it becomes clear that machine learning has been extensively used in predicting user traits such as age, gender, and behavior. This is an emerging research area in service industries aiming to improve their offerings. The current study, based in the Kingdom of Saudi Arabia, is the first of its kind, leveraging a rich and innovative dataset provided by STC [26-33].
In this section, details about the dataset used are presented as well as some necessary pre-processing techniques that need to be applied to the data set.
3.1 Data description
Table 1. Features description
|
Feature |
Description |
|
CAL_DTTable size |
Date of customer call, numerical data type. |
|
MODEL_NAME |
Name of the model (such as 150 Dual SIM), categorical data type. |
|
BRAND_FULL_NAME |
Full name of device brand (such as Nokia 150 Dual SIM), categorical data type. |
|
BRAND_NAME |
Short name of device brand (such as Nokia), categorical data type. |
|
VENDOR_NAME |
The name of the company that supplied the device (such as Nokia), categorical data type. |
|
OS_NAME |
Operating system name (such as Android), categorical data type. |
|
DEVICE_TYPE |
Type of device (such as Smartphone or Mobile Phone), categorical data type. |
|
_2G_FLG |
The second-generation network from STC (such as is there or not), categorical data type. |
|
_3G_FLG |
The third-generation network from STC (such as is there or not), categorical data type. |
|
_4G_FLG |
The fourth-generation network from STC (such as is there or not), categorical data type. |
|
WIFI_FLG |
Wireless Fidelity (such as is it there or not), categorical data type. |
|
BLUETOOTH_FLG |
Bluetooth feature (such as is it there or no), categorical data type. |
|
TOUCH_SCREEN_FLG |
Type of devise screen (such as is it touch or not), categorical data type. |
|
DUAL_SIM_FLG |
A feature that enables the customer to use two SIM cards in the device at the same time (such as is it touch or not), categorical data type. |
|
GENDER_TYPE_CD |
Gender of customer, categorical data type. |
|
NATIONALITY_CD |
Code of customer Nationality (such as SAU), categorical data type. |
|
NATIONALITY_NAE |
Name of customer (such as Saudi), categorical data type. |
|
SAUDI_NON_SAUDI |
Customer Nationality (such as yes or no), categorical data type. |
|
DEVICE_COUNT |
Number of devices, numerical data type. |
The study includes data obtained from STC, resulting from an initiative launched under "STC Open Data". The initiative aimed to prepare a technologically aware Saudi generation in line with Vision 2030 through supporting researchers, students, and universities interested in data science. The data used in this study describes the customers' use of uncommon handset devices. The period during which customers' data was collected for STC in Saudi Arabia ranged from 2018 until 2020.The dataset contains over three million rows, 19 features, and one target class called "Age_B" and the possible labels within it are "<18", "18-25", "26-35", "36-55", and ">55" [34]. Table 1 shows a description of each feature:
3.2 Pre-processing techniques
Data quality is considered an essential factor for the success of building machine learning models, as the training phase needs reliable data free of annoying or duplicate values. Data pre-processing acts as a data purifier filter by applying several techniques, including data cleaning, features normalization, and extraction [35]. Table 2 enlists features with missing values.
Table 2. Count of missing values
|
Feature |
Missing Values |
|
CAL_DTTable size |
0 |
|
MODEL_NAME |
0 |
|
BRAND_FULL_NAME |
1 |
|
BRAND_NAME |
1 |
|
VENDOR_NAME |
1 |
|
OS_NAME |
1 |
|
DEVICE_TYPE |
1 |
|
_2G_FLG |
1 |
|
_3G_FLG |
1 |
|
_4G_FLG |
1 |
|
WIFI_FLG |
30126 |
|
BLUETOOTH_FLG |
4898 |
|
TOUCH_SCREEN_FLG |
9601 |
|
DUAL_SIM_FLG |
4326 |
|
GENDER_TYPE_CD |
202327 |
|
NATIONALITY_CD |
202204 |
|
NATIONALITY_NAE |
202202 |
|
SAUDI_NON_SAUDI |
1 |
|
DEVICE_COUNT |
1 |
3.2.1 Data cleaning
Data cleaning is considered an essential step in preprocessing of machine learning as it deals with missing values and errors in the data set. There are two techniques for dealing with missing values, either by "imputing the missing values" or "Discarding the Missing Values". In this study, one of the types of discarding the missing values technique was applied, "List-wise deletion," which works to delete any row containing a missing value. All missing or unknown values within each column in the data set were removed except for the target class column data [36]. The rows containing unknown values within the target class were transferred to a new set for use in the testing and evaluation phase as a test set. The amount of dataset after the deletion process is 214,730 rows. The table below shows the count of missing values for each feature in the dataset before processing.
Dropping duplication samples. The data used is rows containing the data of customers subscribed to the telephone services provided by STC. Every time a customer made a new phone call through his device, this customer's data was stored in the dataset inside a new row. However, having multiple rows with the same data about one customer is redundant, so duplicated rows have been removed to ensure the quality of data and obtain high predictive accuracy. The number of records in the data set after deletion is 283,278.
3.2.2 Data transformation
Data transformation makes the data homogeneous, organized, and easy to analyze. Normalization and discretization techniques used in this study [37].
Data normalization. Data normalization improves model performance in addition to making its predictive accuracy high. Data normalization is also known as min-max scale or min-max normalization. Also, data normalization restructures the scaling range of the feature and makes it within the range [0, 1] [38]. In this study, feature scaling was performed using data normalization on the only numeric feature present in the dataset called "DEVICE_COUNT" using the formula:
$x^{\prime}=\frac{x-\min }{(x) \max (x)-\min (x)}$ (1)
In the equation, max(x) and min(x) represent the maximum and minimum values of the feature respectively [38].
Data Discretization. The process of converting continuous data into a set of small data periods. This technique is also called the "data reduction mechanism" because it converts a large dataset into categorical data [39]. This technique was applied to the target class by reducing the number of class labels from five to three. The data was classified among the three labels as follows:
The data in ">18" is categorized for a label called "Young".
The data in "<55" is categorized for a label called "Old".
The rest of the data is categorized for a label called "Adult".
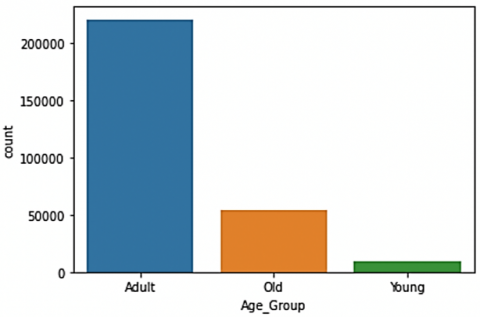
Figure 1 and Figure 2 show the number of samples in each label in the target class before and after applying the discretization technique, respectively. As an outcome, it is apparent that before discretization, there are more buckets of the data in terms of age group while after discretization, data has been distributed to relatively a smaller number of age groups. Table 3 contains the selected features list.
Figure 1. Target class distribution before discretization technique
Figure 2. Target class distribution after discretization technique
Table 3. Features after the feature selection
|
Feature |
Description |
|
BRAND_NAME |
Short name of device brand (such as Nokia), categorical data type. |
|
VENDOR_NAME |
The name of the company that supplied the device (such as Nokia), categorical data type. |
|
OS_NAME |
Operating system name (such as Android), categorical data type. |
|
DEVICE_TYPE |
Type of device (such as Smartphone or Mobile Phone), categorical data type. |
|
_2G_FLG |
The second-generation network from STC (such as is there or not), categorical data type. |
|
_3G_FLG |
The second-generation network from STC (such as is there or not), categorical data type. |
|
_4G_FLG |
The second-generation network from STC (such as is there or not), categorical data type. |
|
WIFI_FLG |
Wireless Fidelity (such as is it there or not), categorical data type. |
|
BLUETOOTH_FLG |
Bluetooth feature (such as is it there or no), categorical data type. |
|
TOUCH_SCREEN_FLG |
Type of devise screen (such as is it touch or not), categorical data type. |
|
DUAL_SIM_FLG |
A feature that enables the customer to use two SIM cards in the device at the same time (such as is it touch or not), categorical data type. |
|
GENDER_TYPE_CD |
Gender of customer Nationality (such as female), categorical data type. |
|
NATIONALITY_NAE |
Name of customer Nationality (such as Saudi), categorical data type. |
|
SAUDI_NON_SAUDI |
Customer Nationality (such as yes or no), categorical data type. |
|
DEVICE_COUNT |
Number of devices, numerical data type. |
3.2.3 Dimensionality reduction
Dimensionality reduction is a technique implemented to improve the accuracy of classifiers [40]. In this study, feature selection was applied, which removes redundant features to reduce the dimensions of the data set by calculating the importance of each feature and its relationship to the target label and only retains the key features with high relation [41]. For the data set in this study, features that have recurring content and are like another feature content within the data set were excluded. For example, the feature content "NATIONALITY_CD" is considered an abbreviation for the feature content "NATIONALITY_NAME", so it is considered a redundant feature. The features that have been removed are "CAL_DT", "MODEL_NAME", "BRAND_FULL_NAME", and "NATIONALITY_CD". The number of features within the data set after the feature selection process has become 15, and the table shows all the remaining features.
3.2.4 Labels binarizing
Label Binarizer is a transformation method that takes categorical data as input and converts it into a Numpy array. It encodes the data into dummy variables that indicate whether a particular label exists or not [41]. This method was performed on all the features whose data type is categorical in the dataset to convert them into numeric data that ML algorithms can deal with them.
3.2.5 Data balancing
A balanced dataset is a set in which the data of each target class has the same number of samples. The most popular techniques for balancing data are oversampling and under sampling [42]. A balancing method was used to make the number of samples in the data of each label in the target class equal to the number of samples in the "Adult" label (containing 220210 samples), as this process is called the "oversampling technique". Figure 3and Figure 4 show the number of samples in each label in the target class before and after applying the balancing method. It is apparent that the data after balancing provides approximately equal number of samples in each class. That potentially can lead to a fairer model building where each class is equally contributing to the model.
Figure 3. Target class distribution before balancing
Figure 4. Target class distribution after balancing
This section includes the experimental design, tools, and techniques used in this study. Also, it presents four models used in this study, which are: the Artificial Neural Network (ANN), Random Forest (RF), Gradient Boosting (GB) and Decision Tree (DT) model. The reason behind selecting these models is their effectiveness in the similar studies reviewed in the literature.
4.1 Experimental design, tools, techniques
This section discusses the design of the Users’ Age Prediction Using Machine Learning model. Also, it presents all the tools required for applying for the proposed study. Furthermore, it demonstrates all the techniques used for this study.
4.1.1 Design
Designing the Users’ Age Prediction Using Machine Learning model required several stages. The first stage is collecting the dataset. The second stage is having a background for this study. The third stage is reading and searching for related works and writing a literature review. Fourth is the preprocessing stage, where feature scaling, handling missing values, dimensionality reduction, and data balancing is completed. The fifth stage is the implantation of the models. In this study, four models were used: the Artificial Neural Network (ANN), Random Forest (RF), Gradient Boosting (GB) and Decision Tree (DT) model. Moreover, analyzing and comparing the results. Finally, the discussion and conclusion are completed.
4.1.2 Tools
This study was implemented using the Python programming language. Furthermore, this program was completed using the Jupyter tool and Google Collab tool. For hardware tools, this study was implemented using a Mac book laptop and a Dell laptop. In this study, four techniques were chosen for modeling: Artificial Neural Network (ANN), Random Forest (RF), Gradient Boosting (GB) and Decision Tree (DT) model.
4.2 Experimental models
This section includes the models used for Users’ Age Prediction Using Machine Learning model study. Four algorithms were applied, which are: the Artificial Neural Network (ANN), Random Forest (RF), Gradient Boosting (GB) and Decision Tree (DT) model.
4.2.1 Artificial Neural Network
An Artificial Neural Network is a machine learning model that simulates the human brain structure. The brain of the human consists of millions of neurons. These neurons send chemical and electrical signals to each other via the synapses. The Artificial Neural Network model contains three basic layers which are the input layer, hidden layer, and the output layer. The input layer is used to receive the raw data and the values of the explanatory for each observation. The hidden layer where the activity and the weight on the connection between the input and hidden layer. The output layer receives the connections from the previously hidden layers and returns an output value that corresponds to the prediction. Furthermore, this algorithm is useful for data classification and regression problems. Also, this algorithm works well in nonlinear and linear data [43].
4.2.2 Random forest
Random forest is a supervised machine learning algorithm that is used for regression and classification problems. This algorithm is based on the concept of ensemble learning, which means to solve a specific complex problem, combine multiple classifiers to increase the performance of the model. Moreover, the random forest model contains several decision trees on several subsets and provides the average of these decision trees to increase the performance and the accuracy of a certain dataset. Based on the majority votes of prediction from each decision tree, a random forest model predicts the output. Also, to prevent the problem of overfitting, the number of trees should be increased, a greater number of trees generates a higher accuracy. Figure # presents the working of the random forest algorithm. The random forest provides several advantages such as it takes less training time and can predict the output with very high accuracy. Also, this algorithm can run in a very large dataset and provides very high accuracy. However, RF is not suitable for regression [44].
4.2.3 Gradient boosting
Gradient boosting is one of the most popular supervised machine learning algorithms. This algorithm provides the ability to find any nonlinear relationship between your model targets. Also, it can deal with outliers, missing values, and high cardinality categorical values on instances without special treatment. Furthermore, the model of this algorithm is characterized by high efficiency because each tree inside it works to fix the errors of the tree that precedes it. Also, the model relies on the loss function for residual detection. For example, logarithmic loss (log loss) is used in classification and regression tasks [45].
4.2.4 Decision tree
A decision tree algorithm is a supervised machine learning technique. This algorithm is used for both classification and regression but is preferred to solve the classification problems. DT is a tree-structured classifier, where the features are represented on the internal nodes, and the branches represent the decision rules and the outcome represented on the leaf. The decision node has several branches and is used to make the decisions. Leaf node represents the output of these decisions and doesn’t have any branches. Also, DT has many advantages such as it can mimic human thinking for making decisions. Furthermore, due to the tree-like structure, the logic of this model can be easily understood. Figure # shows the structure of the decision tree model [46].
This section discusses the analysis and setup for each algorithm for age detection. Including the Artificial Neural Network (ANN), Random Forest (RF), Gradient Boosting (GB) and Decision Tree (DT) model. Also, it involves the optimization strategy.
5.1 Experimental setup and analysis
During the implementation of the experiments, Python programming language was used, and the code was run by the Google Collaboratory platform. The STC dataset contains 19 features with a total of three million instances. Several preprocessing methods were applied to the dataset to build a high-performance model (discussed in detail in the preprocessing section). The STC dataset was divided into two sets (70% for the training set and 30% for the test set). The target prediction class is the Age feature. Also, four machine-learning algorithms were used to predict the age which are Artificial Neural Network (ANN), Random Forest (RF), Gradient Boosting (GB), and Decision Tree (DT) algorithm (discussed in detail in the Experimental Models section). Moreover, the proposed models were trained on the training samples of the dataset then the testing samples were used to determine the performance of the models. Finally, the recall, f1-score, accuracy, confusion matrix, and precision were used as evaluation criteria of the models’ performance.
5.2 Optimization strategy
Optimization is very important to increase the performance of the model. Optimization plays a big role in machine learning models, where fitting processes the learning model on the training dataset. For optimization in the proposed study, we used three dense layers in ANN model. Also, we used the ‘relu’ function with the number of 36,24, and 16 nodes for each layer respectively. Furthermore, the number of epochs was 60. Moreover, the hyperparameters are applied to the ANN model to increase its accuracy. Hyperparameters have several benefits and positive impacts on the model performance, including optimizer, losses, and metrics. The optimal hyperparameter values used are shown in Table 4:
Table 4. Optimal hyperparameter values
|
Hyper Parameter/Structure |
Value Range |
|
Optimizers |
Adam |
|
Number of layers |
Three layers |
|
Activation function |
‘relu' |
|
Epochs |
60 |
In Random Forest (RF) model we used n_estimators equal to 100 and the criterion was “gini” and the max depth is equal to None. Moreover, for the Gradient Boosting (GB) the loss is ’deviance’, and the learning rate is equal to 0.01 and the n_estimators is equal to 100. Also, for the Decision Tree (DT) algorithm the criterion was “gini”, the splitter was “best” and the max_depth was equal to None.
5.3 Grid search
Grid-searching is the simplest process used to scan the data to find the optimal parameters for each model. Grid-searching can be applied to different model types to find the best parameter for a given machine learning model. Grid-searching is very slow and complex and it's computationally expensive. Basically, the domain of the hyperparameters will be divided into a discrete grid, then we use the grid to try every combination of values and calculate using the cross-validation some performance matrices. In cross-validation, the point of the grid that increases the average value is the best combination of values for the hyperparameter. However, grid-searching is a good method if you want to find the best combination of values for hyperparameters.
5.4 Evaluation matrices
The performance of the Artificial Neural Network (ANN), Random Forest (RF), Gradient Boosting (GB), and Decision Tree (DT) models was evaluated using the confusion matrix, the recall, f score, accuracy, and precision.
5.4.1 Confusion matrix
Confusion matrix can measure the performance of machine learning models. It compares the predicted values with the real values. Figure 5 presents a confusion matrix for a binary problem classification. Where the symbols TP, TN, FP, and FN indicates True Positive, False Positive, False Positive, and False Negative respectively [47-50].
Figure 5. Confusion matrix for binary classification
5.4.2 Accuracy
Accuracy shows the percentage of the truly predicted samples among all the samples in the testing set.
Accuracy $=(T P+T N) /(T P+T N+F P+F N)$ (2)
5.4.3 Recall
Recall shows the percentage of the positive samples that were correctly predicted among all the real positive samples.
Recall $=T P /(T P+F N)$ (3)
5.4.4 Precision
Precision presents the percentage of the truly predicted samples of the positive class among all the positive predictions.
precision $=T P /(T P+F P)$ (4)
5.4.5 F score
F-Score shows the average the truly predicted samples of the positive class (Precision) and the positive samples (Recall) that were correctly predicted. This measure used to evaluate the balance of model’s predictions among the two classes.
F-Score=(2×Pr e cision×Recall)/(Pr e cision+Recall) (5)
This section discusses the results for the proposed model for users’ age detection. Four machine learning algorithms have been tested which are Artificial Neural Network (ANN), Random Forest (RF), Gradient Boosting (GB) and Decision Tree (DT) algorithm.
After training and testing the algorithms the Artificial Neural Network (ANN) algorithm showed the highest accuracy. As we see from the results in table#, the proposed Artificial Neural Network (ANN) model showed an accuracy with a value of 60% for the classification of the Age target class to Adult, Old and, Young in the STC dataset. Also, table# presents the reached values for the precision, recall, f1-score, and support values for the prediction for each algorithm. Furthermore, the Random Forest (RF) model reached an accuracy of 51%, Gradient Boosting (GB) and Decision Tree (DT) algorithm reached 53%, 56% respectively.
Table 5. Results for the proposed model
|
Classifier |
Precision |
Recall |
F1-Score |
Accuracy |
|
ANN |
0.61 |
0.60 |
0.57 |
0.60 |
|
RF |
0.52 |
0.52 |
0.51 |
0.52 |
|
GB |
0.53 |
0.53 |
0.52 |
0.53 |
|
DT |
0.53 |
0.53 |
0.52 |
0.56 |
Also, to evaluate the performance of the algorithms, further analysis was implemented for each model. The precision, recall and f1-score was computed for each algorithm as presented in table#. Moreover, the confusion matrix was calculated for all the algorithms (discussed in the comparison section).
The following Figure 6 shows the confusion matrix for ANN. From the confusion matrix we can see that the model ability on identifying the high corrosion is very good and this is what is needed to predict the age of the user. This result shows that the proposed model works well compared to the previous studies, so we believe that our work will make a worthwhile contribution to this area.
Figure 6. Confusion matrix for ANN
Figure 7 shows the accuracy and loss for training the Artificial Neural Network (ANN) model and validating the model using the STC dataset. These results show us that the process of learning using the STC dataset is working in a satisfactory form.
Figure 7. Accuracy & loss for training ANN
This section presents a comparison between the proposed models, Including Artificial Neural Network (ANN), Random Forest (RF), Gradient Boosting (GB) and Decision Tree (DT).
7.1 Comparison between the proposed models
Table 6 presents a comparison for the accuracy between the proposed models. Including Artificial Neural Network (ANN), Random Forest (RF), Gradient Boosting (GB) and Decision Tree (DT) algorithm.
Table 6. Comparison for the accuracy among the proposed models
|
Classifier |
Precision |
Recall |
F1-Score |
Accuracy |
|
ANN |
61% |
60% |
57% |
60% |
|
RF |
52% |
52% |
51% |
52% |
|
GB |
53% |
53% |
52% |
53% |
|
DT |
53% |
53% |
52% |
56% |
In this study, several machine learning algorithms were used to predict the users’ age. As a result of implanting these models the accuracy reached is presented in table #. Artificial Neural Network (ANN) reached an accuracy of 60% where the Random Forest (RF) model reached 53%. Also, 53% of accuracy for implanting the Gradient Boosting (GB) and 56% for the Decision Tree model (DT). The highest value of accuracy is 60% for implementing the Artificial Neural Network model (ANN). ANN implemented with Adam optimizer and used three hidden layers and with the value of 60 epochs. Artificial Neural Network model (ANN) achieved good accuracy compared with other models’ results.
7.2 Comparison with the benchmark studies
This section presents a comparison of the proposed model with the benchmark studies. Table 7 shows comparison between the results of the proposed model and other studies.
In this study, ANN, RF, GB, and DT model were used to predict the users’ age. The STC dataset was used to train the model consisting of three million rows divided into three classes which are young, adult, and old features. The number of samples in the dataset in each class is young contains 220210 samples after oversampling.
Table 7. Comparison of the proposed model with benchmark studies
|
Study |
Number of Instances |
Technique |
Accuracy |
|
Age and gender prediction using CNN [9] |
430 instances |
CNN |
57% |
|
Gender and age prediction [12] |
280 samples |
GB, MLP, multinomial Naive Bayes, Logistic Regression CV |
60% |
|
Proposed model |
3 million rows |
ANN, RF, DT and GB |
60% |
In this section, we compared the proposed model with the previous benchmark studies. The benchmark studies in table# compared with this study were used to predict the users’ age. The first study [9], authors used a CNN model to estimate the users’ age and detect their gender by linking the entered birth information with the users' image. This study reached 57% for accuracy which is lower than the proposed model. So, our proposed model showed a better accuracy performance than this study. Furthermore, the study in [12] used the dataset of 280 samples. Also, this study used the Gradient Boosting Classifier, Multi-Layer Perceptron classifier, multinomial Naive Bayes classifier, and Logistic Regression CV classifier to predict the age and the gender. The study resulted in the highest accuracy of 60%, which is like the proposed model.
Nowadays, cellphones became a part of our lives. As there are one of the most important methods of communication and contacting people in different geographic areas. This spread of cellphones between people can be used in new ways to get useful information about people and use it in other fields. One of these information is predicted in this study which is the age group of the cellphone user. Person’s age plays an important role in understanding and predicting that person’s behavior and needs, and can be used in providing targeted services, advertisements, and offers. The remaining part of this section contains a detailed discussion about the information of the users of uncommon devices in Saudi Arabia. Figure 8 below shows the distribution of users according to their age group.
As shown in Figure 8, most of the users of uncommon devices are adults between (18-55) years. In the meantime, the old users are one fourth the number of the adult users. But when comparing the ratio of old users to the number of old people who using cellphone in the community with the ratio of the adult users, we notice that old people are more likely to use uncommon devices than other adults. Moreover, the young users who are less than 18 years are less likely to use uncommon devices. The second important piece of information about users is their gender. Figure 9 shows gender distribution among the age groups of the users.
Figure 8. Age distribution
As shown in Figure 9, most of the users among all the age groups are males. In the case of adult users, it is shown that the number of male users is almost three times the number of the female users. While in the other two groups, the male users are almost twice the number of the female users. To get more detailed discussion, Figure 10 shows the nationality distribution among the age groups.
Figure 9. Gender distribution among age groups
From Figure 10, most of the users are non-Saudi users in all the age groups. In the adult group, the difference between the number of non-Saudi and the Saudi users is very large, approximately between each ten adult users only one of them is Saudi. By combining the knowledge extracted from the nationality and gender previously, if the user is male and non-Saudi the highest probability is to be adult and the lowest probability to be young user. Now, let’s discuss the information about the device and it is relation with its user. Figure 11 shows the distribution of the device type among the age groups.
Figure 10. Nationality distribution among age groups
Figure 11. Device type distribution among age groups
Per Figure 11, most of the adult users are using smartphones which is the normal case. While the old users are using the old mobile phone more than the smart phone, these results make sense as many people face problems in adapting and learning to use smartphone, so they prefer old mobile phones. In the meantime, the distributions of smart and mobile phone users among young users are almost equal. Per the knowledge extracted from the figure above, if the user has an old mobile phone, there is a high probability of being an old user. Figure 12 shows the OS distribution among the age groups.
Figure 12. OS distribution among age groups
As shown in Figure 12 above, most of the adult users are preferring to use devices that work with Android operating system. This is normal as Android is the most popular OS among other OSs in this data. Even though Android is very popular, old users prefer to use Proprietary OS than Android OS. After discussing all the distributions in the figures above and extracting the available knowledge. We can conclude that, most of the uncommon devices’ users are adults, males, non-Saudis, and Android users. In addition, the use of uncommon devices is more preferred for old users, and they prefer to use old mobile phones instead of smartphones. Lastly, young people are rare users of the uncommon devices in the community.
In this study, machine learning was used to predict the users' age based on their smartphone type. These predictions are useful in identifying offers and advertisements suitable for each age group. A real and rich dataset was obtained from the STC. We were able to predict the user's age based on their dataset. The preprocessing of the dataset was deliberate and involved the completion of several tasks, such as clearing up missing values, discretizing the data, and balancing it. Four major prediction algorithms were adequately implemented in this study, including the ANN, RF, GB, and DT algorithms. The experiments result of our proposed models indicates that ANN proved to be the most accurate among all algorithms. Where the detailed analysis of the STC dataset achieves an accuracy rate of 60%. Therefore, we can conclude that ANNs can predict users' ages well. This technique can be employed in Saudi Arabia to predict users' age based on their smartphone type. Although, the obtained results were in line with previous studies. However, we aim to improve the proposed model in the future and increase its accuracy by using different techniques and models such as ensemble learning, transfer learning and deep learning [51, 52]. Because there is a big room for improvement in terms of evaluation metrics which is a major limitation of the study.
[1] The Role of Telecommunications in Business. https://www.telxcomputers.com/the-role-of-telecommunications-in-business/, accessed on Feb. 19, 2022.
[2] SAUDI TELECOM COMPANY Company Profile | Riyadh, Saudi Arabia | Competitors, Financials & Contacts - Dun & Bradstreet. https://www.dnb.com/business-directory/company-profiles.saudi_telecom_company.7ad86a0070c3ae6f316840e578c94a5d.html, accessed on Feb. 19, 2022.
[3] The Importance & Benefits of Telecommunication - All Access Telecom. http://www.allaccesstelecom.com/the-importance-benefits-of-telecommunication/, accessed on Feb. 19, 2022.
[4] Generational Marketing: Understanding Different Age Groups and Their Preferences | Martech Zone. https://martech.zone/what-is-generational-marketing/, accessed on Feb. 19, 2022.
[5] How to Appeal to Customers of Different Ages. https://smallbusiness.chron.com/appeal-customers-different-ages-75191.html, accessed on Feb. 19, 2022.
[6] Top 8 Business Benefits of Machine Learning - Outsource2india. https://www.outsource2india.com/software/articles/businesses-benefits-machine-learning.asp, accessed on Feb. 19, 2022.
[7] Benefits of Machine Learning in Business - Flatworld Solutions. https://www.flatworldsolutions.com/IT-services/articles/how-machine-learning-can-help-your-business.php, accessed on Feb. 19, 2022.
[8] How Can a Laptop Improve Communication for a Business or Industry? https://smallbusiness.chron.com/can-laptop-improve-communication-business-industry-71264.html, accessed on Feb. 19, 2022.
[9] Abu Nada, A.M., Alajrami, E., Al-Saqqa, A.A., Abu-Naser, S.S. (2020). Age and gender prediction and validation through single user images using CNN. International Journal of Academic Engineering Research (IJAER), 4(8): 21-24.
[10] Hassan, M., Wang, Y., Wang, D., Li, D., Liang, Y., Zhou, Y., Xu, D. (2021). Deep learning analysis and age prediction from shoeprints. Forensic Science International, 327: 110987. https://doi.org/10.1016/j.forsciint.2021.110987
[11] Kim, D.K., Cho, B.J., Lee, M.J., Kim, J.H. (2021). Prediction of age and sex from paranasal sinus images using a deep learning network. Medicine, 100(7): e24756. https://doi.org/10.1097/MD.0000000000024756
[12] Nemati, A. (2018). Gender and age prediction multilingual author profiles based on comments. In FIRE (Working Notes), pp. 232-239.
[13] Asogwa D.C., Anigbogu S.O., Anigbogu G.N., Efozia F.N. (2019). Development of a machine learning algorithm to predict author’s age from text. International Journal of Research -GRANTHAALAYAH, 7(10): 380-389. https://doi.org/10.29121/granthaalayah.v7.i10.2019.408
[14] Dash, S., Luhach, A.K., Chilamkurti, N., Baek, S., Nam, Y. (2019). A Neuro-fuzzy approach for user behaviour classification and prediction. Journal of Cloud Computing, 8(1): 1-15. https://doi.org/10.1186/s13677-019-0144-9
[15] Gollapalli, M., Musleh, D., Ibrahim, N., Khan, M.A., Abbas, S., Atta, A., Khan, M.A., Farooqui, M., Iqbal, T., Ahmed, M.S., Ahmed, M.I.B., Almoqbil, D., Nabeel, M., Omer, A. (2022). A neuro-fuzzy approach to road traffic congestion prediction. Computers, Materials & Continua, 73(1): 295-310.
[16] Qureshi, I.M., Malik, A.N., Naseem, M.T. (2014). Dynamic resource allocation in OFDM systems using DE and FRBS. Journal of Intelligent & Fuzzy Systems, 26(4): 2035-2046. https://doi.org/10.3233/IFS-130880
[17] Rahman, A., Qureshi, I., Malik, A., Naseem, M. (2014). A real time adaptive resource allocation scheme for OFDM systems using GRBF-neural networks and fuzzy rule base system. International Arab Journal of Information Technology (IAJIT), 11(6): 590-598.
[18] Rahman, A. (2023). GRBF-NN based ambient aware realtime adaptive communication in DVB-S2. Journal of Ambient Intelligence and Humanized Computing, 14(5): 5929-5939. https://doi.org/10.1007/s12652-020-02174-w
[19] Rahman, A.U., Dash, S., Luhach, A.K. (2021). Dynamic MODCOD and power allocation in DVB-S2: A hybrid intelligent approach. Telecommunication Systems, 76: 49-61. https://doi.org/10.1007/s11235-020-00700-x
[20] Alqarni, A., Rahman, A. (2023). Arabic Tweets-based sentiment analysis to investigate the impact of COVID-19 in KSA: A deep learning approach. Big Data and Cognitive Computing, 7(1): 16. https://doi.org/10.3390/bdcc7010016
[21] Alhaidari, F., Rahman, A., Zagrouba, R. (2020). Cloud of Things: Architecture, applications and challenges. Journal of Ambient Intelligence and Humanized Computing, 14: 5957-5975. https://doi.org/10.1007/s12652-020-02448-3
[22] Ahmad, M., Qadir, M.A., Rahman, A., Zagrouba, R., Alhaidari, F., Ali, T., Zahid, F. (2020). Enhanced query processing over semantic cache for cloud based relational databases. Journal of Ambient Intelligence and Humanized Computing, 14: 5853-5871. https://doi.org/10.1007/s12652-020-01943-x
[23] Atta-ur-Rahman, Ibrahim, N.M., Musleh, D., Khan, M.A.A., Chabani, S., Dash, S. (2022). Cloud-based smart grids: opportunities and challenges. In: Dehuri, S., Prasad Mishra, B.S., Mallick, P.K., Cho, SB. (eds) Biologically Inspired Techniques in Many Criteria Decision Making. Smart Innovation, Systems and Technologies, vol. 271. Springer, Singapore. https://doi.org/10.1007/978-981-16-8739-6_1
[24] Atta-ur-Rahman, Dash, S., Ahmad, M., Iqbal, T. (2021). Mobile cloud computing: A green perspective. In: Udgata, S.K., Sethi, S., Srirama, S.N. (eds) Intelligent Systems. Lecture Notes in Networks and Systems, vol. 185. Springer, Singapore. https://doi.org/10.1007/978-981-33-6081-5_46
[25] Khan, M.A., Abbas, S., Atta, A., Ditta, A., Alquhayz, H., Khan, M.F., Naqvi, R.A. (2020). Intelligent cloud based heart disease prediction system empowered with supervised machine learning. Computers, Materials & Continua, 65(1): 139-151.
[26] Musleh, D., Alotaibi, M., Alhaidari, F., Rahman, A., Mohammad, R.M. (2023). Intrusion detection system using feature extraction with machine learning algorithms in IoT. Journal of Sensor and Actuator Networks, 12(2): 29. https://doi.org/10.3390/jsan12020029
[27] Ahmed, M.S., Rahman, A., AlGhamdi, F., AlDakheel, S., Hakami, H., AlJumah, A., AlIbrahim, Z., Youldash, M., Alam Khan, M.A., Basheer Ahmed, M.I. (2023). Joint diagnosis of pneumonia, COVID-19, and tuberculosis from chest X-ray images: A deep learning approach. Diagnostics, 13(15): 2562. https://doi.org/10.3390/diagnostics13152562
[28] Gollapalli, M., Rahman, A., Alkharraa, M., Saraireh, L., AlKhulaifi, D., Salam, A.A., Krishnasamy, G., Alam Khan, M.A., Farooqui, M., Mahmud, M., Hatab, R. (2023). SUNFIT: A machine learning-based sustainable university field training framework for higher education. Sustainability, 15(10): 8057. https://doi.org/10.3390/su15108057
[29] Ahmed, M.I.B., Alotaibi, R.B., Al-Qahtani, R.A., Al-Qahtani, R.S., Al-Hetela, S.S., Al-Matar, K.A., Al-Saqer, N.K., Rahman, A., Saraireh, L., Youldash, M., Krishnasamy, G. (2023). Deep learning approach to recyclable products classification: Towards sustainable waste management. Sustainability, 15(14): 11138. https://doi.org/10.3390/su151411138
[30] Farooqui, M., Rahman, A., Alorefan, R., Alqusser, M., Alzaid, L., Alnajim, S., Althobaiti, A., Ahmed, M.S. (2023). Food classification using deep learning: Presenting a new food segmentation dataset. Mathematical Modelling of Engineering Problems, 10(3): 1017-1024. https://doi.org/10.18280/mmep.100336
[31] Talha, M., Sarfraz, M., Rahman, A., Ghauri, S.A., Mohammad, R.M., Krishnasamy, G., Alkharraa, M. (2023). Voting-Based Deep Convolutional Neural Networks (VB-DCNNs) for M-QAM and M-PSK signals classification. Electronics, 12(8): 1913. https://doi.org/10.3390/electronics12081913
[32] Ibrahim, N.M., Gabr, D.G., Rahman, A., Musleh, D., AlKhulaifi, D., AlKharraa, M. (2023). Transfer learning approach to seed taxonomy: A wild plant case study. Big Data and Cognitive Computing, 7(3): 128. https://doi.org/10.3390/bdcc7030128
[33] Ahmed, M.I.B., Zaghdoud, R.A., Ahmed, M.S., Alrabeea, M., Alsuwaiti, A., Alzaid, N., Alyousef, A., Khan, M.A.A., Rahman, A., Chabani, S., Krishnasamy, G., Alturkey, A. (2023). Intelligent directional survey data analysis to improve directional data acquisition. Mathematical Modelling of Engineering Problems, 10(2): 482-490. https://doi.org/10.18280/mmep.100214
[34] Open Dataset. https://lab.stc.com.sa/dataset/en/, accessed on Mar. 19, 2022.
[35] Kotsiantis, S.B., Kanellopoulos, D., Pintelas, P.E. (2006). Data preprocessing for supervised leaning. International Journal of Computer Science, 1(2): 111-117.
[36] Mahdavi, M., Neutatz, F., Visengeriyeva, L., Abedjan, Z. (2019). Towards automated data cleaning workflows. Machine Learning, 15: 16.
[37] 6 Methods of Data Transformation in Data Mining | upGrad blog. https://www.upgrad.com/blog/methods-of-data-transformation-in-data-mining/, accessed on Mar. 28, 2022.
[38] Machine Learning: When to perform a Feature Scaling? - atoti. https://www.atoti.io/articles/when-to-perform-a-feature-scaling/, accessed on Mar. 19, 2022.
[39] 6 Methods of Data Transformation in Data Mining | upGrad blog. https://www.upgrad.com/blog/methods-of-data-transformation-in-data-mining/, accessed on Apr. 09, 2022.
[40] Czarnowski, I., Jędrzejowicz, P. (2018). An approach to data reduction for learning from big datasets: Integrating stacking, rotation, and agent population learning techniques. Complexity, 2018: 1-13. https://doi.org/10.1155/2018/7404627
[41] Encoding Categorical data in Machine Learning | by Akhil Reddy Mallidi | #ByCodeGarage | Medium. https://medium.com/bycodegarage/encoding-categorical-data-in-machine-learning-def03ccfbf40, accessed on Mar. 19, 2022.
[42] Keller, J. (2019). Upsampling with smote for classification projects. Towards Data Science.
[43] The Neural Networks Model - IBM Documentation. https://www.ibm.com/docs/en/spss-modeler/18.0.0?topic=networks-neural-model, accessed on Mar. 28, 2022.
[44] Machine Learning Random Forest Algorithm - Javatpoint. https://www.javatpoint.com/machine-learning-random-forest-algorithm, accessed on Mar. 28, 2022.
[45] Natekin, A., Knoll, A. (2013). Gradient boosting machines, a tutorial. Frontiers in Neurorobotics, 7: 21. https://doi.org/10.3389/fnbot.2013.00021
[46] Machine Learning Decision Tree Classification Algorithm - Javatpoint. https://www.javatpoint.com/machine-learning-decision-tree-classification-algorithm, accessed on Mar. 28, 2022.
[47] Qamar, R.A., Sarfraz, M., Rahman, A., Ghauri, S.A. (2023). Multi-criterion multi-UAV task allocation under dynamic conditions. Journal of King Saud University-Computer and Information Sciences, 35(9): 101734. https://doi.org/10.1016/j.jksuci.2023.101734
[48] Aljameel, S.S., Rahman, A. (2013). Enhancing multi-user detection in multicarrier 5G and beyond: A space-time spreading approach with parallel interference cancellation. Mathematical Modelling of Engineering Problems, 10(4): 1207-1215. https://doi.org/10.18280/mmep.100413
[49] Khan, M.B.S., Nawaz, M.S., Ahmed, R., Khan, M.A., Mosavi, A. (2022). Intelligent breast cancer diagnostic system empowered by deep extreme gradient descent optimization. Mathematical Biosciences and Engineering, 19(8): 7978-8002. https://doi.org/10.3934/mbe.2022373
[50] Gollapalli, M. (2022). Ensemble machine learning model to predict the waterborne syndrome. Algorithms, 15(3): 93. https://doi.org/10.3390/a15030093
[51] Abbas, T., Fatima, A., Shahzad, T., Alissa, K., Ghazal, T.M., Al-Sakhnini, M.M., Abbas, S., Khan, M.A., Ahmed, A. (2023). Secure IoMT for disease prediction empowered with transfer learning in healthcare 5.0, the concept and case study. IEEE Access, 11: 39418-39430. https://doi.org/10.1109/ACCESS.2023.3266156
[52] Nasir, M.U., Zubair, M., Ghazal, T.M., Khan, M.F., Ahmad, M., Rahman, A.U., Hamadi, H.A., Khan, M.A., Mansoor, W. (2022). Kidney cancer prediction empowered with blockchain security using transfer learning. Sensors, 22(19): 7483. https://doi.org/10.3390/s22197483