Anthony O. Onokwai![]() | Imhade P. Okokpujie*
| Imhade P. Okokpujie*![]() | Emmanuel S. A. Ajisegiri
| Emmanuel S. A. Ajisegiri![]() | Makanjuola Oki
| Makanjuola Oki![]() | Ejiroghene Onokpite
| Ejiroghene Onokpite![]() | Kunle Babaremu
| Kunle Babaremu![]() | Tien-Chien Jen
| Tien-Chien Jen![]()
© 2023 IIETA. This article is published by IIETA and is licensed under the CC BY 4.0 license (http://creativecommons.org/licenses/by/4.0/).
OPEN ACCESS
The growing demand for clean and sustainable energy has catalyzed global efforts toward greener economies and sustainable development. In this study, we investigated palm kernel shell (PKS) biomass obtained from a palm oil mill in Omu-Aran, Nigeria (Latitude 8°08ʹ18.85ʺN and Longitude 5°06ʹ9.36ʺE) as a potential feedstock for biochar production. The biomass underwent pretreatment and sieving into particle size ranges of 0.1-0.2 mm, 0.2-0.4 mm, 0.4-0.6 mm, 0.6-0.8 mm, and 0.8-1.0 mm, and was stored in zip-locked polyethylene bags at room temperature for subsequent characterization and pyrolysis experiments. Response surface methodology (RSM) was employed to model and optimize the operating parameters of pyrolysis. The maximum biochar yield (41.1 wt%) was achieved under optimal conditions: temperature of 320℃, reaction time of 6.5 min, heating rate of 12.8℃/min, nitrogen flow rate of 25 cm³/min, and particle size of 0.9 mm. The model exhibited a p-value of 0.05, a high F-value for biochar (340.5), and an R² of 0.9887, signifying its appropriateness, reliability, responsiveness, and accurate prediction of experimental data. A strong correlation between actual and predicted values for biochar yield was observed. Fourier-transform infrared (FT-IR) spectroscopy revealed the presence of alcohol groups, as evidenced by peaks at 3906.3, 3809.3, 3749.7, 3649.7, 3678.9, and 3600.6 cm⁻¹, as well as alkynes and alkenes, indicated by high-intensity peaks at 2113.4 and 1904.4 cm⁻¹. Scanning electron microscopy (SEM) and energy-dispersive X-ray spectroscopy (EDX) analyses of the biochar showed white deposits, cleavages, heterogeneous pores, and cloudy formations, indicating inorganic materials and rapid efflorescence during pyrolysis.
energy, biomass, pyrolysis, palm kernel shell, response surface method
The increasing demand for clean and sustainable energy is driving global efforts toward greener economies and sustainable development [1, 2]. Renewable energy technologies have been identified as crucial for addressing global energy demands, energy security, and climate change [3, 4]. Despite widespread recognition, the overall contribution of renewable energy to global energy reserves remains limited [5, 6]. Furthermore, concerns exist regarding uncertainties and challenges arising from various methods or techniques involved in the conversion of renewable energies into fuels [7]. To transition from conventional fossil fuels to clean energies, optimal harnessing of energy from various renewable energy sources is required [8].
Biomass represents a promising renewable energy source in Nigeria, where it can be converted into various forms of energy, including biochar, bio-oil, and non-condensable gases (NCG) [9, 10]. Historically used as a major energy source for heat generation, biomass is now being revisited as an option for sustainable energy production [11, 12]. Palm kernel shell (PKS) is an abundant biomass resource in West Africa and a byproduct of the growing palm oil industry in Nigeria [13]. Previous studies have demonstrated that PKS can be converted into biochar through slow pyrolysis, owing to its high content of hemicelluloses, cellulose, and lignin [14].
Thermochemical conversion procedures are employed to convert biomass into biochar [15, 16]. Research and development in the thermochemical conversion of biomass are essential for addressing the current energy consumption crisis [17]. Thermochemical conversion is considered one of the most effective methods to convert biomass into biofuels [18]. It involves the decomposition of biomass under controlled heating or oxidation at high temperatures above 150℃, resulting in biofuels such as biochar, bio-oil, and NCG [19, 20]. The conversion technologies include combustion, gasification, and pyrolysis [21]. Although combustion is the simplest and most popular conversion method, it poses significant environmental risks [8, 22]. Gasification is efficient but requires high investment costs, while pyrolysis provides a more affordable and straightforward method for biomass conversion into energy [17, 23].
Pyrolysis, a thermal decomposition process that occurs in the absence of oxygen, can be categorized into fast, slow, intermediate, and flash pyrolysis, depending on the heating rate [24]. Fast pyrolysis is characterized by high bio-oil yields (up to 80 wt%) and minimal biochar and NCG production [25, 9]. Slow pyrolysis, on the other hand, produces higher biochar yields (60-70 wt%), with lower bio-oil and tar yields [26]. Intermediate pyrolysis is considered the most suitable route to optimize co-pyrolysis yields, as it enhances the products of pyrolysis and reduces the high moisture content present in the biomass, leading to activated carbon production [1, 27].
Pyrolysis operating parameters, such as temperature and heating rate, significantly influence the quantity and quality of biochar yield [28]. Therefore, determining the optimal experimental conditions for maximizing biochar yields is crucial [29]. To achieve this, the response surface method (RSM) optimization tool can be employed [30]. RSM is a statistical and mathematical tool that allows for the analysis of the effects of independent variables, either individually or in combination, and the optimization of processes [1, 31]. The central composite design (CCD) is preferred due to its higher efficacy, lower number of experiments, cost-effectiveness, and suitability for multivariate optimization [8, 19]. The functional groups, image resolution, and morphology of the biochar obtained at optimal conditions can be characterized using Fourier-transform infrared (FT-IR) spectroscopy, scanning electron microscopy (SEM), and energy-dispersive X-ray spectroscopy (EDX) techniques.
This study aims to model and optimize the pyrolysis operating parameters for biochar production from palm kernel shell using response surface methodology. The outcomes of this research will significantly contribute to the process of achieving clean energy from the processing of palm kernel shell biomass by determining the optimal pyrolysis parameters using response surface methodology.
2.1 Materials source
Palm kernel shell was sourced from sourced from palm oil mill in Omu-Aran, Kwara State, Nigeria Latitude 8°08ʹ18.85ʺN and Longitude 5°06ʹ9.36ʺE), Nigeria. The processing of the biomass includes; rinsing of the sample with distilled water to remove impurities, then sun-dried for a period of three days Onokwai et al. [3]. Thereafter, the sun-dried PKS was milled using a ball milling machine installed in Civil Engineering laboratory, Landmark University, Omu-ran, Kwara State, Nigeria. The grounded sample was sun-dried for seven days. The final dried samples were sieved into varying particle sizes with a diameter of 0.1-0.2, 0.2-0.4, 0.4-0.6, 0.6-0.8, and 0.8-1.0 mm, weighed and stored at room temperature in zip-locked polythene bags for characterization and pyrolysis experimentation.
2.2 Characterization of biomass
The characterization was carried out based on oven-dried basis. The proximate analysis was determined using a carbolite muffle furnace (Model: CWF1223-230SN+&02-3216P1). The moisture content was determined using ASTM E 1358 – 97 standards. Similarly, the volatile matter (VM) was determined according to ASTM E872-82 standards, while ASTM D1102-84 standards was used to obtained the ash contents. The fixed carbon (FC) was determined by difference, which is FC=100-(MC wt% + VM wt% +Ash wt%). The elements nitrogen, hydrogen, and carbon were determined using LECO CHN 2000 Elemental Analyzer according to ASTM D5373-21 standards. while the sulphur content was obtained using ASTM D4239-11, while the oxygen content was calculated using the difference formula 100 – (C wt% + H wt% + N wt% + S wt%). The structural composition was carried out to determine the cellulose, hemicellulose and lignin contents presence in the biomass. Finally, Mohan Brothers bomb calorimeter was used to determine the HHV according to ASTM D2015-00 standards, while the LHV was obtained using Eq. (1) by Mohammed et al. [1]. The results obtained from the characterization are depicted in Table 1.
Table 1. Characteristics of produced biochar from PKS
|
Analysis |
Weight % |
|
Proximate analysis (wt%) |
|
|
Moisture contents |
0.30 + 0.01 |
|
Volatile matter |
73.70 + 0.40 |
|
Fixed carbon |
22.50 + 0.21 |
|
Ash |
3.50 + 0.02 |
|
Ultimate analysis (wt%) |
|
|
Carbon |
48.90 + 1.14 |
|
Hydrogen |
5.38 + 0.01 |
|
Nitrogen |
0.22 + 0.01 |
|
Oxygen |
45.03 + 0.13 |
|
Sulphur |
0.03 + 0.001 |
|
Structural composition analysis (wt%) |
|
|
Cellulose |
28.92 + 0.13 |
|
Hemicellulose |
25.01 + 0.12 |
|
Lignin |
45.41 + 0.42 |
|
Heating value analysis (MJ/kg) |
|
|
HHV |
19.98 + 0.43 |
|
LHV |
18.70 + 0.21 |
LHV $(\mathrm{MJ} / \mathrm{kg})=\mathrm{HHV}-(0.218 \times \mathrm{H})$ (1)
where, LHV is the lower heating value (MJ/kg); HHV represents higher heating value (MJ/kg), and H represents percentage of hydrogen (%) by weight in fuel.
2.3 Research design
The experimental design used response surface methodology (RSM) based on a central composite design. CCD was adopted in this research since it is a frequently used statistical method for fitting quadratic models and much more reliable when the effects of multiple operating parameters on the final output are considered, as suggested by suggesting the smallest number of experimental runs Dhanavath et al. [7], Hossain et al. [19], and Onokwai et al. [30]. It is also applicable when each of the operating parameters consists of five levels. The first phase of the experimental design began with a design matrix layout for the explanatory factors and the scalar response(s) Laouge et al. [8] and Savasari et al. [32]. The tests were carried out with a single response in CCD (biochar) and five operating parameters (temperature, N2 flow rate, reaction time, heating rate, and particle sizes), each of which was considered at five levels: -1, +1, 0, -α and + α Hassan et al. [33] and Kumar et al. [34]. The alpha value was calculated using Eq. (2) and is dependent on a number of elements in the factorial section of the design.
$\alpha=\left[2^n\right]^{1 / 4}=\left[2^5\right]^{1 / 4}=2.3$ (2)
The number of operating parameters is denoted by n. At -2 and +2, the alpha value is displayed. The initial step was to use Eq. (3) to establish a mathematical link between the response and operating parameters.
$y=f\left(x_1, x_2, x_3, \ldots \ldots \ldots . x_n\right)$ (3)
where, y is the response y, f is the unknown function of response, x1, x2, x3, ...... xn is known as operating parameters and n is the number of operating parameters Laouge et al. [8] and Tripathi et al. [35].
The second phase uses a quadratic equation to estimate the coefficients (e.g., constant, linear, quadratic, and interactive) in a mathematical model Eq. (4). The significance of the model in regard to the alpha (P-value) constraint and the coefficient of determination (R2) were used to select the second-order model. The decision to optimize is based on the preferred desirable constraints, such as maximizing biochar yield while minimizing reaction time, and so on. Finally, predicting response and determining the model's adequacy by determining its significance and lack-of-fit, which is a measure of the model's inability to represent data in an experimental domain Laouge et al. [8] and Hossain et al. [19].
$\begin{gathered}y=\beta_0+\sum_{i=1}^k \beta_i \beta x_i+\sum_{i=1}^k \beta_{i i} x_i^2+ \sum_{i=1}^k \sum_{j>1}^k \beta_{i j} x_i x_j+\varepsilon_j\end{gathered}$ (4)
where, xi and xj are coded independent variables such as reaction temperature, particle sizes, heating rate, and residence time. This study employed design expert version 7.0.3 software (Stat-Ease) as backend algorithm based on hierarchical order of preference to automatically compute the interactions of the xi and xj, y represents the quantity of pyrolysis yields. β0 represents the constant coefficient while βi, βjj and βij are the coefficients for linear, quadratic, and interaction effects respectively and k represents the number of operating parameters, lastly, εirepresents the random error in the experiment Laouge et al. [8], Onokwai et al. [30], Savasari et al. [32].
Fifty (50) experimental runs were carried out to support the results obtained from the RSM using the centre composite design (CCD) as shown in Eq. (5) as utilized by Kumar et al. [29] and Kshirsagar and Kalamkar [36].
$N=2^k+2 k+n_c=2^5+2(5)+8=50$ (5)
where, N is the actual experimental runs; nc=8 is the repeated number of identical runs at the centre points of the centre composite design; k is the number of operating parameters such as temperature, particle sizes, reaction time, nitrogen flow rate, and heating rate. The value 2k standard factorial number with its origin at the center, so that a quadratic number of independent variables can be generated as reported by Kumar et al. [29].
2.4 Pyrolysis experimental setup
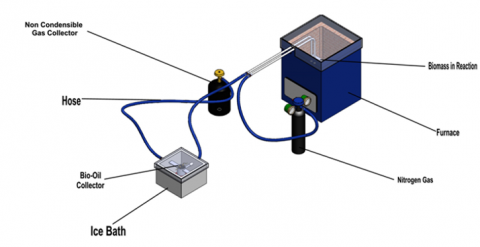
A cylindrically insulated reactor, gas collection, condenser, ice bath, PID temperature controller, inert gas flow system, and electric heater with a capacity of 4 kW comprised the pyrolysis setup. Variations in temperature, reaction time, heating rate and particle size, and nitrogen flow rate was used to maintain an inert environment in the reactor (Figure 1).
Figure 1. Pyrolysis plant experimental set-up
2.5 Experimental procedure
For each pyrolysis process, the feeding of the biomass into the reactor was carried out at a pre-set varying variables range of 320, 420, 520, 620 and 720℃ for temperature (T), reaction time (R) of 5, 10, 15, 20 and 25 min, a heating rate (H) of 7.5, 12.5, 17.5, 22.5, and 27.5℃/min, 25, 75, 125, 175, and 225 cm3/min for nitrogen flow rate (N) and particle size (P) of 0.1-0.2, 0.2-0.4, 0.4-0.6, 0.6-0.8, and 0.8-1.0 mm passing the gas through a condenser, the bio-water combination that was automatically split into bio-oil and water was formed. The mass balance (bio-gas) was used to calculate the weight of product yield (bio-char).
3.1 Biomass characteristics
The average values of the characterization of palm kernel shell based on proximate, ultimate, structural composition and heating value analysis are presented in Table 1. The results gave an insight on the expected behaviour of the biomass when used for pyrolysis process. The results obtained showed that the VM (73.70 wt%) and FC (22.5 wt%) closely agreed with what Acevedo et al. [11] reported. Similarly, the values obtained from the ultimate analysis is in consonance with the report of Acevedo et al. [11] and Okoroigwe et al. [37] Likewise, the cellulose, hemicellulose and lignin contents obtained in this study falls within the same range of values reported by Baffour-Awuah et al. [38]. The increase in heating value was attributed to the low moisture contents and high fixed carbon. The low moisture contents recorded make the biomass suitable for pyrolysis process since less energy would be needed to vaporize the biomass in the reactor. Hence, increase the yield of biochar Onokwai et al. [2] and Varma and Mondal [31]. Also, the low ash, nitrogen and sulphur contents help to reduce the deposition of harmful chemicals (slag, corrosion and erosion) in the reactor during pyrolysis process and extensive maintenance of the plant. Also, the low nitrogen and sulphur contents would reduce the formation of NOx and SOx gases Varma and Mondal [31], Ayeni et al. [39], Nagarajan and Prakash [40]. Hence, making the biomass favourable as feedstock for biochar yields Sahoo et al. [14]. Furthermore, the high volatile matter, fixed carbon, carbon and hydrogen, cellulose, hemicellulose and lignin contents would enhance the quantity, morphology, porous graphite and surface area fine aromatic of the biochar yields via pyrolysis process Palamanit et al. [22], Ghysels et al. [41] and Tomczyk et al. [42].
The results of biochar yield obtained from intermediate pyrolysis of palm kernel shell are shown in Table 2. The biochar yield (41.1 wt%) was attained at optimum values of 320℃, 5 min, 7.5℃/min, 25 cm3/min, and 0.9 mm, for T, R, H, N, and P respectively. These optimized values of the biochar yields are in good agreement with the work of Mohammed et al. [1] and Sahoo et al. [14] which reported optimum bio-char yields (43.66 wt%) at T, R, H, N, and P of 750℃, 25 L/min, and 50℃/min for slow pyrolysis of Bamboo and 46.41 wt% at the T of 450℃, N of 25 L/min, and H of 10℃/min for intermediate pyrolysis of Napier grass. This optimal value recorded was higher than 26.2 wt% at 450℃ reported by Gautam and Chaurasia [17] for fast pyrolysis of Bamboo. The biochar yield decreased from 27.1 to 41.1 wt% with increasing temperature due to complete pyrolysis process caused by rapid emission of volatile matters and thermal decomposition of the biomass, thereby, enhancing the yields of aromatic compounds Sahoo et al. [14] and Zhang et al. [43]. The minimum biochar yields of 25.6 wt% was obtained at the T of 720℃, R of 25 min, H of 7.5℃/min, N of 225 cm3/min, and P of 0.1 mm.
Table 2. Experimental design matrix and the corresponding biochar yield
|
Run |
Factor A: temperature(℃) |
Factor B: reaction time(min) |
Factor C: Heating rate(℃/min) |
Factor D: Nitrogen flow rate(cm3/min) |
Factor E: Particle size(mm) |
Response 1: Biochar(w%) |
|
1 |
520 |
10 |
17.5 |
125 |
0.5 |
33.3 |
|
2 |
520 |
15 |
17.5 |
125 |
0.5 |
33.3 |
|
3 |
520 |
5 |
17.5 |
125 |
0.5 |
32.4 |
|
4 |
720 |
25 |
27.5 |
225 |
0.1 |
28.4 |
|
5 |
320 |
5 |
7.5 |
25 |
0.9 |
41.1 |
|
6 |
520 |
15 |
17.5 |
125 |
0.5 |
33.2 |
|
7 |
520 |
15 |
12.5 |
125 |
0.5 |
33.4 |
|
8 |
720 |
5 |
7.5 |
25 |
0.9 |
29.4 |
|
9 |
720 |
5 |
27.5 |
25 |
0.9 |
28.4 |
|
10 |
320 |
25 |
27.5 |
25 |
0.9 |
38.3 |
|
11 |
320 |
25 |
27.5 |
25 |
0.1 |
37.2 |
|
12 |
420 |
15 |
17.5 |
125 |
0.5 |
35.8 |
|
13 |
520 |
15 |
17.5 |
125 |
0.5 |
33.3 |
|
14 |
320 |
5 |
7.5 |
25 |
0.1 |
40.6 |
|
15 |
320 |
25 |
7.5 |
25 |
0.1 |
38.6 |
|
16 |
520 |
15 |
17.5 |
75 |
0.5 |
34.2 |
|
17 |
720 |
25 |
27.5 |
225 |
0.9 |
27.4 |
|
18 |
720 |
25 |
7.5 |
225 |
0.1 |
25.6 |
|
19 |
320 |
5 |
27.5 |
25 |
0.1 |
38.8 |
|
20 |
320 |
25 |
27.5 |
225 |
0.9 |
39.1 |
|
21 |
520 |
15 |
17.5 |
125 |
0.5 |
32.9 |
|
22 |
320 |
5 |
27.5 |
25 |
0.9 |
40.1 |
|
23 |
720 |
5 |
27.5 |
225 |
0.9 |
29.6 |
|
24 |
320 |
25 |
7.5 |
25 |
0.9 |
40.3 |
|
25 |
520 |
15 |
17.5 |
125 |
0.3 |
32.7 |
|
26 |
720 |
5 |
27.5 |
225 |
0.1 |
28.5 |
|
27 |
320 |
5 |
7.5 |
225 |
0.9 |
40 |
|
28 |
520 |
15 |
17.5 |
125 |
0.5 |
33.6 |
|
29 |
520 |
15 |
22.5 |
175 |
0.7 |
32.4 |
|
30 |
720 |
5 |
27.5 |
25 |
0.1 |
27.6 |
|
31 |
720 |
25 |
7.5 |
25 |
0.9 |
28.5 |
|
32 |
520 |
15 |
17.5 |
125 |
0.5 |
32.9 |
|
33 |
320 |
5 |
7.5 |
225 |
0.1 |
38.9 |
|
34 |
520 |
15 |
17.5 |
25 |
0.5 |
33.6 |
|
35 |
720 |
25 |
27.5 |
25 |
0.1 |
27.4 |
|
36 |
320 |
25 |
7.5 |
225 |
0.1 |
37.3 |
|
37 |
620 |
15 |
17.5 |
125 |
0.5 |
33.1 |
|
38 |
720 |
25 |
7.5 |
25 |
0.1 |
29.5 |
|
39 |
520 |
15 |
17.5 |
125 |
0.5 |
32.4 |
|
40 |
720 |
5 |
7.5 |
225 |
0.1 |
27.1 |
|
41 |
520 |
15 |
17.5 |
225 |
0.5 |
32.1 |
|
42 |
720 |
5 |
7.5 |
25 |
0.1 |
29.6 |
|
43 |
320 |
5 |
27.5 |
225 |
0.1 |
37.7 |
|
44 |
320 |
5 |
27.5 |
225 |
0.9 |
37.7 |
|
45 |
320 |
25 |
7.5 |
225 |
0.9 |
38.6 |
|
46 |
720 |
25 |
7.5 |
225 |
0.9 |
26.1 |
|
47 |
720 |
20 |
7.5 |
225 |
0.9 |
28.5 |
|
48 |
720 |
25 |
27.5 |
25 |
0.9 |
27.5 |
|
49 |
520 |
15 |
17.5 |
125 |
0.5 |
33.1 |
|
50 |
320 |
25 |
27.5 |
225 |
0.1 |
36.8 |
3.2 Statistical models for biochar yield
Table 3 depicts the summary of the ANOVA for the response surface second-order model, while Eq. (6) shows the mathematical model used to predicts biochar yield in terms of coded factors.
Table 3. Analysis of variance (ANOVA) for the biochar yield
|
Source |
SS |
DF |
MS |
F-value |
P-value |
Remark |
|
Model |
1298.16 |
10 |
129.66 |
340.53 |
<0.0001 |
Sig. |
|
A-Temperature |
1261.11 |
1 |
1261.11 |
3312.07 |
<0.0001 |
Sig. |
|
B-Reaction time |
6.34 |
1 |
6.34 |
16.64 |
<0.0001 |
Sig. |
|
C-Heating rate |
7.49 |
1 |
7.49 |
19.67 |
<0.0001 |
Sig. |
|
D-N2 flow rate |
6.87 |
1 |
6.87 |
18.04 |
<0.0001 |
Sig. |
|
E-Particle size |
4.39 |
1 |
4.39 |
11.54 |
0.002 |
Sig. |
|
A2 |
2.94 |
1 |
2.94 |
7.72 |
0.0008 |
Sig. |
|
B2 |
1.11 |
1 |
1.11 |
2.92 |
0.095 |
Not Sig. |
|
C2 |
0.94 |
1 |
0.94 |
2.46 |
0.125 |
Not Sig. |
|
AE |
1.32 |
1 |
1.32 |
3.47 |
0.07 |
Sig. |
|
BD |
2 |
1 |
2 |
4.14 |
0.048 |
Sig. |
|
Residual |
14.85 |
39 |
0.38 |
|||
|
Lack of fit |
13.94 |
32 |
0.44 |
3.36 |
0.051 |
Not Sig. |
|
Pure error |
0.91 |
7 |
0.13 |
|||
|
Cor Total |
1313.01 |
49 |
|
|
|
|
|
R2 =98.87%; Adjusted R2 =97.81%; Predicted R2=85.18%; CV%=5.46 **SS- Sum of square; DF-Degree of freedom; MS-Mean square Sig.- Significant |
||||||
$\begin{gathered}Y_{B C(P K S)}=50.16-0.03474 A-0.0478 B- 0.0320 C-0.00489 D+2.30 E+0.00009 A^2- 0.00268 A \times E-0.000007 B \times D\end{gathered}$ (6)
where, YBC(PKS), YBC(SUG), YBC(SHEA) are the responses of the biochar yield (wt%) for PKS. A, B, C, D, E refers to the coded value of T (℃), R (min), H (℃/min), N (cm3/min), and P (mm) respectively.
The Fischer test (F-value), which indicates the comparisons between the mean square values of the developed regression model and that of the residuals (i.e., error), and the probability value (p-value) obtained from the regression model analysis were found reliable and acceptable Hossain et al. [19]; and Kumar et al. [29]. The level of acceptability and reliability of the F-value is dependent on the F-value, the higher the F-value, the more responsive, reproductive, and reliable the regression model. Likewise, the p-value should be significantly low so as to produce a reliable model Lee et al. [28] and Nizamuddin et al. [44]. The generated regression model has a higher F-value of 340.53 and a lower p-value (less than 0.05) for all the biomass under investigation, indicating that it is significant. Due to noise, there is a slim chance of 0.01% that a large F-value model will occur (Hassain et al., 2017). A, B, C, D, E, A2, AE, and BD were all found to be significant model terms. Hence, they positively influence biochar yield. The lack of Fit values of 0.051 indicates that the mathematical model generated can predict and reproduce the experimental data.
The coefficient of variation (CV%) is the error expressed as a percentage of the mean. Generally, the model is considered reproducible if the CV% is low (10%). The R-value, which is the coefficient of determination for the regression model, should be close to 1, which satisfies the criteria for a good model Hossain et al. [19]. The biochar CV% yield was determined to be 5.46%, which is a low value. As a result, the model under investigation can be replicated. The biochar yield has an R2 value of 0.9887, which is likewise extremely near 1. As a result, the mathematical model under investigation is reliable and can accurately reproduce biochar yield experimental data. The adjusted R2 specifies the amount of variation that can be described by the model; this implies that, the R2 value represents the adjusted number of terms in the regression model relative to the number of design points. The predicted R2 shows the amount of variation in the new data explained by the model. To have a reasonable agreement, the difference between the adjusted and predicted R2 should be less than 0.20, according to Laouge et al. [8] and Lee et al. [28]. This study's biochar yield’s R2 value is 0.9887, which is significantly close to 1. Thus, the considered mathematical model employed in this study is good and can reproduce the experimental data for biochar yield. The difference between the adjusted R2 (0.9781) and projected R2 (0.8518) for biochar yield is 0.13. As a result, they have reached a sensible arrangement that makes the model responsive, reliable, and capable of replicating the experimental data.
3.3 Influence of pyrolysis operating parameters on products of pyrolysis
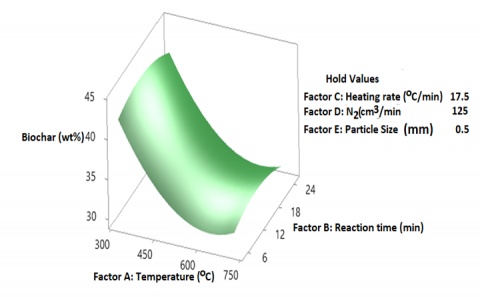
Figures (2-4) show the combined effect of the two most essential operating factors that are significant to biochar yields, which are presented in Figures (2-5). Optimum biochar yield (43.3 wt%) was attained at constant N (125 cm3/min), H (17.5℃/min), and P (0.5 mm), due to an incomplete thermal decomposition of the biomass in the reactor. Secondary cracking reactions and rapid emission of volatile matter resulted in a significant decrease in biochar yields with further increases in T and R (10 min) (Figure 2). These results correlated very well with the findings reported by Sahoo et al. [14], Varma and Mondal [31], and Zhang et al. [43].
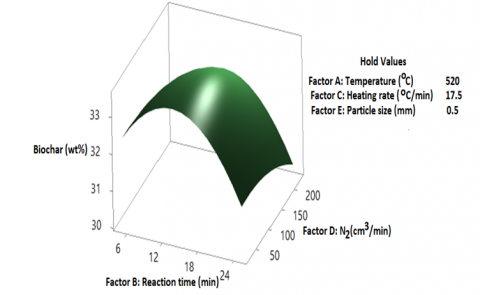
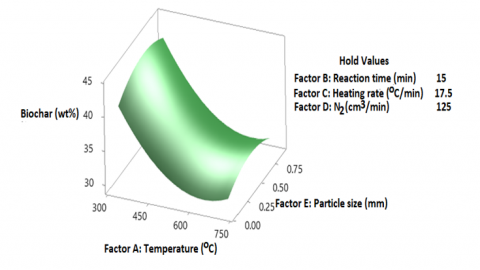
The interactive effect of reaction time and nitrogen flow rate on biochar yield is shown in Figure 3. At constant temperatures T (520℃), H (17.5 oC/min), and P (0.5 mm), an optimum biochar yield (32.7 wt%) was obtained. The biochar conversion decreased from 32.2 to 29.2 wt% with a continuous increase in R (5 to 25 min) and N (25 to 225 cm3/min) due to an increase in secondary reactions such as thermal cracking, re-polymerization, and re-condensation of vapour Varma and Mondal [31]. Figure 4 shows the interactive effect of temperature and particle size on biochar yield. An increase in particle size at low temperatures increases the biochar yield due to incomplete pyrolysis, lesser thermal cracking, and low heat transfer generated by a greater temperature difference in the biomass. Maximum biochar conversion (41.3 wt%) was achieved at constant R (15 minutes), H (17.5℃/min), and N (125 cm3/min). This research supports the findings of Gautam and Chaurasia [17] and Hassain et al. [19].
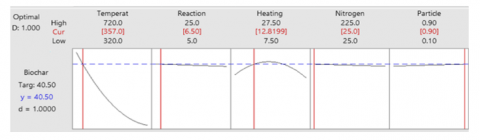
3.4 Optimized value of pyrolysis operating parameters for biochar
The optimization plot obtained from the response surface model (Figure 5) determines the values of the operating parameters required for an optimal yield of biochar. The plots generate the maximum, minimum, and optimal production of products of pyrolysis via the interaction of all the parameters. Results showed that varying the T, R, H, N, and P had a great effect on products of pyrolysis. It can be deduced that for optimum biochar yield (40.5 wt%) was attained at T (357℃), R (6.5 min), H (12.8℃/min), N (25 cm3/min) and P (0.9 mm). Any values outside of this range will reduce biochar yields. An increase in temperature from 320 to 720℃ reduced the biomass yield from 40.5 to 27.3 wt% due to complete pyrolysis process reading to excessive emission of volatile matter and thermal breakdown of biomass.
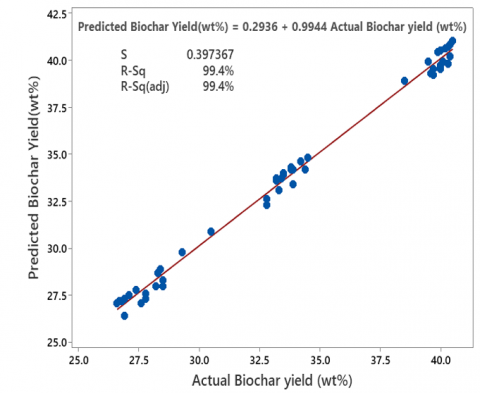
The predicted values closely packed around the regression line (Figure 6), which is similar to the findings of that of Hossain et al. [19]. The experimental and predicted values for biochar yield are in agreement. Hence, the model and reproduced the experimental results accurately.
Figure 2. Combined effect of temperature and reaction time for biochar yield
Figure 3. Combined effect of reaction time and nitrogen flow rate for biochar yield
Figure 4. Combined effect of temperature and particle size for biochar yield
Figure 5. Optimization plot
Figure 6. Actual and predicted for Biochar yield
3.5 SEM analysis of biochar from PKS
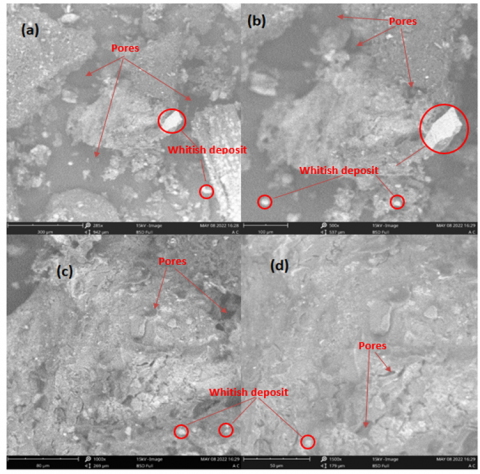
The surface morphology is presented in Figure 7 using specifications of (285x, 400x, 500x, 1000x, 1500x) obtained at optimized conditions. The biochar possessed an heterogenous porosity with cleave structure due to the emission of high volatile matter an aromatic structure during the pyrolysis process Sahoo et al. [14] and Varma and Mondal [31]. An increase in the porosity enhanced the surface area and adsorptive capacity of the biochar. Hence, increasing the space for water, pollutant and nutrient retention Sahoo et al. [14].
Figure 7. SEM Analysis of PKS (a) 300x; (b) 500x; (c) 1000x; (d)1500x
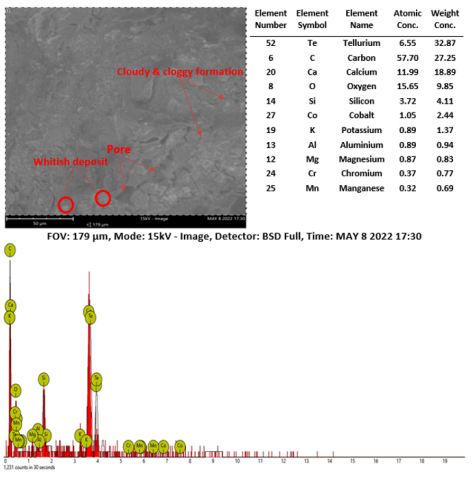
3.6 SEM/EDX Analysis of biochar yield from PKS
The SEM/EDX analysis for the biochar is shown in Figure 8. The biochar possessed a cloudy and clogging formation, and the presence of inorganic materials such as tellurium, carbon, calcium, oxygen, silicon, cobalt, potassium, aluminum, magnesium, chromium, and manganese were noticed. Carbon and oxygen are valuable for energy generation and the pharmaceutical industry Oyebanji et al. [9] and whereas magnesium, iron, potassium, aluminum, silicon, and calcium are critical elements for soil fertility and agricultural production Varma and Mondal [31]. The biochar also contains sodium, carbon, oxygen, manganese, and cobalt, which can be applicable in energy-generating devices such as fuel cells, super capacitors, and batteries [34], Haggstrom and Delsing [45], and Xiong et al. [46].
Figure 8. SEM/EDX analysis of biochar from PKS
3.7 FT-IR spectrum analysis of biochar from PKS
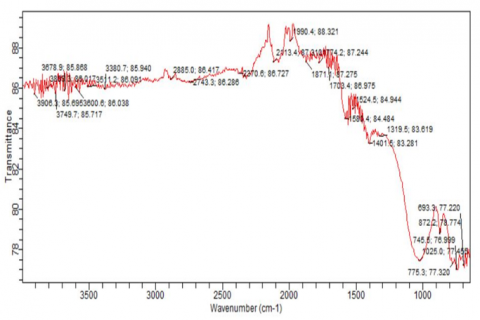
As shown in Figure 9, the FT-IR spectra of biochar yields shows the number of peaks with low, medium, and high intensity, indicating the complex nature of biochar produced over a wavelength range of 500–4,000 cm-1, while Table 4 presents the functional group, molecular weight, transmittance, and appearance extracted from Figure 7 via the FT-IR chart. The most noticeable peak at 3,906.3, 3,809.3, 3,749.7, 3,649.7, 3,678.9, and 3,600.6 cm-1, caused by O-H stretching vibrations, indicates the presence of alcohol. Mohammed et al. [1] and Varma and Mondal [31]. The presence of oxygen-containing functional groups of the O-H bending bond, such as carbon dioxide, carboxylic acid, phenol, and ester, was confirmed by the low intensity peaks between wavenumbers 1,520 and 1,320 cm-1 Saikia et al. [47]. Alcohol can be used as boiler and engine fuel, according to Gautam and Chaurasia [17]. Aldehyde is present when low intensity peaks in the range of 2,740–2,750 cm-1 are caused by C-H stretching vibration Saikia et al. [47]. The presence of alkynes and alkenes in biochar is indicated by high intensity peaks at 2,113.4 and 19,904.4 cm-1 attributable to C=C stretching vibration, while the medium intensity peaks at 1,703.4 and 1,871.1 cm-1 are derived from aliphatic ketones and aromatics due to C=O and C-H functional. A strong peak at 1,524.5 cm-1 with a N-O symmetry was seen, suggesting the presence of nitro compounds, whereas wave number 1,025 cm-1 with a C-N bend was discovered, indicating the presence of amine compounds. The alkene C-C has a very low intensity peak between 770 cm-1, whereas a halo compound with C-Cl bending vibrations has a wavenumber of 870 cm-1. It has been discovered that biochar considerably loses hydroxyl and aliphatic groups while gaining an aromatic character. Nylon and synthetic fiber, plywood adhesives, and the automotive and appliance sectors all employ phenols. In the petrochemical sector and as fuel, aromatic and aliphatic hydrocarbons are used [17].
Figure 9. Average FTIR spectra of biochar from PKS
Table 4. Functional group composition of biochar from PKS
|
Functional group |
Wave length (cm-1) |
Molecular motion |
% Transmittance |
Appearance |
|
|
Range |
Actual |
||||
|
Alcohol |
3900-3920 |
3906.3 |
O-H stretch |
85.695 |
Medium Sharp |
|
Alcohol |
3800-3820 |
3809.3 |
O-H stretch |
86.017 |
Medium Sharp |
|
Alcohol |
3750-3780 |
3749.7 |
O-H stretch |
85.717 |
Medium Sharp |
|
Alcohol |
3670-3710 |
3678.9 |
O-H stretch |
85.868 |
Medium Sharp |
|
Alcohol |
3595-3610 |
3600.6 |
O-H stretch |
86.038 |
Medium Sharp |
|
Aliphatic primary amine |
3350-3400 |
3380.7 |
N-H stretch |
85.94 |
Medium |
|
Carboxylic acid |
2880-2900 |
2885 |
O-H stretch |
86.417 |
Strong Broad |
|
Aldehyde |
2740-2750 |
2743.3 |
C-H stretch |
86.288 |
Medium |
|
Carbon dioxide |
2365-2380 |
2370.6 |
O=C=O stretch |
86.727 |
Strong |
|
Alkyne |
2110-2120 |
2113.4 |
C=C stretch |
87.31 |
Weak |
|
Alkene |
1990-2000 |
1990.4 |
C=C stretch |
88.321 |
Medium |
|
Aromatic compound |
1865-1875 |
1871.1 |
C-H bending |
87.275 |
Weak |
|
Vinyl/phenyl Esther |
1770-1785 |
1774.2 |
C=O stretch |
87.244 |
Strong |
|
Aliphatic Ketone |
1695-1710 |
1703.4 |
C=O stretch |
86.975 |
Strong |
|
Cyclic Alkene |
1575-1585 |
1580.4 |
C=C stretch |
84.484 |
Medium |
|
Nitro Compound |
1520-1535 |
1524.5 |
N-O stretch |
84.944 |
Strong |
|
Carboxylic Acid |
1390-1410 |
1401.5 |
O-H bending |
83.281 |
Medium |
|
Phenol |
1315-1320 |
1319.5 |
O-H bending |
83.619 |
Strong |
|
Amine |
1020-1027 |
1025 |
C-N stretch |
77.455 |
Medium |
|
Alkene |
870-875 |
872.2 |
C=C bending |
78.774 |
Strong |
|
Alkene |
770-779 |
775.3 |
C=C bending |
77.32 |
Strong |
|
Halo Compound |
740-749 |
745.5 |
C-Cl stretch |
78.999 |
Strong |
|
1,4-disubstituted |
690-695 |
693.3 |
C-H bending |
77.22 |
Strong |
This study utilized response surface methodology (RSM) to model and optimize pyrolysis operating parameters for improving biochar yield. Results obtained showed that temperature, heating rate, reaction time, nitrogen flow rate, and particle size greatly influenced biochar yield. Optimum biochar yield (40.5 wt%) was attained at temperature (357℃) reaction time (6.5 min), heating rate (12.8℃/min), nitrogen flow rate (25 cm3/min) and particle size (0.9 mm). The minimum biochar yields of 25.6 wt% were obtained at T=720℃, R=25 min, H=7.5℃/min, N=225 cm3/min, and P=0.1 mm. The FTIR and GC-MS analyses showed the presence of alkynes, alkenes, carbon dioxide, carboxylic acid, phenol, and ester, which can be attributed to C–H, C=C, alcohols, and phenolic compounds, indicating that the biochar could potentially be used as fuel. The EDX analysis showed the presence of inorganic materials that can be used in energy-generating devices such as fuel cells, super capacitors, and batteries.
[1] Mohammed, I.Y., Abakr, Y.A., Yusup, S., Kazi, F.K. (2017). Valorization of Napier grass via intermediate pyrolysis: Optimization using response surface methodology and pyrolysis products characterization. Journal of Cleaner Production, 142: 1848-1866. https://doi.org/10.1016/j.jclepro.2016.11.099
[2] Onokwai, A.O., Okokpujie, I.P., Ibiwoye, M.O., Owamah, H.I., Ayuba, G.C. Dirisu, J.O. (2022). Effect of thermal and flow properties on the performance of Jebba Hydro-Power Plant, Jebba, Nigeria. Materials Today: Proceedings, 65: 2245-2253. https://doi.org/10.1016/j.matpr.2022.06.342
[3] Onokwai, A.O., Ajisegiri, E.S.A., Okokpujie, I.P., Ibikunle, R.A., Oki, M., Dirisu, J.O. (2022). Characterization of lignocellulose biomass based on proximate, ultimate, structural composition, and thermal analysis. Materials Today: Proceedings, 65: 2156-2162. https://doi.org/10.1016/j.matpr.2022.05.313
[4] Abomohra, A.E., Sheikh, H.M.A., El-Naggar, A.H., Wang, Q. (2021). Microwave vacuum co-pyrolysis of waste plastic and seaweeds for enhanced crude bio-oil recovery: Experimental and feasibility study towards industrialization. Renewable and Sustainable Energy Review, 149: 111335. https://doi.org/10.1016/j.rser.2021.111335
[5] Nnodim, C.T., Kpu, G.C., Okhuegbe, S.N., Ajani, A.A., Adebayo, S., Diarah, R.S., Aliyu, S.J., Onokwai, A.O, Osueke, C.O. (2022). Figures of merit for wind and solar PV integration in electricity grids. Journal of Scientific and Industrial Research, 81(4): 349-357. https://doi.org/10.56042/jsir.v81i04.49357
[6] Fahmy, T.Y.A., Fahmy, Y., Mobarak, F., El-Sakhawy, M and Abou-Zeid, R.E. (2020). Biomass pyrolysis: Past, present, and future. Environment, Development and Sustainability, 22: 17-32. https://doi.org/10.1007/s10668-018-0200-5
[7] Dhanavath, K.N., Bankupalli, S., Sugali, C.S., Perupogu, V., Nandury, S.V., Bhargava, S., Parthasarathy, R. (2019). Optimization of process parameters for slow pyrolysis of neem press seed cake for liquid and char production. Journal of Environmental Chemical Engineering, 7(1): 102905. https://doi.org/10.1016/j.jece.2019.102905
[8] Laouge, Z.B., Çığgın, A.S., Merdun, H. (2020). Optimization and characterization of bio-oil from fast pyrolysis of Pearl Millet and Sida cordifolia L. by using response surface methodology. Fuel, 274: 117842. https://doi.org/10.1016/j.fuel.2020.117842
[9] Oyebanji, J.A., Fayomi, O.S.I., Oyeniyi, O.I., Akor, P.G., Ajayi, S.T. (2022). Physico-chemical analysis of pyrolyzed bio-oil from Lophira alata (Ironwood) wood. Journal of Environmental Pollution and Management, 4: 101.
[10] Onokwai, A.O., Okokpujie, I.P., Ajisegiri, E.S., Oki, M., Adeoyeb, A.O., Akinlabi, E.T. (2022). Characterization of lignocellulosic biomass samples in omu-aran metropolis, kwara state, nigeria, as potential fuel for pyrolysis yields. International Journal of Renewable Energy Development, 11(4): 973-981. https://doi.org/10.14710/ijred.2022.45549
[11] Acevedo, J.C., Solano, S.P., Durán, J.M., Posso, F.R., Arenas, E. (2019). Estimation of potential hydrogen production from palm kernel shell in Norte de Santander, Colombia. Journal of Physics: Conference Series, 1386(1): 012093. https://doi.org/10.1088/1742-6596/1386/1/0120931
[12] Waluyo, J., Makertithartha, I.G., Susanto, H. (2021). Pyrolysis with intermediate heating rate of palm kernel shells: Effect temperature and catalyst on product distribution. AIP Conference Proceedings, 1977(1): 020026. https://doi.org/10.1063/1.5042882
[13] Onochie, U.P., Obanor, A.I., Aliu, S.A., Ighodaro, O.O. (2017). Proximate and ultimate analysis of fuel pellets from oil palm residues. Nigeria Journal of Technology, 36(3): 987-990. https://doi.org/10.4314/njt.v36i3.44
[14] Sahoo, S.S., Vijay, V.K., Chandra, R., Kumar, H. (2021). Production and characterization of biochar produced from slow pyrolysis of pigeon pea stalk and bamboo. Cleaner Engineering and Technology, 3: 100101. https://doi.org/10.1016/j.clet.2021.100101
[15] Balogun, A.O., Lasode, O.A., Onokwai, A.O., Ezugwu, C.A., Olayanju, T.M.A., Osueke, C.O. (2019). Elemental analysis and combustion characteristics evaluation of Nigeria biomass resources. International Journal of Mechanical Engineering and Technology, 10(2): 1522-1527.
[16] Morgano, M.T., Bergfeldt, B., Leibold, H., Richter, F., Stapf., D. (2018). Intermediate pyrolysis of agricultural waste: a decentral approach towards a circular economy. Chemical Engineering Transactions, 65: 649-654. https://doi.org/10.3303/CET1865109
[17] Gautam, N., Chaurasia, A. (2020). Study on kinetics and bio-oil production from rice husk, rice straw, bamboo, sugarcane bagasse and neem bark in a fixed-bed pyrolysis process. Energy, 190: 116434. https://doi.org/10.1016/j.energy.2019.116434
[18] Oyebanji, J.A., Okekunle, P.O., Oyedepo, S.O., Fayomi, O.S.I. (2021). Characterization of liquid and solid products from pyrolysis of terminalia ivorensis. IOP Conference Series: Materials Science and Engineering, 1107(1): 012127. https://doi.org/10.1088/1757-899X/1107/1/012127
[19] Hossain, M.A., Ganesan, P., Jewaratnam, J., Chinna, K. (2017). Optimization of process parameters for microwave pyrolysis of oil palm fiber (OPF) for hydrogen and biochar production. Energy Conversion and Management, 133: 349-362. https://doi.org/10.1016/j.enconman.2016.10.046
[20] Salina, F.H., Molina, F.B., Gallego, A.G., Palacios-Bereche, R. (2021). Fast pyrolysis of sugarcane straw and its integration into the conventional ethanol production process through Pinch Analysis. Energy, 107: 2411-2502. http://doi.org/10.1016/j.energy.2020.119066
[21] Zaman, C.Z., Pal, K., Yehye, W.A., Sagadevan, S., Shah, S.T., Adebisi, G.A., Johan, R.B. (2017). Pyrolysis: A sustainable way to generate energy from waste, Chapter Metrics Overview, 1: 316806.
[22] Palamanit, A., Khongphakdi, P., Tirawanichakul, Y., Phusunti, N. (2019). Investigation of yields and qualities of pyrolysis products obtained from oil palm biomass using anagitated bed pyrolysis reactor. Biofuel Research Journal, 6(4): 1065. https://doi.org/10.18331/BRJ2019.6.4.3
[23] Kuhe, A., Aliyu, S.J. (2015). Gasification of loose groundnut shells in a throathless downdraft gasifier. International Journal of Renewable Energy, 4(2): 125-130. https://doi.org/10.14710/ijred.4.2.125-130
[24] Guedes, R.E., Lunaa, A.S., Torres, A.R. (2018). Operating parameters for bio-oil production in biomass pyrolysis: A review. Journal of Analytical and Applied Pyrolysis, 129: 134-149. https://doi.org/10.1016/j.jaap.2017.11.019
[25] Barik, D. (2019). Energy extraction from toxic waste originating from food processing industries. Woodhead Publishing Series in Energy, 17-42. https://doi.ord/10.1016/B978-0-08-102528-4.00003-1
[26] Cai, N., Zhang, H., Nie, J., Deng, Y., Baeyens, J. (2020). Biochar from biomass slow pyrolysis. 2020 2nd International Conference on Environment Sciences and Renewable, Vienna, Austria, http://dx.doi.org/10.1088/1755-1315/586/1/012001
[27] Kazawadi, D., Ntalikwa, J., Kombe, G. (2021). A review of intermediate pyrolysis as a technology of biomass conversion for coproduction of bio-oil and adsorption biochar. Journal of Renewable Energy, 2021: 1-10. https://doi.org/101155/2021/5533780
[28] Lee, X.J., Lee, L.Y., Hiew, B.Y.Z., Gan, S., Thangalazhy-Gopakumar, S., Ng, H.K. (2017). Multistage optimization of slow pyrolysis synthesis of biochar palm oil sludge for adsorption of lead. Bioresources Technology, 245: 944-953. https://doi.org/10.1016/j.biortech.2017.08.175
[29] Kumar, M., Mishra, P.K., Upadhyay, S.N. (2019). Pyrolysis of saccharum munja: Optimization of process parameters using response surface methodology (RSM) and evaluation of kinetic parameters, Bioresource Technology Reports, 8: 100332. https://doi.org/10.1016/j.biteb.2019.100332
[30] Onokwai, A.O., Owamah, H.I., Ibiwoye, M., Ayuba, G. (2022d). Application of response surface methodology (rsm) for the optimization of energy generation from jebba hydro-power plant, Nigeria. ISH Journal of Hydraulic Engineering, Taylor and Francis, 28(10): 1-9. https://doi.org/10.1080/09715010.2020.1806120
[31] Varma, A.K., Mondal, P. (2017). Pyrolysis of sugarcane bagasse in semi-batch reactor: Effects of process parameters on product yields and characterization of products. Industrial Crops and Products, 95: 704-717. https://doi.org/10.1016/j.indcrop.2016.11.039
[32] Savasari, M., Emadi, M., Bahmanyar, M.A., Biparva, P. (2015). Optimization of Cd (II) removal from aqueous solution by ascorbic acid-stabilized zero-valent iron nanoparticles using response surface methodology. Journal of Industrial and Engineering Chemistry, 21: 1403-1409. https://doi.org/10.1016/j.jiec.2014.06.014
[33] Hassan, S.N.A., Ishak, M.A., Ismail, K. (2017). Optimizing the physical parameters to achieve maximum products from co-liquefaction using response surface methodology. Fuel, 207: 102-108. https://doi.org/10.1016/j.fuel.2017.06.077
[34] Kumar, A., Bhattacharya, T., Hasnain, M., Nayak, A.K., Hasnain, S. (2020). Applications of biomass-derived materials for energy production, conversion and storage. Material Science for Energy Technologies, 3: 905-920. https://doi.org/10.1016/j.mset.2020.10.012
[35] Tripathi, M., Bhatnagar, A., Mubarak, N.M., Sahu, J.N., Ganesan, P. (2020). RSM optimization of microwave pyrolysis parameters to produce OPS char with high yield and large BET surface area. Fuel, 277: 118184. https://doi.org/10.1016/j.fuel.2020.118184
[36] Kshirsagar, M.P., Kalamkar, V.R. (2020). Application of multi-response robust parameter design for performance optimization of a hybrid draft biomass cook stove. Renewable Energy, 153: 1127-1139. https://doi.org/10.1016/j.renene.2020.02.049
[37] Okoroigwe, E.C., Saffron, C.M., Kamdem, P.D. (2014). Characterization of palm kernel shell for materials reinforcement and water treatment. Journal of Chemical Engineering and Materials Science, 5(1): 1-6. https://doi.org/10.5897/JCEMS2014.0172
[38] Baffour-Awuah, E., Akinlabi, S.A., Jen, T.C., Hassan, S., Okokpujie, I.P., Ishola, F. (2021). Characteristics of palm kernel shell and palm kernel shell-polymer composites: A review. IOP Conference Series: Materials Science and Engineering, 1107(1): 012090. https://doi.org/10.1088/1757-899X/1107/1/012090
[39] Ayeni, A.O., Daramola, M.O., Awoyomi, A., Elehinafe, F.B., Ogunbiyi, A., Sekoai, P.T., Folayan, J.A. (2018). Morphological modification of Chromolaena odorata cellulosic biomass using alkaline peroxide oxidation pretreatment methodology and its enzymatic conversion to biobased products. Cogent Engineering, 5(1): 1509663. https://doi.org/10.1080/23311916.2018.1509663
[40] Nagarajan, J., Prakash, L. (2021). Preparation and characterization of biomass briquettes using sugarcane bagasse, corncob and rice husk. Materials Today: Proceedings, 47: 4194-4198. https://doi.org/10.1016/j.matpr.2021.04.457
[41] Ghysels, S., Acosta, N., Estrada, A., Pala, M., De Vrieze, J., Ronsse, F., Rabaey, K. (2020). Integrating anaerobic digestion and slow pyrolysis improves the product portfolio of a cocoa waste biorefinery. Sustainable Energy & Fuels, 4(7): 3712-3725. https://doi.org/10.1039/D0SE00689K
[42] Tomczyk, A., Sokołowska, Z., Boguta, P. (2020). Biochar physicochemical properties: Pyrolysis temperature and feedstock kind effects. Reviews in Environmental Science and Bio/Technology, 19: 191-215. https://doi.org/10.1007/s11157-020-09523-3
[43] Zhang, Y., Ma, Z., Zhang, Q., Wang, J., Ma, Q., Yang, Y., Luo, X., Zhang, W. (2017). Comparison of the physicochemical characteristics of bio-char pyrolyzed from moso bamboo and rice husk with different pyrolysis temperatures. BioResources, 12(3): 4652-4669.
[44] Nizamuddin, S., Mubarak, N., Tiripathi, M., Jayakumar, N., Sahu, J. (2016). Ganesan P. Chemical, dielectric and structural characterization of optimized hydrochar produced from hydrothermal carbonization of palm shell. Fuel, 163: 88-97. https://doi.org/10.1016/j.fuel.2015.08.057
[45] Haggstrom, F., Delsing, J. (2018). IOT energy storage- a forecast. Energy Harvesting and Systems, 5(3-4): 43-51.
[46] Xiong, Q., Xu, F., Ramirez, E., Pannala, S., Daw, C.S. (2016). Modeling the impact of bubbling bed hydrodynamics on tar yield and its fluctuations during biomass fast pyrolysis. Fuel, 164: 11-17. https://doi.org/10.1016/j.fuel.2015.09.074
[47] Saikia, R., Chutia, R.S., Kataki, R., Pant, K.K. (2015). Perennial grass (Arundodonax L.) as a feedstock for thermo-chemical conversion to energy and materials. Bioresource Technology, 188: 265-272. https://doi.org/10.1016/j.biortech.2015.01.089