Aeri Rachmad*![]() | Muhammad Fuad
| Muhammad Fuad![]() | Eka Mala Sari Rochman
| Eka Mala Sari Rochman![]()
© 2023 IIETA. This article is published by IIETA and is licensed under the CC BY 4.0 license (http://creativecommons.org/licenses/by/4.0/).
OPEN ACCESS
The decline in corn production can affect the continuity of food grown in society, especially in Indonesia, which is a country with a high level of corn consumers. Several factors cause a decrease in the production of corn plants, one of which is unhealthy plants so that their growth slows down and even makes the corn plants not bear fruit or are damaged. Therefore, a system is needed that can identify diseases in corn plants so that appropriate treatment can be carried out as early as possible to prevent severe damage to corn plants. With this research, the system can be built by utilizing machine learning in building a classification system using the Convolutional Neural Network (CNN) algorithm with a dataset of corn leaf images taken from farmers' fields in the Madura Region with four target classes namely healthy, gray leaf spot, blight, and common rust. Testing was carried out using several CNN architectural models such as SqueezeNet, AlexNet, ResNet-101, ResNet-50, and ResNet-18. The parameters used were 5 epochs with 100 iterations, a learning rate of 0.0001, using Adam optimization, and a data distribution of 70% for training data and 30% for testing data. The test results obtained in classifying corn images using the Convolutional Neural Network method with the ResNet-50 architecture provide a very good accuracy value of 95.59%.
corn leaf disease, classification, convolutional neural network, ResNet-50
Corn is one of the staple foods that is consumed by many people besides rice and cassava, especially in Indonesia as a source of carbohydrates [1]. This high consumer demand requires the production of corn in large quantities to meet this need. If there is a decrease in the amount of production, this can affect market share which has a negative impact on society, especially in Indonesia, which is a country with a high level of corn consumers. There are several factors that cause a decrease in the production of corn plants, one of which is unhealthy plants so that their growth slows down and even makes the corn plants not bear fruit or are damaged resulting in the phenomenon of crop failure [2, 3].
In general, the disease that attacks corn plants is gray leaf spot, which is a disease on corn leaves that causes brownish yellow spots caused by the fungus Helminthoporium maydis [4], leaf blight disease or what is known as corn blight disease [4] and common rust disease, namely corn blight disease. leaf rust [5]. As a form of prevention so that harvest failure does not occur, monitoring corn plants for diseases that are susceptible to corn plants. Monitoring is still done manually so it requires more time and is inefficient. Based on these problems, the development of a digital image classification system was proposed as a solution in this research which aims to identify diseases in corn plants by categorizing corn plant leaves into classes that have certain characteristics [6].
Classification of diseases on corn leaves has also been studied by Ubaidillah et. all., who classified corn leaf diseases using machine learning using several methods such as Random Forest, Neural Network, and Naïve Bayes. The results obtained from this study resulted in an accuracy of 60.76% using Naïve Bayes, while the accuracy results using Random Fores were 69.76% and using Neural Networks were 74.44% [5].
Classification of digital images can be done using machine learning methods which are currently very popular, one of which is the Convolutional Neural Network (CNN). CNN is a method with deep learning concepts that are very good at classifying digital images [7]. The way this method works is to use a special architecture that develops every year starting with the LetNet architecture in 1998 until now it continues to vary, such as AlexNet, SqueezeNet, GoogleNet, VGGNet, ResNet, and so on [8]. The choice of architecture in classifying digital images is very necessary because it will provide different accuracy.
Several image studies have been carried out, such as disease classification on 9 crop class images using GoogleNet [9], and disease classification on 15 food crops using 5 convolutional layers [10]. Mohanty et al. classify 14 types of food crops with 26 types of diseases, including corn. The test uses a very large number of images, namely 54, 306 images. Classification results using two architectures (AlexNet and GoogleNet) produce an accuracy of 31.4% [11].
Therefore, in this study classification with CNN was carried out using several types of architectures namely SqueezeNet, AlexNet, ResNet-101, ResNet-50, and ResNet-18 to find out the compare of the five CNN architectures.
This study discusses the classification of corn leaf disease in the form of digital images. This image classification is a process to categorize an image into a certain class where each class has certain characteristics that represent that class. In classifying digital images, several main and supporting methods are needed to build an accurate classification system model. In this study, the Convolutional Network (CNN) method is used as the main method for classifying digital images and the Confusion Matrix method is used to evaluate the performance results of the classification method applied.
2.1 Convolutional Neural Network (CNN)
Convolutional Neural Network (CNN) is a part of deep learning that can classify digital images [10]. In addition to classifying digital images, the CNN method can be used in facial recognition, document analysis, video classification, and so on. The CNN method classifies digital images by processing the input images, then classifying them into certain target classes based on their features [12].
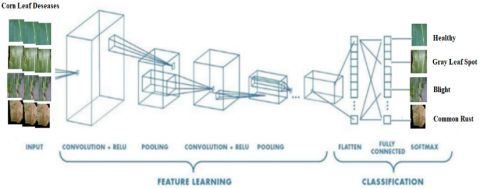
Based on Figure 1, the basic architecture of CNN consists of 2 main parts, namely Feature Learning and Classification [13]. Where, in feature learning, there is a process of encoding the input image to turn it into a feature in the form of a value that represents the image. In this section, there are several layers that are connected to each other to retrieve features from a digital image, namely the convolutional layer, rectified linear unit activation, and pooling layer. Then, in the classification section, a classification process occurs for each neuron that has been processed in the previous feature learning. In contrast to feature learning, in the classification section, there are several layers consisting of flattening, dropout regularization, fully connected layer, and softmax.
There are several types of CNN architectures that are commonly used in classifying digital images with the aim of optimizing the accuracy of the built models, as follows:
AlexNet
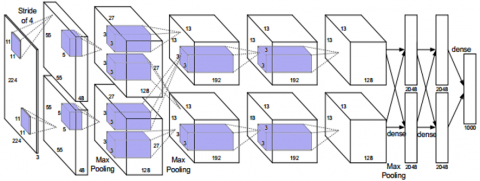
Alexnet is one of the CNN architectures that won the title in the 2012 ImageNet Large Scale Visual Recognition Challenge (ILSVRC) competition [14]. This architecture consists of five convolution layers, three pooling layers, two dropout layers, and three fully connected layers [15]. Here is an illustration of the AlexNet architecture in Figure 2.
Figure 1. CNN illustration
Figure 2. AlexNet
In the figure above, the AlexNet network architecture above has the first convolution size of 11 × 11, while in the second layer, it becomes 5 × 5. The next layer the size is 3 × 3. The Conv_1, Conv_2, and Conv_5 layers enter the max-pooling layer with size 3 × 3 using strides 2. after that, enter the fully connected layers with size 4096. The last layer is the output layer with 1000 output categories [7].
SqueezeNet
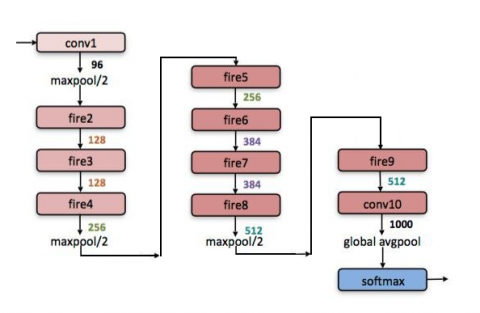
SqueezeNet is a CNN architecture that can achieve the accuracy of AlexNet, which incidentally won the ImageNet classification task in 2012 by using fewer parameters and fast training time [16]. The SqueezeNet architecture replaces several 3x3 convolution layers with 1x1 and filters are used less to shrink the dimensions of the activation map or called squeeze [17]. Then, proceed with the convolution layer process with more filters to enlarge the activation map again, or what is called the expanding process. In addition, this architecture also replaces the MLP layer with a squeeze layer and the Global Average Pool [18]. In Figure 3, The Global Average Pool is used to get the average of the last convolutional layer to determine the prediction class and the use of the global average pool in this architecture is able to avoid overfitting because it has no parameters.
Figure 3. SqueezeNet
Residual Neural Network (ResNet)
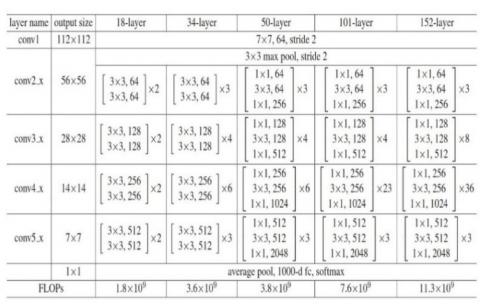
ResNet is a type of architecture on CNN that was first introduced in 2015. This architecture is a residual network that has a high level of network depth where the deepest network in this architecture totals 152 layers [16]. The high level of depth in the CNN architecture provides an important role in building the CNN model, which can increase the accuracy of the system. Therefore, this architecture is often applied in building digital image classification models. This architecture is available in various layer depths starting from 18, up to 152 layers. Here is the architecture and number of layers of ResNet in Figure 4.
Figure 4. ResNet
2.2 Confusion matrix
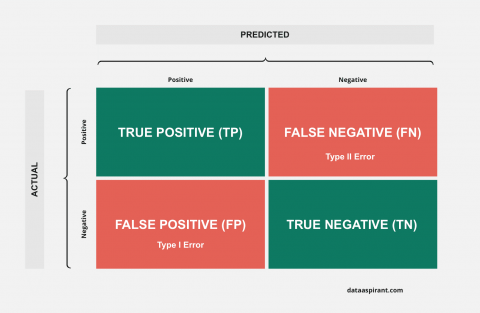
Model evaluation in this study uses the confusion matrix method. The confusion matrix is a method that can be used to measure the performance of the classification model from the learning process that has been carried out [19]. In the confusion matrix, the model performance results are displayed in a matrix form as shown in Figure 5 [20]. Based on the confusion matrix, there are 4 possible outcomes which are a comparison between the predicted classes resulting from the classification process and the actual class [21]. The four classes are true positive (TP), false positive (FP), false negative (FN), and true negative (TN).
Figure 5. Confusion matrix
With the confusion matrix, accuracy values can be generated. Accuracy itself is a value that represents the success rate of the model being built, where the higher the accuracy, the model can provide high accuracy. The calculation to find the accuracy value is done by adding up the true positive (TP) and true negative (TN) classes which are then divided by the total amount of data in each class, here is the formula for calculating the accuracy of the model built [22, 23]:
Accuracy $=\frac{T P+T N}{T P+T N+F P+F N}$ (1)
where:
TP : the number of correct data is predicted positive.
TN : the amount of data with the original class is positive but the predicted results are negative.
FN : number of correctly predicted negative data.
FP : the amount of data with the original class is negative but the prediction results are positive.
In general, the implementation of this research uses hardware in the form of a laptop with Windows 10 with 64 bits as the operating system. The detailed specifications of the laptop include Intel Core i5 Processor GPU 2.4 GHz and 8 GB RAM. The software used in this study is MATLAB R2021a.
3.1 Data gathering
The data set used in this study is a digital image of corn leaves as many as 3500 records obtained from the Kaggle.com https://www.kaggle.com/datasets/arhasnaazzahra/cornleavediseasesprehensive.
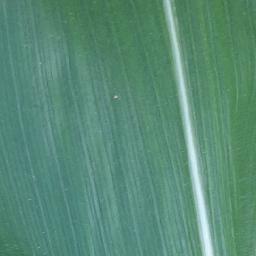
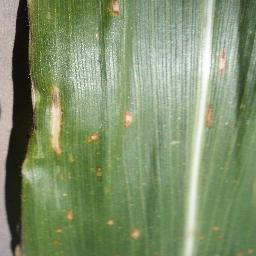
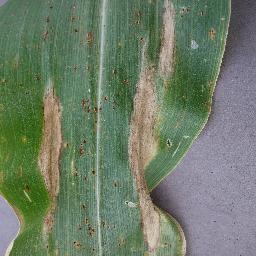
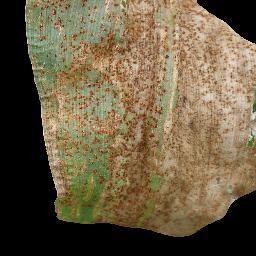
The dataset contains a collection of corn leaf images obtained from farmers' fields in the Madura region which were uploaded by A.R Hasna Azzahra. There are four total target classes in this dataset, namely healthy, gray leaf spot, blight, and common rust. An explanation of the dataset used is shown in Table 1. The amount of data for each class is 1000 data except for the gray leaf spot data of 500 data. The data was taken from corn farmers on the island of Madura using a 48 Megapixel camera. the results of data retrieval produce images with a size of 3000 x 4000 pixels. before being processed using CNN the image is resized to 300 x 300 pixels.
Table 1. Corn leaf images
|
Dataset |
Description |
|
healthy corn leaf image |
|
|
image of corn leaves affected by grey leaf spot, namely a disease on corn leaves caused by the fungus Helminthoporium maydis with characteristic brownish yellow spots on the leaves |
|
|
image of corn leaves affected by leaf blight or known as corn blight |
|
|
image of corn leaves infected with common rust or leaf rust disease |
3.2 Analysis
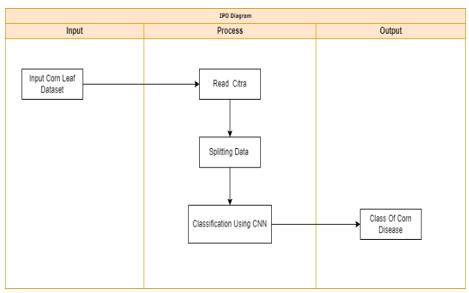
In this section, we will describe the process flow in digital image classification using the Convolutional Neural Network algorithm. The stages of the process will be shown in the IPO Diagram below.
Based on Figure 6, the corn leaf image classification process is divided into several stages, namely, input, process, and output. The description of the three stages is as follows.
Input
Classifying the image of corn leaves, it begins with inputting the dataset. The dataset used is the image of corn plant leaves with as many as 3500 records with 4 classification targets.
Process
Furthermore, training data and test data were divided using the data splitting method with a ratio of 70% training data and 30% test data.
Classification
At the classification stage, the process of modeling a digital image classification system is carried out using the Convolutional Neural Network algorithm with several different architectures, namely SqueezeNet, AlexNet, ResNet-101, ResNet-50, and ResNet-18. The application of different CNN architectures aims to find out which architecture provides the best accuracy results.
Output
The output generated after the entire process is executed is a class prediction of diseases on corn leaves.
Figure 6. IPO diagram
In this section, we will describe the results of the classification that has been carried out on 3500 image records of corn leaves using the Convolutional Neural Network method, starting with the process of first dividing the data with a comparison of 70% training data and 30% test data. The parameter used is Adam optimization with a learning rate of 0.0001. Then for the architecture, this study uses 5 different types of CNN architectures. The accuracy results obtained by using the different architectures will be described as follows.
Graph Accuracy in the SqueezeNet Architecture
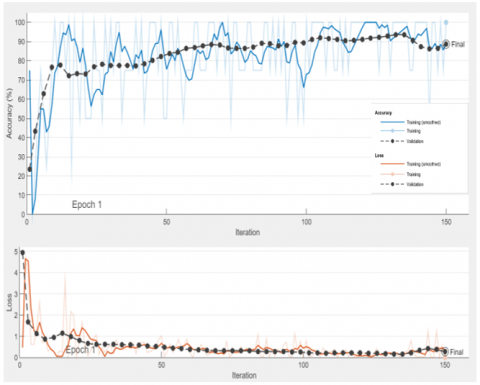
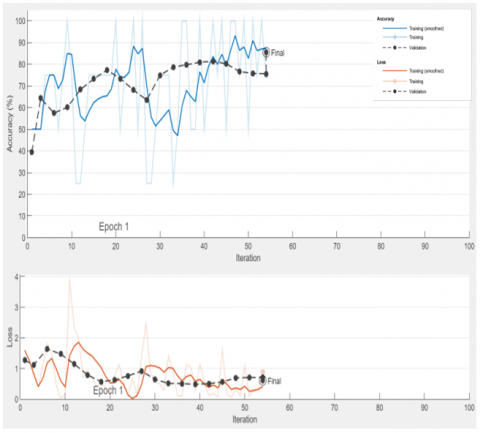
In Figure 7 the application of the CNN method with the SqueezeNet architecture has good accuracy, reaching 88.67% and slight fluctuations indicating the use of this architecture gives results that are fairly stable and tend to increase in accuracy which can also be shown on the loss graph which is getting closer to the value 0.
Figure 7. Accuracy of SqueezeNet
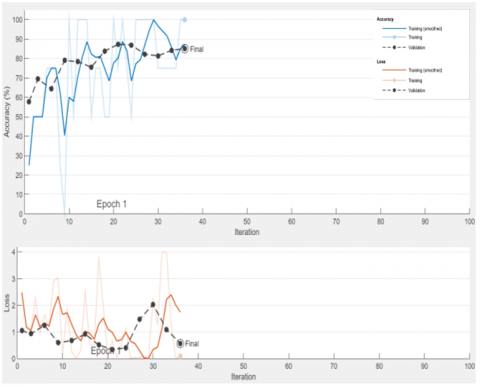
Accuracy Graph in AlexNet Architecture
In the accuracy graph such as depicted in Figure 8, it is shown that the use of the AlexNet architecture provides good accuracy of 85.07% but has more fluctuations in each iteration and the decrease in accuracy in some iterations is quite high.
Figure 8. Accuracy of AlexNet
Accuracy Graph in ResNet-101 Architecture
Figure 9 shows the accuracy of implementing the ResNet-10 architecture giving good results even though there are quite a lot of fluctuations that occur in each iteration, but the decrease is not as high as in the AlexNet implementation. Accuracy in applying this architecture reaches 85.43%.
Figure 9. Accuracy of ResNet-101
Accuracy Graph in ResNet-50 Architecture
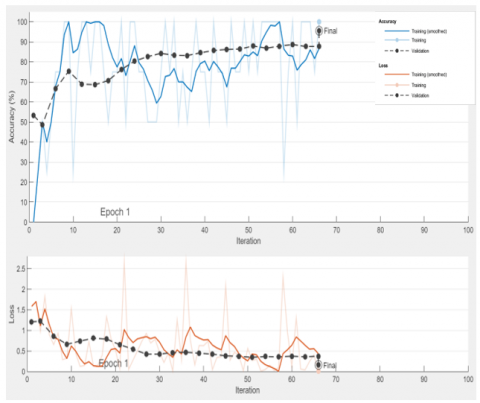
The accuracy results obtained using the ResNet-50 architecture provide the best accuracy with little fluctuation in each iteration and tend to increase. Even though the ResNet-50 architecture is not as complex as ResNet-101, this architecture has better results, reaching 95.59% as presented in Figure 10.
Accuracy Graph in ResNet-18 Architecture
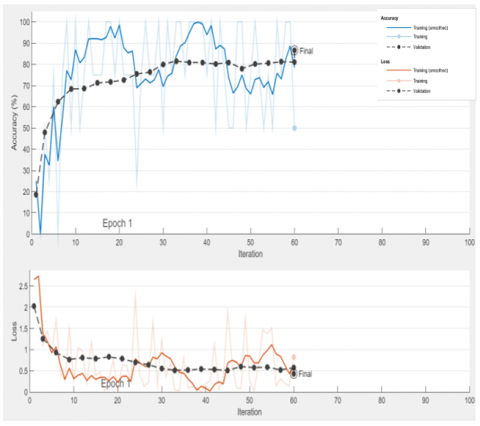
In the accuracy graph such as described in Figure 11, it is shown that the use of the ResNet-18 architecture provides good accuracy by reaching 86.60% with several fluctuations that occur, but ResNet-18 is still better than ResNet-101 and AlexNet.
Figure 10. Accuracy of ResNet-50
Figure 11. Accuracy of ResNet-18
Based on the four accuracy graphs described above, the number of parameters does not affect the results of accuracy and the resulting running time because each CNN architecture has its characteristics to produce the best accuracy results. comparisons can be made in terms of the accuracy produced and the computational time required in classifying image data, as shown in Table 2 below.
Table 2. Comparison of some CNN architectures
|
CNN architecture |
Parameters |
Accuracy |
Running time |
|
AlexNet |
60.9 M |
85.07 % |
8 m |
|
ResNet-101 |
84.7 M |
85.43 % |
137 m |
|
ResNet-18 |
31.7 M |
86.60 % |
23 m 10 s |
|
SqueezeNet |
1.25 M |
88.67 % |
33 m 37 s |
|
ResNet-50 |
45.8 M |
95.59 % |
79 m 57 s |
Table 2 shows the results of the resulting difference in accuracy for each CNN architecture. Overall, the CNN method provides very good accuracy based on the five architectures, but the use of ResNet-50 is proven to have the best accuracy among the others, namely 95.59% with a computation time of 79 minutes and 57 seconds.
Based on the discussion in the previous section, conclusions can be drawn which will be described as follows.
From the results obtained, it can be said that the CNN algorithm provides good accuracy in classifying digital images of corn leaves of as many as 3500 records into 4 target classes.
The use of different CNN architectures greatly affects the accuracy of results obtained and the time required in carrying out the classification process. As explained in the results of the analysis and discussion, the ResNet-50 architecture obtains the best accuracy value by reaching 95.59% with little fluctuation in all iterations with a computation time of 75 minutes and 57 seconds.
We thank the Institute for Research and Community Service, University of Trunojoyo Madura, which has provided research funding to the end. One of us would like to thank the Faculty of Engineering, University of Trunojoyo Madura for allowing researchers to complete this research in the Multimedia laboratory. We also thank the Multimedia Laboratory research team for the completion of this research. This work is supported by the University of Trunojoyo Madura DIPA UTM (Grant numbers: 225/UN46.4.1/PT.01.03/2022).
[1] Hidayat, K., Nasikin, M.K., Rakhmawati. (2021). Product development of corn rice using value engineering method. IOP Conference Series: Earth and Environmental Science, 733: 1-8. http://dx.doi.org/10.1088/1755-1315/733/1/012039
[2] Subedi, S. (2015). A review on important maize diseases and their management in Nepal. Journal of Maize Research and Development, 1(1): 28-52. http://dx.doi.org/10.3126/jmrd.v1i1.14242
[3] Putro, S.S., Syakur, M.A., Rochman, E.M.S., Musfirotummamlu'ah, Rachmad, A. (2023). Prediction of corn crop yield using backpropagation neural network algorithm. AIP Conference Proceedings, 2679(1): 1-5. https://doi.org/10.1063/5.0127695
[4] Lopez-Zuniga, L.O., Wolters, P., Davis, S., Weldekidan, T., Kolkman, J.M., Nelson, R., Hooda, K.S., Rucker, E., Thomason, W., Wisser, R., Balint-Kurti, P. (2019). Using maize chromosome segment substitution line populations for the identification of loci associated with multiple disease resistance. G3 Genes|Genomes|Genetics, 9(1): 189-201. http://dx.doi.org/10.1534/g3.118.200866
[5] Ubaidillah, A., Rochman, E.M.S., Fatah, D.A., Rachmad, A. (2022). Classification of corn diseases using random forest, neural network, and naive bayes methods. Journal of Physics: Conference Series, 2406(1): 1-10. https://doi.org/10.1088/1742-6596/2406/1/012023
[6] Al-doski, J., Mansor, S.B., Shafri, H.Z.M. (2013). Image classification in remote sensing. Journal of Environment and Earth Science, 3(10): 141-147.
[7] Chen, L., Li, S., Bai, Q., Yang, J., Jiang, S., Miao, Y. (2021). Review of image classification algorithms based on convolutional neural networks. Remote Sensing, 13(22): 4712. https://doi.org/10.3390/rs13224712
[8] Rachmad, A., Chamidah, N., Rulaningtyas, R. (2020). Mycobacterium tuberculosis images classification based on combining of convolutional neural network and support vector machine. Communications in Mathematical Biology and Neuroscience, 2020: 85. https://doi.org/10.28919/cmbn/5035
[9] Zhang, X., Qiao, Y., Meng, F., Fan, C., Zhang, M. (2018). Identification of maize leaf diseases using improved deep convolutional neural networks. IEEE Access, 6: 30370-30377. https://doi.org/10.1109/ACCESS.2018.2844405
[10] Sladojevic, S., Arsenovic, M., Anderla, A., Culibrk, D., Stefanovic, D. (2016). Deep neural networks based recognition of plant diseases by leaf image classification. Computational Intelligence and Neuroscience, 2016: 3289801. https://doi.org/10.1155/2016/3289801
[11] Mohanty, S.P., Hughes, D.P., Salathé, M. (2016). Using deep learning for image-based plant disease detection. Frontiers in Plant Science, 7: 1419. https://doi.org/10.3389/fpls.2016.01419
[12] Wang, J., Li, Z. (2018). Research on face recognition based on CNN. IOP Conference Series: Earth and Environmental Science, 170(3): 032110. http://dx.doi.org/10.1088/1755-1315/170/3/032110
[13] Anton, A., Nissa, N. F., Janiati, A., Cahya, N., Astuti, P. (2021). Application of deep learning using convolutional neural network (CNN) method for Women ’ s skin classification. Scientific Journal of Informatics, 8(1): 144-153. https://doi.org/10.15294/sji.v8i1.26888
[14] Zhai, J., Shen, W., Singh, I., Wanyama, T., Gao, Z. (2020). A review of the evolution of deep learning architectures and comparison of their performances for histopathologic cancer detection. Procedia Manufacturing, 46: 683-689. https://doi.org/10.1016/j.promfg.2020.03.097
[15] LeCun, Y., Bengio, Y., Hinton, G. (2015). Deep learning. Nature, 521(7553): 436-444. https://doi.org/10.1038/nature14539
[16] Setiawan, W., Rochman, E.M.S., Satoto, B.D., Rachmad, A. (2022). Machine learning and deep learning for maize leaf disease classification: A review. In Journal of Physics: Conference Series, 2406(1): 012019. https://doi.org/10.1088/1742-6596/2406/1/012019
[17] Hassanpour, M., Malek, H. (2020). Learning document image features with SqueezeNet convolutional neural network. International Journal of Engineering, 33(7): 1201-1207. https://doi.org/10.5829/ije.2020.33.07a.05
[18] He, K., Zhang, X., Ren, S., Sun, J. (2016). Deep residual learning for image recognition. In Proceedings of the IEEE Conference on Computer Vision and Pattern Recognition, pp. 770-778.
[19] Mehdiyev, N., Enke, D., Fettke, P., Loos, P. (2016). Evaluating forecasting methods by considering different accuracy measures. Procedia Computer Science, 95: 264-271. https://doi.org/10.1016/j.procs.2016.09.332
[20] Chen, R.C., Dewi, C., Huang, S.W., Caraka, R.E. (2020). Selecting critical features for data classification based on machine learning methods. Journal of Big Data, 7(1): 52. https://doi.org/10.1186/s40537-020-00327-4
[21] Tharwat, A. (2021). Classification assessment methods. Applied Computing and Informatics, 17(1): 168-192. https://doi.org/10.1016/j.aci.2018.08.003
[22] Rachmad, A., Syarief, M., Rifka, S., Sonata, F., Setiawan, W., Rochman, E.M.S. (2022). Corn leaf disease classification using local binary patterns (LBP) feature extraction. In Journal of Physics: Conference Series, 2406(1): 012020. https://doi.org/10.1088/1742-6596/2406/1/012020
[23] Damayanti, F., Muntasa, A., Herawati, S., Yusuf, M., Rachmad, A. (2020). Identification of Madura tobacco leaf disease using gray-level Co-occurrence matrix, color moments and Naïve Bayes. In Journal of Physics: Conference Series, 1477(5): 052054. https://doi.org/10.1088/1742-6596/1477/5/052054