Hajer Hussein Albank*![]() | Saleh Issa Khassaf
| Saleh Issa Khassaf![]()
© 2023 IIETA. This article is published by IIETA and is licensed under the CC BY 4.0 license (http://creativecommons.org/licenses/by/4.0/).
OPEN ACCESS
The stepped spillway is the most effective hydraulic structure for dissipating energy downstream of the spillway crest. This paper investigates the energy dissipation rate on physical models of traditional steps at downstream angles (25˚, 35 ̊, 45 ̊) in which each angle was modelled with two different heights of steps (45, and 90 mm). Experimentation has been done for plain steps, and steps with end sill steps of a thickness of 15 mm. The results, which are supported by dimensional considerations, show that the critical depth of flow passing over the spillway to the step height yc/h, the number of steps N, and the slope of the stepped spillway are the parameters that affect energy dissipation. The results show also that the relative energy loss on pooling steps dissipates more energy than on flat steps by about 4.6%.
flat stepped spillways, pooled stepped spillway, energy dissipation
Stepped spillways have been used extensively in hydraulic engineering as energy dissipation facilities and show great potential due to achieving a better rate of energy dissipation while discharging extra floodwater [1]. Since the flow is supercritical and has a very great velocity and consequently erosive power. In order to avoid the risk of serious scouring of the downstream river bed and foundation damage, this energy should be dissipated. Stepped spillways enable the continuous dissipation of a significant portion of the flow kinetic energy, allowing for a significant reduction in the size of the downstream stilling basin, where the remaining energy is dissipated by hydraulic jump. Also, the cavitation risk along the spillway is greatly reduced, due to smaller flow velocities and the large air entertainment rate [2]. Many researchers have worked on flow conditions and energy loss in stepped spillways. A stepped spillway might have steps that are horizontal, inclined (upward or downward) or pooled steps. At low flow rates, nappe flow, transition flow at intermediate discharges, or skimming flow at higher flow rates could all represent the flow pattern for a given chute structure [3]. stepped spillways were shown to be more effective at dissipating flow energy than flat-sloping spillways. The ratio of flow energy dissipation increased as the number of steps and downstream slopes of the spillway were reduced [4].
A number of recent research have been performed on flat and polled stepped spillways [5-7].
Barani et al. studied energy dissipation of flow over stepped spillways of various step shapes. Different step shapes (plain steps, end sill steps with thicknesses of 1, 2, 3, and 4 cm, and steps with a bottom adverse slope of 45°, 36°, 26°, and 15°) have been the subject of the experiments. Overall, the hydraulic parameters of flow over the model were measured and the energy dissipation of flow was calculated. According to the results, flow on end sills and inclined stepped spillways wastes more energy than a plain one. This rise occurs when the end sill's thickness or the magnitude of the adverse slope is increased. The inclined type has dissipated more energy than the same end sill type, according to a comparison of the flow energy dissipation between end sill stepped spillways and inclined types [8]. Chinnarasri and Wongwises [9] noted that the rate of energy dissipation on the flat stepped chute was significantly lower than that on steps with end sills for chute slopes of 45 degrees. Hamedi et al. [10] investigated whether the energy loss rate of stepped spillways increases as a result of using end sills and inclined steps. Inclined steps with various slopes and end sills with various thicknesses, heights, and angles upward are used in this experiment to better understand their effects on relative energy loss. According to the results, utilizing incline steps with an end still has a significant impact on both nappe and skimming flows, however, nappe flows dissipate more energy than skimming flows. Salmasi and Abraham [11] examine the energy dissipation rate in spillways with various slopes. The Froude number and q2 /(gHdam3) were discovered to be the two most significant dimensionless factors controlling energy dissipation. The rate of energy dissipation is less affected by the spillway slope and step number. The energy dissipation will rise with increasing spillway slope and step number for constant discharge over a stepped spillway. The main objective of this paper is to study the relative energy loss and the factors that affect this energy loss the most. This paper also studies the enhancement that can be made on a spillway in order to increase the efficiency of energy dissipation without enlarging the structure size.
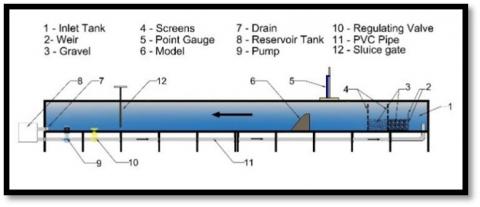
The flume was carried out in the hydraulic engineering laboratory, At the University of Basra. All The tests were carried out in a rectangular flume of 78 cm * 80 cm cross-section and 10 meters long was used to execute all the tests. The flume walls are of plexiglass, the bed is made of painted steel. The flume's bed was kept on a horizontal slope as shown in Figure 1. The flume is divided into three sections, the first of which is an input tank.
Figure 1. Detailed drawing of a laboratory flume
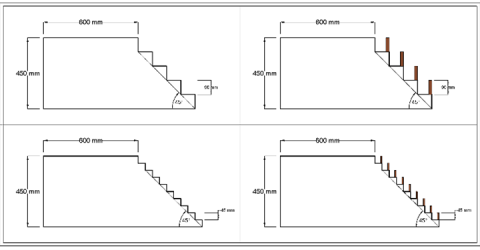
(a)
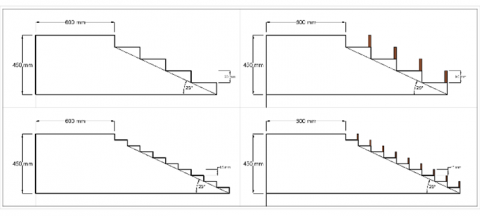
(b)
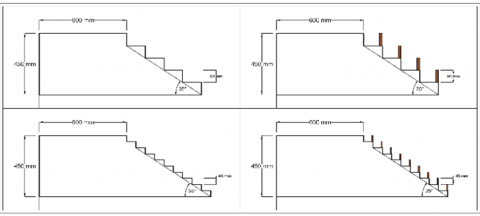
(c)
Figure 2. a) Sketches of the experimented models of inclination 45 degree; b) Sketches of the experimented models of inclination 35 degree; c) Sketches of the experimented models of inclination 25 degree
The second section is the working section of the flume consisting of the sharp-crested rectangular weir (73.2) cm wide and (45) cm height used to measure flow discharge. Gravel and screens help dissipate the extra energy of flow by distributing the flow uniformly across the entire width of the flume. The screens act as wave breakers and provide a smooth water surface profile before the spillway. The third section of the flume is a reservoir that provides the water through a recirculating flume of the closed water system by a centrifugal pump of a maximum capacity of about 1,200 l\min attached to an electric motor. A point gauge was used to measure the depths of flow by placing the needle tip of the point gauge on the water surface and reading the level on the ruler. The water depth upstream varied between 10 mm and 45 mm above the crest level. The minimum and maximum discharges were 1.276 l/sec and 18.194 l/sec, respectively, at these water depths. Within the flume, spillway models were installed. Each spillway model was subjected to ten test runs. Usually, stepped spillways were built to dissipate more energy, which reduced downstream dangers and required smaller downstream stilling basins. Six different models were used in the experimental laboratory as shown in Figures 2(a), 2(b), and 2(c) the primary angles of the chutes are (25°, 35° and 45°). Each angle was modelled with different steps height (9cm, and 4.5 cm). Consequently, the overall height of each model is the same. Spillway width, and a crest length of (45 cm, 78 cm, and 65 cm), respectively.
The longitudinal flume slope is fixed at an inclination of 0 degrees. In the investigation, flat and pooling steps were tested in the study. To study the improvement of energy dissipation and choose the best extra accessories for steps. The used end sills are of height equal to step height. The thicknesses of end sills are 15 mm for the models having a number of steps of 5, and 10 steps. It attached the downstream of the horizontal face of all steps and of alternative steps. These pieces were made of wood with a smooth surface and they were painted with varnish.
The following laboratory technique is followed in all test runs on stepped spillway models:
- Getting the flow rate of the test run by adjusting the pumps’ control valve and measuring the water head above the sharp-crested weir [12].
- Measuring the water's sequent depth y2.
- Calculating the Froud number of the sequent depth (Fr2) using Eq. (1):
$F_r=\frac{v_2}{\sqrt{g y_2}}$ (1)
- Calculating the water's initial depth y1 by using Belanger’s formula:
$\mathrm{y}_1=\frac{y_2}{2}\left(\sqrt{1+8 F r_2^2}-1\right)$ (2)
the measured values are always smaller than the ones obtained using Belanger’s formula, Eq. (2) [13].
- Applying energy equations to determine the percentage of energy dissipated using Eqns. (3), (4), and (5) [14].
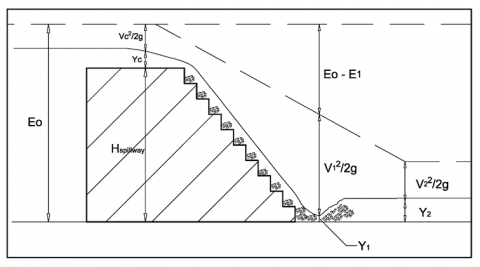
$\mathrm{E}_{\mathrm{o}}=1.5 \mathrm{y}_{\mathrm{c}}+\mathrm{H}_{\text {spillway }}$ (3)
$\mathrm{E}_1=\mathrm{y}_1+\frac{\mathrm{v}_1^2}{2\mathrm{~g}}$ (4)
$\frac{E_L}{E_0}=\frac{E_0-E_1}{E_0} \%$ (5)
where,
Eo=energy at the crest of the spillway, E1=energy at the beginning of the hydraulic jump.
yc=critical depth$\sqrt[3]{\frac{q^2}{g}}$, Hspillway=height of the spillway, V1=downstream velocity (m/sec).
g=acceleration due to gravity (m/s2).
$\frac{E_L}{E_o}$%=Relative energy dissipation between U/S and D/S of the stepped spillway. Details of energy lines are shown in Figure 3.
Figure 3. Details of Energy lines (Source own elaboration)
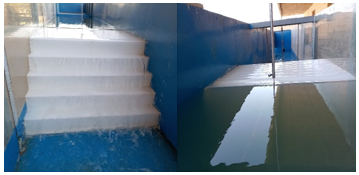
Overall, 120 experiments with different flow rates and step shapes, and end sills steps have been carried out see Figure 4. The flow kinetic energy and the percentage of dissipated energy (EL/Eo%) was determined. The major goal of the current investigation is to determine how the geometry of the steps affect energy dissipation process.
Figure 4. Experimented models
2.1 Dimensional analysis for stepped spillway
Dimensional analyses have been used in this research to analyze the flow of water over the stepped spillway to obtain the important parameters studied in experimental work. Using Buckingham’s theory as a mathematical dimension analysis technique with non-dimensional Groups [15].
Table 1. Properties of the fluid, hydraulic flow, geometry and shape for stepped spillway
|
VARIABLE |
MEANING |
DIMENSION |
|
FLUID PROPERTIES |
||
|
ρ |
The density of the fluid |
ML-3 |
|
µ |
Dynamic viscosity of the fluid |
M L-1 T-1 |
|
FLOW CHARACTERISTICS |
||
|
g |
Gravitational acceleration |
LT-2 |
|
y1 |
Downstream depth of flow |
L |
|
yc |
Critical depth |
L |
|
GEOMETRICAL CHARACTERISTICS |
||
|
N |
Number of steps |
- |
|
hs |
Step height |
L |
|
Ls |
Step length |
L |
The first step to developing a correlation is to select parameters that influence the flow of energy dissipation. These parameters are listed in Table 1. This research focused on the input parameters to keep correlation as simple as possible. The energy dissipation of the stepped spillway is a function of:
$\mathrm{F}\left(\mathrm{E}_0, \mathrm{E}_{\mathrm{L}}, \rho, \mathrm{g}, \mu, \mathrm{q}, \mathrm{h}_{\mathrm{s}}, \mathrm{L}_{\mathrm{s}}, \mathrm{N}\right)=0$ (6)
Taking the common variables (ρ, g, hs) as repeating variables, Eq. (7) can be written from Buckingham -theorem:
$\mathrm{F}_1\left(\pi_1, \pi_2, \pi_3, \pi_4, \pi_5, \pi_6\right)=0$ (7)
where,
π1=ρa1 gb1 hsc1 Eo
π2=ρa2 gb2 hsc2 EL
π3=ρa3 gb3 hsc3 µ
π4=ρa4 gb4 hsc4 q
π5=ρa5 gb5 hsc5 N
π6=ρa6 gb6 hsc6 Ls
By taking each π term and expressing it in the dimensional form:
M0 L0 T0=[M L-3]a1 [LT-2]b1 [L]c1 [ L]
For M: a1=0
For L: -3a1 + b1 + c1 + 1=0
For T: -2b1=0
So π1=$\frac{E_o}{h_s}$
By the same way:
π2=$\frac{\mathrm{E}_{\mathrm{L}}}{\mathrm{h}_{\mathrm{s}}}$
π3=Re
π4=$\frac{q}{g^{1/2} \quad h_s^{3/2}}$ =$\frac{\mathrm{q}^2}{\mathrm{~g} \mathrm{hs}^3}$=$\frac{\mathrm{y}_{\mathrm{c}}}{\mathrm{h}_{\mathrm{s}}}$
π5= N
π6=$\frac{\mathrm{L}_{\mathrm{s}}}{\mathrm{h}_{\mathrm{s}}}$
π2 / π1=$\frac{E_L}{E_0}$
the functional relationship may be written as:
$\frac{\mathrm{E}_{\mathrm{L}}}{\mathrm{E}_1}=f\left(\frac{\mathrm{y}_{\mathrm{c}}}{\mathrm{h}_{\mathrm{s}}}, \frac{\mathrm{L}_{\mathrm{s}}}{\mathrm{h}_{\mathrm{s}}}, \mathrm{N}, \mathrm{Re}\right)$ (8)
Eq. (8) will eventually become Eq. (9) as a result of the fourth dimensionless factor (Re), which is avoided due to the turbulence of the flow over the stepped spillway and the generation of a significant Reynolds number:
$\frac{E_L}{E_1}=f\left(\frac{\mathrm{y}_{\mathrm{c}}}{\mathrm{h}_{\mathrm{s}}}, \frac{\mathrm{L}_{\mathrm{s}}}{\mathrm{h}_{\mathrm{s}}}, \mathrm{N}\right)$ (9)
Discussing and analyzing the results acquired from the laboratory data is the most important step in understanding the most crucial factors that affect energy dissipation, all experiments were performed at the laboratory of hydraulics in the civil engineering department at the university of Basrah. The measurement and outputs for all experimented models are tabulated in Tables 2, 3, and 4.
Several relation charts derived from data tabulated in table 2,3, and 4 to discuss and analyze each parameter appeared in the dimensional analysis equation. Each parameters' effect will be discussed separately below.
Table 2. Experimental results for models having downstream inclination of 45 degree
|
Type of Step |
h(m) |
q (m3/s/m) |
yc (m) |
Eo (m) |
y1 (m) |
E1 (m) |
EL/Eo (%) |
Type of Step |
h(m) |
q (m3/s/m) |
yc (m) |
Eo (m) |
y1 (m) |
E1 (m) |
EL/Eo (%) |
|
|
[1] |
[2] |
[3] |
[4] |
[5] |
[6] |
[7] |
|
[1] |
[2] |
[3] |
[4] |
[5] |
[6] |
[7] |
|
Model A1 Number of Steps = 5 |
Model A2 Number of Steps = 5 |
||||||||||||||
|
Flat |
0.09 |
0.002 |
0.006 |
0.460 |
0.002 |
0.032 |
93.0 |
Pooled |
0.09 |
0.002 |
0.006 |
0.460 |
0.002 |
0.026 |
94.2 |
|
Steps |
|
0.003 |
0.010 |
0.465 |
0.003 |
0.073 |
84.2 |
Steps |
|
0.003 |
0.010 |
0.465 |
0.003 |
0.047 |
89.9 |
|
|
|
0.005 |
0.014 |
0.471 |
0.004 |
0.088 |
81.3 |
|
|
0.005 |
0.014 |
0.471 |
0.005 |
0.063 |
86.7 |
|
|
|
0.007 |
0.017 |
0.476 |
0.005 |
0.099 |
79.3 |
|
|
0.007 |
0.017 |
0.476 |
0.006 |
0.076 |
84.1 |
|
|
|
0.010 |
0.021 |
0.482 |
0.007 |
0.108 |
77.7 |
|
|
0.010 |
0.021 |
0.482 |
0.008 |
0.081 |
83.1 |
|
|
|
0.012 |
0.025 |
0.487 |
0.008 |
0.117 |
75.9 |
|
|
0.012 |
0.025 |
0.487 |
0.010 |
0.085 |
82.4 |
|
|
|
0.015 |
0.028 |
0.492 |
0.010 |
0.122 |
75.3 |
|
|
0.015 |
0.028 |
0.492 |
0.012 |
0.095 |
80.8 |
|
|
|
0.018 |
0.032 |
0.498 |
0.012 |
0.127 |
74.5 |
|
|
0.018 |
0.032 |
0.498 |
0.013 |
0.102 |
79.6 |
|
|
|
0.021 |
0.035 |
0.503 |
0.014 |
0.133 |
73.5 |
|
|
0.021 |
0.035 |
0.503 |
0.015 |
0.107 |
78.7 |
|
Model A3 Number of Steps = 10 |
Model A4 Number of Steps = 10 |
||||||||||||||
|
Flat |
0.045 |
0.002 |
0.006 |
0.460 |
0.002 |
0.029 |
93.6 |
Pooled |
0.045 |
0.002 |
0.006 |
0.460 |
0.002 |
0.026 |
94.2 |
|
Steps |
|
0.003 |
0.010 |
0.465 |
0.003 |
0.061 |
86.9 |
Steps |
|
0.003 |
0.010 |
0.465 |
0.004 |
0.037 |
92.1 |
|
|
|
0.005 |
0.014 |
0.471 |
0.004 |
0.072 |
84.6 |
|
|
0.005 |
0.014 |
0.471 |
0.005 |
0.052 |
88.9 |
|
|
|
0.007 |
0.017 |
0.476 |
0.006 |
0.082 |
82.8 |
|
|
0.007 |
0.017 |
0.476 |
0.007 |
0.065 |
86.3 |
|
|
|
0.010 |
0.021 |
0.482 |
0.007 |
0.092 |
80.9 |
|
|
0.010 |
0.021 |
0.482 |
0.009 |
0.068 |
85.9 |
|
|
|
0.012 |
0.025 |
0.487 |
0.009 |
0.100 |
79.5 |
|
|
0.012 |
0.025 |
0.487 |
0.011 |
0.077 |
84.2 |
|
|
|
0.015 |
0.028 |
0.492 |
0.011 |
0.106 |
78.5 |
|
|
0.015 |
0.028 |
0.492 |
0.012 |
0.086 |
82.4 |
|
|
|
0.018 |
0.032 |
0.498 |
0.013 |
0.112 |
77.4 |
|
|
0.018 |
0.032 |
0.498 |
0.014 |
0.092 |
81.5 |
|
|
|
0.021 |
0.035 |
0.503 |
0.014 |
0.119 |
76.3 |
|
|
0.021 |
0.035 |
0.503 |
0.016 |
0.098 |
80.5 |
Table 3. Experimental results for models having downstream inclination of 35 degree
|
Type of Step |
h(m) |
q (m3/s/m) |
yc (m) |
Eo (m) |
y1 (m) |
E1 (m) |
EL/Eo (%) |
Type of Step |
h(m) |
q (m3/s/m) |
yc (m) |
Eo (m) |
y1 (m) |
E1 (m) |
EL/Eo (%) |
|
|
[1] |
[2] |
[3] |
[4] |
[5] |
[6] |
[7] |
|
[1] |
[2] |
[3] |
[4] |
[5] |
[6] |
[7] |
|
Model B1 Number of Steps = 5 |
Model B2 Number of Steps = 5 |
||||||||||||||
|
Flat |
0.09 |
0.002 |
0.006 |
0.460 |
0.002 |
0.026 |
94.2 |
Pooled |
0.09 |
0.002 |
0.006 |
0.460 |
0.003 |
0.022 |
95.3 |
|
Steps |
|
0.003 |
0.010 |
0.465 |
0.003 |
0.061 |
86.9 |
Steps |
|
0.003 |
0.010 |
0.465 |
0.004 |
0.034 |
92.6 |
|
|
|
0.005 |
0.014 |
0.471 |
0.005 |
0.069 |
85.3 |
|
|
0.005 |
0.014 |
0.471 |
0.006 |
0.045 |
90.4 |
|
|
|
0.007 |
0.017 |
0.476 |
0.006 |
0.079 |
83.4 |
|
|
0.007 |
0.017 |
0.476 |
0.008 |
0.055 |
88.6 |
|
|
|
0.010 |
0.021 |
0.482 |
0.008 |
0.084 |
82.6 |
|
|
0.010 |
0.021 |
0.482 |
0.009 |
0.062 |
87.1 |
|
|
|
0.012 |
0.025 |
0.487 |
0.010 |
0.090 |
81.5 |
|
|
0.012 |
0.025 |
0.487 |
0.011 |
0.070 |
85.7 |
|
|
|
0.015 |
0.028 |
0.492 |
0.012 |
0.095 |
80.8 |
|
|
0.015 |
0.028 |
0.492 |
0.013 |
0.076 |
84.6 |
|
|
|
0.018 |
0.032 |
0.498 |
0.014 |
0.100 |
80.0 |
|
|
0.018 |
0.032 |
0.498 |
0.016 |
0.081 |
83.8 |
|
|
|
0.021 |
0.035 |
0.503 |
0.016 |
0.105 |
79.1 |
|
|
0.021 |
0.035 |
0.503 |
0.018 |
0.086 |
82.9 |
|
Model B3 Number of Steps = 10 |
Model B4 Number of Steps = 10 |
||||||||||||||
|
Flat |
0.045 |
0.002 |
0.006 |
0.460 |
0.003 |
0.024 |
94.8 |
Pooled |
0.045 |
0.002 |
0.006 |
0.460 |
0.003 |
0.015 |
96.7 |
|
Steps |
|
0.003 |
0.010 |
0.465 |
0.004 |
0.042 |
91.1 |
Steps |
|
0.003 |
0.010 |
0.465 |
0.005 |
0.024 |
94.8 |
|
|
|
0.005 |
0.014 |
0.471 |
0.005 |
0.052 |
88.9 |
|
|
0.005 |
0.014 |
0.471 |
0.007 |
0.035 |
92.6 |
|
|
|
0.007 |
0.017 |
0.476 |
0.007 |
0.061 |
87.2 |
|
|
0.007 |
0.017 |
0.476 |
0.009 |
0.044 |
90.7 |
|
|
|
0.010 |
0.021 |
0.482 |
0.009 |
0.072 |
85.0 |
|
|
0.010 |
0.021 |
0.482 |
0.010 |
0.054 |
88.8 |
|
|
|
0.012 |
0.025 |
0.487 |
0.010 |
0.081 |
83.3 |
|
|
0.012 |
0.025 |
0.487 |
0.012 |
0.062 |
87.3 |
|
|
|
0.015 |
0.028 |
0.492 |
0.012 |
0.086 |
82.4 |
|
|
0.015 |
0.028 |
0.492 |
0.014 |
0.070 |
85.8 |
|
|
|
0.018 |
0.032 |
0.498 |
0.014 |
0.090 |
81.8 |
|
|
0.018 |
0.032 |
0.498 |
0.016 |
0.075 |
84.9 |
|
|
|
0.021 |
0.035 |
0.503 |
0.017 |
0.095 |
81.1 |
|
|
0.021 |
0.035 |
0.503 |
0.019 |
0.081 |
84.0 |
3.1 The effect of slope and number of steps
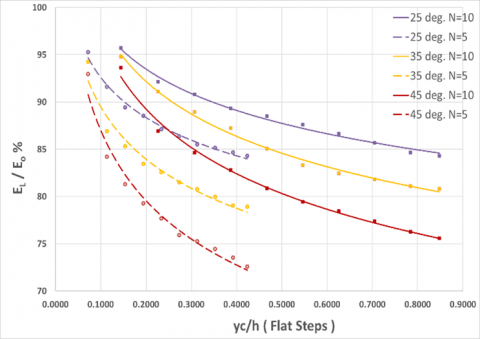
Figure 5 shows the relationship between relative energy dissipation and the dimensionless parameter yc/h for three different slopes with a number of steps 5 and 10. The relative energy dissipation for a spillway with s slope of 25 degrees is higher than a spillway with a slope of 35 degrees by 7.1% max and 16.2% max than a spillway with a slope of 45 degrees.
The relative energy dissipation is higher as the slope of the spillway is milder and vice versa. The energy dissipation curve for milder slope; unlike the steeper slope curve, tends to be horizontal as the passing flow rate increases. The impact of spillway’s slope is obvious in higher flow rates than lower flow rates. It can be seen from the increasing gap between the adjacent curves.
Increasing number of steps causes an increase in relative energy dissipated in an unequal proportion for different slopes. The effect of increasing number of steps is higher in steeper models on the contrary of the milder slopes. It can be seen in the figure the convergence between the two curves of a 25-degree slope and the divergence between the two curves of a 45-degree slope. By increasing the number of steps on a spillway, the triangular space between the steps decreases which causes more of the vortices and more disturbance on the passing flow that leads to a rise in energy dissipation.
Vertical axis source: -column 7 of data table, Horizontal axis source: - column 3 divided on column 1
Figure 5. Relationship of relative energy dissipation versus the dimensionless parameter yc/h for different spillway slope and number of steps
Table 4. Experimental results for models having downstream inclination of 25 degree
|
Type of Step |
h(m) |
q (m3/s/m) |
yc (m) |
Eo (m) |
y1 (m) |
E1 (m) |
EL/Eo (%) |
Type of Step |
h(m) |
q (m3/s/m) |
yc (m) |
Eo (m) |
y1 (m) |
E1 (m) |
EL/Eo (%) |
|
|
[1] |
[2] |
[3] |
[4] |
[5] |
[6] |
[7] |
|
[1] |
[2] |
[3] |
[4] |
[5] |
[6] |
[7] |
|
Model C1 Number of Steps = 5 |
Model C2 Number of Steps = 5 |
||||||||||||||
|
Flat |
0.09 |
0.002 |
0.006 |
0.460 |
0.003 |
0.022 |
95.3 |
Pooled |
0.09 |
0.002 |
0.006 |
0.460 |
0.003 |
0.015 |
96.7 |
|
Steps |
|
0.003 |
0.010 |
0.465 |
0.004 |
0.039 |
91.6 |
Steps |
|
0.003 |
0.010 |
0.465 |
0.006 |
0.023 |
95.1 |
|
|
|
0.005 |
0.014 |
0.471 |
0.005 |
0.050 |
89.4 |
|
|
0.005 |
0.014 |
0.471 |
0.008 |
0.031 |
93.5 |
|
|
|
0.007 |
0.017 |
0.476 |
0.008 |
0.055 |
88.6 |
|
|
0.007 |
0.017 |
0.476 |
0.009 |
0.039 |
91.8 |
|
|
|
0.010 |
0.021 |
0.482 |
0.009 |
0.062 |
87.1 |
|
|
0.010 |
0.021 |
0.482 |
0.012 |
0.046 |
90.5 |
|
|
|
0.012 |
0.025 |
0.487 |
0.012 |
0.066 |
86.4 |
|
|
0.012 |
0.025 |
0.487 |
0.014 |
0.051 |
89.6 |
|
|
|
0.015 |
0.028 |
0.492 |
0.014 |
0.071 |
85.5 |
|
|
0.015 |
0.028 |
0.492 |
0.016 |
0.058 |
88.2 |
|
|
|
0.018 |
0.032 |
0.498 |
0.017 |
0.074 |
85.2 |
|
|
0.018 |
0.032 |
0.498 |
0.019 |
0.063 |
87.4 |
|
|
|
0.021 |
0.035 |
0.503 |
0.020 |
0.077 |
84.7 |
|
|
0.021 |
0.035 |
0.503 |
0.022 |
0.067 |
86.7 |
|
Model C3 Number of Steps = 10 |
Model C4 Number of Steps = 10 |
||||||||||||||
|
Flat |
0.045 |
0.002 |
0.006 |
0.460 |
0.003 |
0.020 |
95.7 |
Pooled |
0.045 |
0.002 |
0.006 |
0.460 |
0.004 |
0.013 |
97.2 |
|
Steps |
|
0.003 |
0.010 |
0.465 |
0.004 |
0.037 |
92.1 |
Steps |
|
0.003 |
0.010 |
0.465 |
0.007 |
0.019 |
95.9 |
|
|
|
0.005 |
0.014 |
0.471 |
0.006 |
0.043 |
90.8 |
|
|
0.005 |
0.014 |
0.471 |
0.009 |
0.027 |
94.3 |
|
|
|
0.007 |
0.017 |
0.476 |
0.008 |
0.051 |
89.3 |
|
|
0.007 |
0.017 |
0.476 |
0.010 |
0.035 |
92.7 |
|
|
|
0.010 |
0.021 |
0.482 |
0.010 |
0.055 |
88.5 |
|
|
0.010 |
0.021 |
0.482 |
0.013 |
0.042 |
91.3 |
|
|
|
0.012 |
0.025 |
0.487 |
0.012 |
0.060 |
87.6 |
|
|
0.012 |
0.025 |
0.487 |
0.015 |
0.047 |
90.4 |
|
|
|
0.015 |
0.028 |
0.492 |
0.015 |
0.066 |
86.6 |
|
|
0.015 |
0.028 |
0.492 |
0.018 |
0.053 |
89.2 |
|
|
|
0.018 |
0.032 |
0.498 |
0.017 |
0.071 |
85.7 |
|
|
0.018 |
0.032 |
0.498 |
0.020 |
0.058 |
88.2 |
|
|
|
0.021 |
0.035 |
0.503 |
0.020 |
0.077 |
84.7 |
|
|
0.021 |
0.035 |
0.503 |
0.024 |
0.063 |
87.6 |
3.2 The effect of using end sills
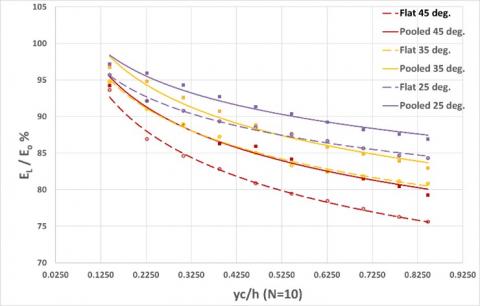
Figures 6(a) and 6(b) show the relative energy dissipation for flat and pooled steps versus the dimensionless parameter yc/h; these two figures express the enhancement of energy dissipation when using end sills on all of the spillway’s steps. This enhancement may surpass the effect of changing the spillway’s slope. Using end sill accessory on the spillway steps will increase the relative energy dissipation more for steeper slope model than the milder slope model.
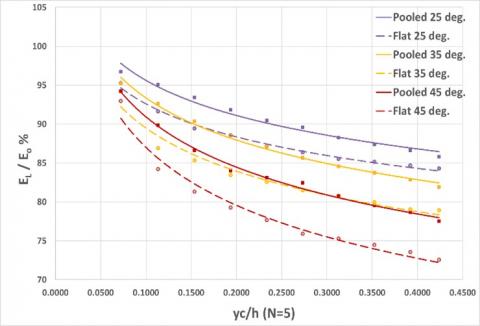
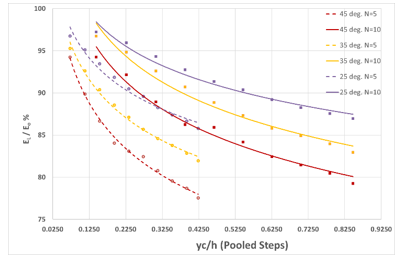
Figure 7 shows the relationship between relative energy dissipation and the dimensionless parameter yc/h for pooled step. It shows approximately the same behavior but with an increase in relative energy loss ranges from 1% to 8.5% than the flat steps.
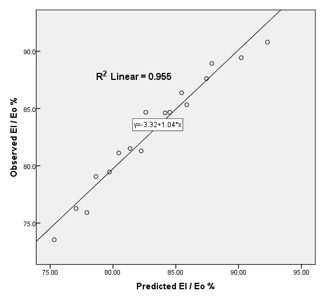
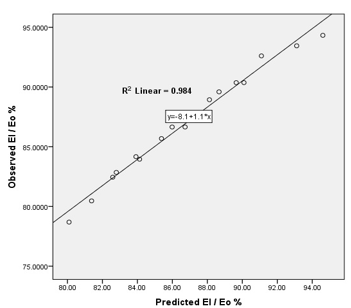
In this study, non-dimensional parameters of Eq. (9) were used as input and output variables to develop equations using SPSS statistical software (26). This equation will help us predict the relative energy loss and will give us an impression about the degree of influence of each parameter. The data were divided into two groups training and validation. The training set is the largest set and is used to obtain the expression model, a validation set is used to check the performance of the developed equation. About 70% of the data set was used for building the model and 30% for validation. The non-linear statistical regression technique is used for prediction models to identify the hydraulic properties of energy dissipation so that the energy dissipation equation of flow over the stepped spillway had been obtained as Eq. (10) for flat steps condition see Figure 8. Same procedure was conducted to obtain an equation for pooled step condition in Eq. (11), see Figure 9.
Figure 8 and Figure 9 show the predicted data of relative energy dissipation resulted from SPSS equations versus data observed form experimental study for flat step condition and pooled step condition respectively. The figures show that the equations developed by SPSS are predicting values with acceptable regression coefficient R2.
(a)
(b)
Vertical axis source: -column 7 of data table, Horizontal axis source: - column 3 divided on column 1
Figure 6. a) Relationship between the relative energy dissipation and dimensionless parameter yc/h for different spillway slope for number of steps = 5 in two conditions; flat and pooled; b) Relationship between the relative energy dissipation and dimensionless parameter yc/h for different spillway slope for number of steps = 10 in two conditions; flat and pooled
Vertical axis source: -column 7 of data table, Horizontal axis source: - column 3 divided on column 1
Figure 7. Relationship of relative energy dissipation versus the dimensionless parameter yc/h for different spillway slopes and number of steps in pooled step condition
Figure 8. The observed energy dissipation versus the predicted by Eq. (10) for flat step condition
$\mathrm{E}_{\mathrm{l}} / \mathrm{E}_{\mathrm{o}}=56.223\left(\mathrm{y}_{\mathrm{c}} / \mathrm{h}^{-0.094}\quad\right) \cdot\left(\mathrm{N}^{0.127}\quad\right) \cdot\left(\mathrm{h}_{\mathrm{s}} / \mathrm{l}_{\mathrm{s}}^{-0.121}\quad\right)$ (10)
$\mathrm{E}_1 / \mathrm{E}_{\mathrm{o}}=62.163\left(\mathrm{y}_{\mathrm{c}} / \mathrm{h}^{-0.085}\quad\right) \cdot\left(\mathrm{N}^{0.108}\quad\right) \cdot\left(\mathrm{h}_{\mathrm{s}} / 1_{\mathrm{s}}^{-0.093}\quad\right)$ (11)
Figure 9. The observed energy dissipation versus the predicted by Eq. (11) for flat pooled step condition
The main points for the conclusion of this study are the following:
[1] Boes, M., Hager, H.F. (2003). Hydraulic design of stepped spillways. Journal of Hydraulic Engineering, 129(9). https://doi.org/10.1061/(ASCE)0733-9429(2003)129:9(671)
[2] Rajaratnam, N. (1990). Skimming flow in stepped spillway. Journal of Hydraulic Engineering, 116(4): 587-691. https://doi.org/10.1061/(ASCE)0733-9429(1990)116:4(587)
[3] Chanson, H. (2001). Hydraulic design of stepped spillways and downstream energy dissipation. Dam Engineering, 11(4): 205-242. https://espace.library.uq.edu.au/view/UQ:11119/dameng01.pdf.
[4] Al-Husseini, T.R. (2015). Experimental study of increasing energy dissipation on stepped spillway. Journal of Kerbala University, 13(3): 87-100.
[5] Guenther, P., Felder, S., Chanson, H. (2013). Flow aeration cavity processes and energy dissipation on flat and pooled stepped spillways for embankments environ. Environmental Fluid Mechanics, 13(5): 503-525. https://doi.org/10.1007/s10652-013-9277-4
[6] Felder, S., Chanson, H. (2013). Aeration flow Instabilities and residual energy on pooled stepped spillways of embankment dams. Journal of Irrigation and Drainage Engineering, 139(10): 880-887. https://doi.org/10.1061/(ASCE)IR.1943-4774.0000627
[7] Kökpinar, M.A. (2011). Flow over a stepped chute with and without macro-roughness elements. Canadian Journal of Civil Engineering, 31(5): 880-891. https://doi.org/10.1139/l04-059
[8] Barani, G.A., Rahnama, M.B., Sohrabipoor, N. (2005). Investigation of flow energy dissipation over different stepped spillways. American Journal of Applied Sciences, 2(6): 1101-1105.
[9] Chinnarasri, C., Wongwises, S. (2006). Flow patterns and energy dissipation over various stepped chutes. Journal of Irrigation and Drainage Engineering, 132(1): 70-76. https://doi.org/10.1061/(ASCE)0733-9437(2006)132:1(70)
[10] Hamedi, A.M., Mohammadi, I.M., Mansoori, A., Roshanaei, H. (2012). Energy dissipation in stepped spillway equipped with inclined steps together with end sill. 2012 Fourth International Conference on Computational Intelligence and Communication Networks, Mathura, India. https://doi.org/10.1109/CICN.2012.109
[11] Salmasi, F., Abraham, J. (2022). Effect of slope on energy dissipation for flow over a stepped spillway. Water Supply, 22(5): 5056-5069. https://doi.org/10.2166/ws.2022.193
[12] Khassaf, S.I., Al-Baghdadi, M.B. (2018). Experimental investigation of submerged flow over piano key weir. International Journal of Energy and Environment (IJEE), 9(3): 249-260.
[13] Alghwail, A.D., Stevović, S., Abourohiem, M.A. (2018). Dissipation of mechanical energy over spillway through counter flow. Gradevinar, 70(5): 377-391. https://doi.org/10.14256/JCE.1691.2016
[14] Abbasi, S., Kamanbedast, A. (2012). Investigation of effect of changes in dimension and hydraulics of stepped spillways for maximum energy dissipation. World Applied Sciences Journal, 18(2): 261-267. https://doi.org/10.5829/idosi.wasj.2012.18.02.492
[15] Al Shaikhli, H.I., Khassaf, S.I. (2021). Developing multi non-linear regression equation for the occurrence of breaking waves. Design Engineering, 2021(8): 2163-2168.