Kennedy Okokpujie*![]() | Imhade P. Okokpujie
| Imhade P. Okokpujie![]() | Odumuyiwa I. Ayomikun
| Odumuyiwa I. Ayomikun![]() | Abidemi M. Orimogunje
| Abidemi M. Orimogunje![]() | Adebayo T. Ogundipe
| Adebayo T. Ogundipe![]()
© 2023 IIETA. This article is published by IIETA and is licensed under the CC BY 4.0 license (http://creativecommons.org/licenses/by/4.0/).
OPEN ACCESS
Cassava is one of the six food items identified as a critical food product for Africa, owing to its importance to African farmers' lives and ability to alter African economies. However, Cassava plant diseases have affected the yield of farmers significantly which has led to a decline in the agricultural production of cassava. Therefore, the aim of this research work is to develop a web and mobile applications-based system that would be able to detect cassava diseases based on its leaf images. To achieve this aim, pre-trained Convolutional Neural Network (CNN) models were selected using their previous performance and the application of transfer learning technique, new models were developed to classify cassava diseases based on the dataset curated and pre-processed. The best three models were selected: MobileNetV2, VGG16 and ResNet50. After training, the accuracy for each model was: 98%, 92% and 75% for MobileNetV2, VGG16 and ResNet50 respectively. Following evaluation of performance, the model with the best accuracy (MobileNetV2) was deployed using a web application interface. After deploying as a web and mobile apps interface, it was further tested to see how it would perform on the field. This research work was found capable of aiding farmers in being able to timely detect the type of disease affecting their cassava plants and the correct treatment to utilize; this also contribute towards Sustainable development goals (SDG) 2 and 12.
cassava disease, Convolutional Neural Network (CNN), web applications, mobile applications, Sustainable development goal
Agriculture was the first human invention that allowed man to thrive and progress. The food business and farming are the most essential activities globally as a result of an ever-increasing populace and the continually rising demand for food to sustain life. Along with food crops and raw materials provided, agriculture also serves as a significant provider of employment opportunities for various individuals within the country and support for different economic systems around the globe [1]. A commonly grown food crop in the agricultural sector is Cassava, especially in Africa [2]. Cassava is one of six food items identified as a critical food product for Africa, owing to its importance to African farmers' lives and ability to alter African economies. According to 2018 estimates, Nigeria produced 59.5 million metric tonnes of cassava, demonstrating Nigeria's ability to produce significant revenue from its domestic value and agricultural exports [3]. However, low yields and post-harvest losses associated with conventional cassava farming practices have significantly influenced cassava production, resulting in an inability to meet domestic demand. An outbreak of cassava diseases and pests, which impacts cassava yields and plant security, is one of the fundamental causes contributing to low output [4]. Some of these diseases include cassava brown streak virus disease [5], cassava bacterial blight [6], cassava green mite [7] and cassava mosaic disease [8]. To deal with the effects of these diseases on the Cassava plant, accurate and timely detection of these diseases is so vital. However, due to lack of knowledge of the symptoms of these diseases, most of their spread effect go undetected until it is too late. Furthermore, to identify these diseases accurately, an expert would be required to accurately identify them on the cassava farm which can be costly and time consuming. This shows that better automated processes are required to help farmers in the early identification and control of cassava infections, as conventional plant disease identification by human experts is labour- and resource-intensive and unable to quickly identify cassava infection.
However, given the significant advancements in technology, especially in computer vision and smartphones, intelligent systems and expert systems have been developed to detect the diseases affecting their plants accurately. These systems provide a cheaper and simpler means for farmers to identify the diseases affecting their crops at any point in time [9]. We are proposing a web-based and mobile application that would be able to classify and identify the disease affecting the Cassava Plant based on its leaf images. The images of the leaves would be captured and sent to the either the web-based or mobile application for the classification. Three pre-trained convolutional neural networks were selected and re-trained and the best performing model was selected to be used by the web-based and mobile application for identification and classification. The models were re-trained using a dataset of Cassava leaf images and evaluated using the accuracy and confusion matrix. Our unique contribution is the deployment of a selected model via a web and mobile application and tested to see how well it would perform on new, never before seen Cassava leaf images. This system would aid Cassava farmers to timely identify which disease is affecting their plant and aid in effective decision making on what preventive measure to take to avoid a spread of the diseases which would affect their harvest.
The rest of the paper is arranged as follows: Section 2 talks about existing works done, Section 3 examines the methodology for developing the system, Section 4 shows the results of the system and Section 5 concludes the paper.
Researchers have used machine learning, deep learning techniques, and algorithms to classify multiple plant diseases. This section will examine what they did along with their evaluation results. A model for detecting damaged Cassava leaves was developed using a transfer learning technique [10]. Three infection classes, two mite infected classes, and a class for healthy leaves are included in the datasets. Using transfer learning, the pictures were then utilized to retrain the InceptionV3 CNN model. Different training and testing settings were employed with the data. The model's accuracy was calculated and presented using a confusion matrix after it was built. The model's performance and accuracy in predicting several cassava illnesses are shown in the confusion matrix. The article [11] compared the accuracy of Efficient-Net (B0 – B7) in detecting plant diseases. The model was re-trained using the Plant-Village dataset which contained 38 categories and 54,305 photos. The model was developed using transfer learning after each efficient Net model's accuracy was compared. Results show that Efficient-Net B5 had the best average sensitivity value for all classes.
AlexNet and GoogleNet were the CNN models utilized in the study of LeCun et al. [12]. The models were created utilizing transfer learning and training from scratch to detect various diseases in plants. The experiment was conducted with a variety of train-test set splits and the F1 score was used to compare the outcomes across all of the different configurations after developing the model for each experiment. Mobile-Net, a lightweight CNN model, was re-trained and launched as a mobile application utilizing the gathered dataset in the study of Ramcharan et al. [13]. The Crop Diseases Data Set was used to conduct this study as the images in the dataset were downsized to 224 by 224 pixels. The model was developed using transfer learning and evaluated using the test dataset in which the model had an accuracy of 89%. Ramcharan et al. [14] and Ashwinkumar et al. [15] used the same data for model development. The data was split into two subclasses, mild and severe, after picking the photographs. MobileNet was used as the base model for object detection model design and fine-tuned using transfer learning. After development, the model's usefulness was assessed using several performance metrics and tested in the field with real-life photos to evaluate performance in the field. Transfer Learning was used to develop the model in the study of Hassan et al. [16] to detect tomato plant diseases. The CNN model used was the Mobile-Net CNN model. A tomato leaf disease dataset was used to build the model. The dataset consisted of 5 classes comprising of 5512 images. After the model was built, the following metrics were used to examine the results of its classification: precision, recall, accuracy and F-score.
The CNN model used in this study of Tiwari et al. [17] were: InceptionV3, InceptionResNetV2, MobileNetV2, and EfficientNetB0 architectures. The Plant-Village dataset was used in this study. The data was split into two categories: training and testing. The accuracy, F1 score, precision, recall, training loss, and time required per epoch were all used to evaluate the model's performance [18] used Dense-Net CNN model in which it was re-trained with the data gotten to detect and classify the diseases into its appropriate classes. The dataset used consisted of different plant leaves belonging to six different crops and was separated into 27 unique categories. The acquired data was separated into three groups: training, validation, and test. To appropriately analyze the data in which ground and expected labels are represented, confusion matrices were used. Other measures such as accuracy, precision, recall, and F1-score were included in the evaluation. The CNN models used in the study of Wagle [19] were AlexNet, AlexNetOWTBn, GoogLeNet, Overfeat and VGG16. A comparison was made between all five models to determine which of the following would produce the best result. The model was built using an open database that had 87,848 pictures of both healthy and diseased plants. The data was randomly split into training and testing sets for the model construction, with 80% of the photos being the training set and 20% forming the testing set. Following the model's construction and comparison it was seen that VGG16 and AlexNetOWTBn designs have the highest success rates based on the results obtained.
5 models were used which were: AlexNet, VGG16, GoogleNet, MobileNetV2 and SqeezeNet [20]. The model was trained using the Plant-Village dataset consisting of the eight damaged tomato leaf categories. The complete dataset was split into two sections, one for training and the other for testing the model. There were four separate sets of training and testing datasets used. For each of the four pairings, the accuracy of each of the models was compared. The confusion matrix was used to keep track of the accurate and incorrect classification of each class. From the result VGG16 had the longest training time and the highest accuracy [21] reviewed several documents that used deep learning techniques in plant illness classification. The datasets used in these papers were publicly available, including the Plant-Village dataset consisting of 14 different crop types and 38 different classes. Some articles used images that they curated from the internet, while some collected their data by capturing images of the leaves out in the field. In this paper, most of the documents reviewed increased the size of their data by applying various data augmentation techniques. In some articles, the dataset had its colour altered in which the dataset was changed from RGB format to grey-scale and segmented images. In some papers, the data was augmented with generative adversarial networks (GANs) to overcome the problem of small number of images. This paper reviewed various papers that used several deep learning CNN models to identify plant diseases. However, some of the most commonly used CNN models include Alex-Net, GoogleNet, InceptionV3, ResNet-50, MobileNetv2, VGG16. For each model used in these papers, the data were divided into training and testing sets for each model. The models were re-trained using transfer learning in which the final few layers were re-trained to detect the disease in various plant species. The models were tested by evaluating the different performance metrics, including the classification accuracy, and most of the models built were deployed as a web or mobile application.
Ayu et al. [22] used various CNN architectures which include: VGG16, ResNet50, InceptionV3, InceptionResNet and DenseNet169. The Plant-Village dataset, used for this study, consisted of 54,305 photos of damaged and healthy plant leaves that were collected under specific conditions. The photos were scaled to 256 × 256 pixels for model optimization and prediction. To expand the dataset size, data augmentation techniques such as zooming, shearing, luminance shift, and rotating were applied. Each of the models' performance indicators was examined after they were trained. Their precision, accuracy, F1 score, and memory were among them. The misclassification between classes was further investigated using a confusion matrix. MobileNetV2 was retrained with transfer learning in the study of Enkvetchakul and Surinta [23]. The dataset used was gotten from Kaggle and consists of the five classes of Cassava diseases. The data was divided into three sets: 70% training data, 20% validation data, and 10% test data. The model was re-trained using the training data and evaluated with the test data to determine the accuracy. For training and validation data, the model's overall accuracy was 74.5 percent and 67.3 percent, respectively. Because the model is user-friendly, it was deployed with a graphical user interface.
The transfer learning approach developed MobileNetV2 and NASNetMobile architecture [24]. The dataset used was a combination of two datasets. The first dataset was the leaf disease dataset, consisting of 13 classes and 603 images. These images were gotten from websites, while some were taken via smartphones. The second dataset used was the iCassava 2019. This dataset consisted of 5 different diseases of cassava, 4 of which were disease cassava leaves class and one class for regular leaf. Before the data can be used to train the model, data augmentation methods were applied to increase the size of the data. After data augmentation, images were resized to 224 x 224. After building the model, the classification accuracy was analyzed using a confusion matrix and the time to complete its development. The CNN architecture used was the MobileNetV2 and MnasNet [25]. The models were developed using the transfer learning. The learning rate used was 0.01 for MobileNet and 0.1 for MNasNet and InceptionV3 for 30 epochs. The model was evaluated using a confusion matrix. Furthermore, the precision, recall and F1-score were calculated. In this research work, both the web and mobile applications were used to deploy the developed best performing model, making it for farmers to employ themselves.
The reviews of the papers mentioned above are summarized in Appendix A (Table 3). After reviewing these papers, we see that the models developed require a huge amount of data for the model to achieve good metrics. Transfer learning was the most common technique as it achieved much better-performing models than self-developed models. However, these models are hardly ever deployed despite having suchhigh values of accuracy. In this research, the best-performed model was deployed both on web and mobile applications.
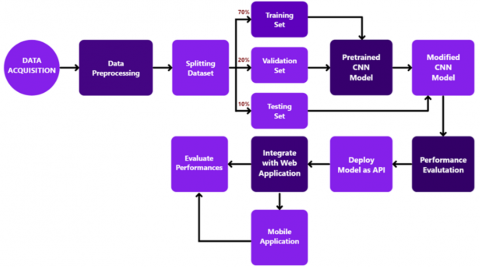
According to Figure 1, cassava plant disease data (which consists of images of cassava plant leaves) were obtained. After getting the photos, they would be cleaned and divided into various classes. After separating the images into different categories, the dataset was split into training, validation and test sets. Following the splitting of the dataset, three states of the art CNN models were selected and retrained using transfer learning.
Figure 1. Flowchart of model development and deployment
The three CNN models selected were: MobileNetV2, VGG16, ResNet50. By transferring information from a previously learned related task to a new one, transfer learning is majorly used technique in deep learning. The main advantage of using transfer learning is that instead of starting the learning process from scratch, the model employs patterns learned while solving a problem similar to the one at hand. After the models had been re-trained, each model was assessed using the test dataset and several performance indicators. Following consideration of the concept, one of the three was implemented as a web server to be used by various farm organizations and agencies across Nigeria to aid farmers in early plant disease identification.
3.1 Data acquisition
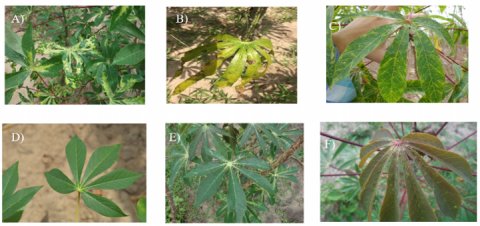
The dataset used in this study consists of photos of disease-infected cassava plant leaves. The data used came from the International Institute of Tropical Agriculture (IITA), Ibadan, Oyo State, Nigeria. The cassava leaf photographs were taken with a Sony Cybershot 20.2-megapixel digital camera, which is easily accessible. The cassava leaves were mostly photographed in the center of the frame over the course of four weeks. Eleven thousand six hundred seventy images were gathered, representing a wide range of cassava species and stages of development, as well as several cassava illnesses. Each disease or type of pest damage had its own features, and the differences in symptom manifestation between illnesses were minor in contrast. The casava images were filtered for co-infections, resulting in a total of 2,756 images utilised to create the models in this project. Six class labels were manually assigned by cassava disease experts from IITA's in-field diagnosis. To evaluate the model's performance, we used the images in colour, and with diverse backdrops from the field for all datasets. The datasets had six class labels: three disease classes, two mite damage classes, and one healthy class (defined as no disease or mite damage on the leaf). The original dataset included disease classes and picture counts for cassava brown streak disease (CBSD) (398 photos), cassava mosaic disease (CMD) (388 images), brown leaf spot (BLS) (386 images), and mite damage classes for cassava green mite damage (GMD) (309 images) and red mite damage (RMD) (415 images). Sample images are shown in Figure 2.
Had been wrongly categorized were reclassified, and images that depicted multiple diseases were included in the collection for both diseases. The photos were scaled to 682 × 512 pixels after the data was cleaned and divided into several labels. I separated the dataset into three sets once it was resized: training, validation, and test datasets in the ratio 70:20:10, respectively. The dataset was split according to most commonly used ratio from literature that yields the best results. Data augmentation strategies were employed to boost the quantity of data utilized to train the model after the dataset was separated into its many components. In addition, the photos in the data set were downsized to the required image size for the models employed in this research.
3.2 Data pre-processing
During the data cleaning procedure, any irregular or unsatisfactory photos were deleted. In addition, images that we used data augmentation techniques like shearing, zooming, flipping, and brightness change to nearly double the original dataset size.
Figure 2. Image of cassava leaves representing each class from the dataset. (A)CBLS, (B) CBSD, (C) GMD, (D) Healthy, (E) CMD and (F) RMD
To increase the performance of models, data augmentation techniques are widely employed in conjunction with traditional machine learning or deep learning algorithms. In this study, the data augmentation method was applied, and the Keras deep learning library in Python was used. For typical class images, I used the following techniques: width and height adjustment, cutting, zooming, and horizontal rotation. The angle of rotation of the image was chosen at random from 0 to 45 degrees.
3.3 Model selection
After the data had been pre-processed and data augmentation had been applied to increase the number of images in the training and validation dataset respectively, four datasets were selected to be trained using transfer learning technique. The models selected are state of the art CNN models that had been trained with ImageNet dataset which consists of over 1,000 classes of images and could make predictions with a high level of accuracy. Various journals were consulted to select the three most commonly used CNN models for transfer learning tasks. The models selected were: MobileNetV2, VGG16 and ResNet50. These models were seen to perform the best for transfer learning tasks and thus were selected for used in this project.
3.3.1 MobileNetV2
MobileNet-v2 is a neural network that has been pre-trained on the ImageNet dataset, which contains over 14 million pictures categorized into 1,000 categories. Because it takes less time to compute, it is ideal for mobility and visual tasks [26]. In MobileNetV2, there are two types of shrinking blocks: block 1 with a stride of 1 and block 2 with a stride of 2. Both blocks have three layers: the first is a 1 X 1 convolution with ReLU6, the second is a depth-wise convolution, and the third is another 1 x 1 convolution with no non-linearity. It's depicted in Figure 3. The depth-separable convolutions layers in MobileNetV2 aid to reduce calculation time. Many efficient neural network topologies include depth-wise separable convolutions, which were utilized in the construction of MobileNetV2 [27]. MobileNetV2's fundamental idea is to replace a full convolutional operator with a factorized variation that splits convolution into two layers. The second layer, known as depth-wise convolution, conducts lightweight filtering by applying a single convolutional filter per input channel. The first layer is a one-to-one convolution, sometimes referred to as a pointwise convolution, which is responsible for generating new features by computing linear combinations of the input channels.
Figure 3. Schematic diagram of pre-trained CNN model transfer learning process
MobileNet-V2 is based on an inverted residual architecture, in which intermediate expansion layers filter features using depth-wise convolutions as a nonlinearity source. A skip link is used to connect the beginning and end of a convolutional block in residual blocks. By integrating these two states, the network can now obtain earlier activations that were not updated in the convolutional block. In the construction of large-scale networks, this strategy proven to be vital [28, 29].
3.3.2 VGG 16
The winner of the ILSVRC2014 is VGG16, a CNN architecture with 138 million parameters. It is one of the most widely used image classification algorithms, and it is simple to apply to transfer learning applications [30].
This architecture always utilises the same convolution layers (3x3 filters with stride 1), padding and maximum pooling layers (2x2 filters with stride 2), padding and maximum pooling layers, instead of having a huge number of hyper-parameters (2x2 filters with stride 2). The VGG16 design keeps the layer structure with convolution and maximum pooling constant. Finally, there are 3 FC layers, the first two of which have ReLU activation and the third of which has Softmax activation. Figure 4 shows this model's structural layout. The 224 x 224-pixel input layer and 224 x 224-pixel output layer are the two 224 × 224-pixel weighted layers that make up the 16 in VGG16. VGG16 includes 21 layers in total, but only 16 weight layers, or learnable parameter levels, including 13 convolutional layers, 5 Max Pooling layers, and 3 Dense layers [31].
3.3.3 ResNet50
ResNet50, which won the ILSVRC-2015 competition in 2015, is an architecture meant to deal with the problem of several nonlinear layers not learning identity maps and deterioration. ResNet50 created residual connections between layers, reducing loss, preserving knowledge gain, and improving training performance [32, 33]. If a layer has a residual connection, its output is a convolution of its input plus its input. In network architecture, ResNet50 is a network built on multiple stacked residual units [34]. As building blocks, residual units are used to form the network. These units are made up of convolution and pooling layers. This design accepts images with a resolution of 224 by 224 pixels.
3.4 System specifications
The workstation used to implement this study has an Intel(R) Core (TM) i7-10510U CPU running at 1.80GHz, 2304 MHz, with 4 Cores, 8 Logical Processors, 8GB RAM, and 64-bit Windows 11 installed. The model was developed using the Jupyter Notebook IDE with Tensorflow Keras.
3.5 Model development
The models were developed using transfer learning. The dataset used in this study was divided as follows: 70% training dataset, 20% validation dataset, and 10% testing dataset. Each model was loaded from Kera into the Jupyter Notebook system, an IDE (Integrated Development Environment), where the model was developed. While loading the model into the notebook, the model layers and parameters involved in the retraining of pre-trained CNN models to be able to perform a specific task. After loading the model, the last few layers of the model were removed and replaced with a few extra layers: a flatten layer, a dropout layer, and an output layer. Softmax was used as the activation layer for the output layer and has six output neurons corresponding to the classes in the dataset used for model development. The inserted layers were set to be trainable while the parameters that were not needed were set to be untrainable to ensure that the pre-trained weights of the model were maintained.
Furthermore, the learning rate was set to 0.0001, and the ADAM optimiser was used to develop the model. The model was trained for 60 epochs. The loss function used was the categorical cross-entropy loss function, and the metric used to evaluate the model was accuracy. Model Checkpoints were also put in place to monitor the validation accuracy to avoid overfitting.
3.6 Model testing
During the model's training, the validation dataset was used to test the model after each epoch. After each training epoch was done, the accuracy was determined along with the validation accuracy for the validation dataset. These metrics were used to determine the hyper-parameters that needed to be changed to achieve the best metrics possible. After the model had been developed, the testing dataset was used to evaluate the model to determine the test accuracy. A classification matrix was also used to assess each model as well.
3.7 Deployment
Farmers can use the model to categorize cassava disease in the field by using a web application/server application that was created and then implemented. A Web application (Web app) is a piece of software that is downloaded over the Internet using a browser interface and is kept on a remote server. It operates through a web browser, as opposed to software programmes that run locally and natively on the device's operating system (OS). This makes it accessible to anybody at any time as long as they have internet access. This model was published as a web application through Streamlit. A Python framework called Streamlit makes it simple to create and share personalized web applications for data analysis and machine learning. The model can be easily published as a web application for farm groups to host and use to assist farmers in early detection of cassava plant diseases with the help of Streamlit.
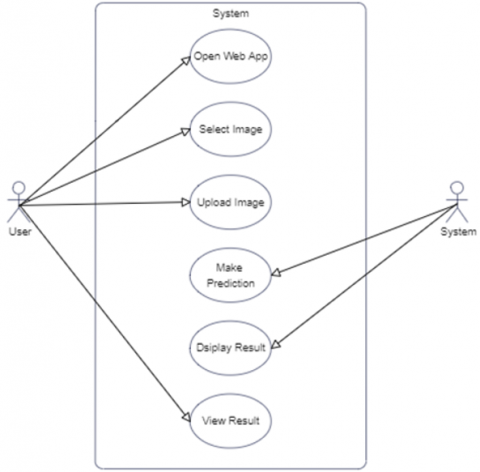
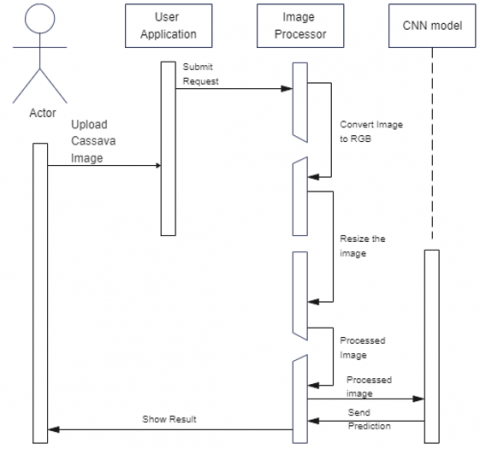
A Unified Modelling Language (UML) diagram that shows the actors in the system with their different functions, performance and interactions among the elements of the system is shown in Figures 4 and 5. Figure 4 shows the single actor “User” and the interactions with the system. The web app is very interactive and easy to use. As shown in Figure 5, you have to upload to the web app with the image of the diseased leaf. Once the image has been uploaded, the web app would resize the image to the appropriate input size, then send the image to the model. The model would classify the image into one of the six classes it has been trained with and return an output. The predicted disease is then displayed to the user on the screen.
The model was also deployed as a mobile application along with the web application. The mobile application was developed to be user friendly and has just a few screens. It was developed to work with the web application as the backend for the application. Via a set of defined API endpoints, the user of the mobile application would be able to send images of the cassava leaf taken his mobile phone to the web application. The web application would process and give back an output based on what the classifier says it is. The output is then routed back to the mobile application and displayed to the user to see the classification of the image sent. This would enable a seamless connection between the web and the mobile application.
Figure 4. A use case diagram for cassava disease system
Figure 5. Sequence diagram for cassava disease system
Following the training of each of the chosen models, the output of the model was shown, and its effectiveness was assessed. A Confusion Matrix was used to assess each model's accuracy and determine its overall performance. A confusion matrix is a table that is used to define the performance of a classification algorithm.
The output of a classification algorithm is shown and summarized in a confusion matrix. The confusion matrix of the test dataset is used to assess the performance characteristics. In a certain format, the confusion matrix displays the correctly classified classes and the incorrectly classified classes. Table 1 below gives a summary of the various accuracy and loss scores for the various models selected.
From Table 1, we see that MobileNetV2 has the highest accuracy compared to the other 2 models followed by VGG16 and then ResNet50.
Table 1. Summary of model development
|
Model Name |
Training Accuracy |
Training Loss |
Test Accuracy |
Test Loss |
|
MobileNetV2 |
98% |
0.1 |
86% |
0.46 |
|
VGG 16 |
92% |
0.4 |
82% |
0.7 |
|
ResNet50 |
75% |
0.7 |
72% |
0.8 |
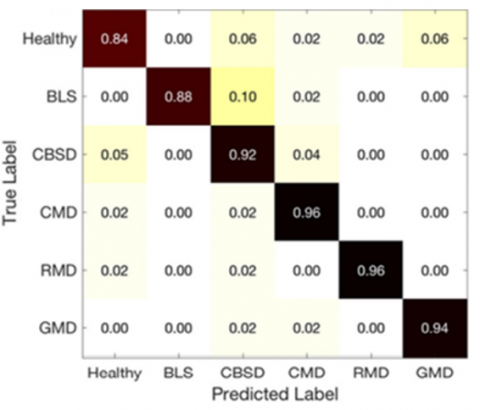
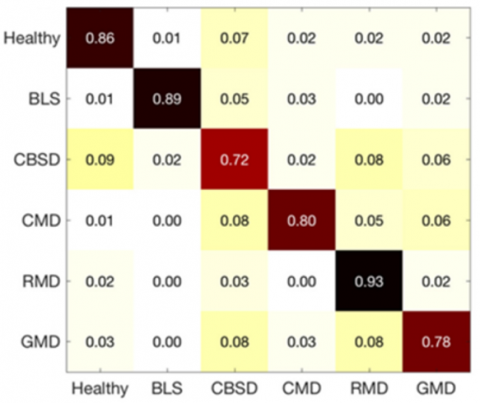
The confusion matrices of each model selected were plotted to see the level of accuracy of the model with the validation data. The confusion matrices of MobileNetV2, VGG16 and ResNet50 are shown in Figure 6, Figure 7, and Figure 8 respectively.
Figure 6. Confusion matrix of MobileNetV2
Figure 7. Confusion matrix of VGG16
Figure 8. Confusion matrix of ResNet50
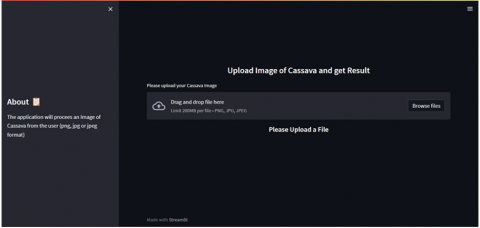
After evaluating the models, MobileNetV2 was chosen because of its accuracy and it size. Also, the MobileNetV2 is lightweight, much easier and faster to deploy for both web and mobile application. The web application are shown in Figures 9 and 10 below. This deployment was done using Streamlit. Streamlit is a python library that enables users and developers to be able to create beautiful and easy to use web applications. A web server was created using streamlit and which could successfully classify the leaf diseases.
Figure 9. Cassava disease web application
Figure 10. Cassava disease classification web APP
To evaluate the performance of the web application, fifteen new images belonging to each of the classes within the dataset were used to test the web application to determine its accuracy. As the images were sent for classification, the output was recorded as either true or false depending on whether it was able to classify the image correctly or not. The result is presented in Table 2.
Table 3 shows the comparative analysis of previous related works with the proposed developed system using significant performance indices. This table reveals that no previous related works have deployed their models both using the web and mobile applicationstion. This research will mark the detection of these cassava diseases which to be easily detected by farmers themselves using their mobile devices and also with web applications if the device is connected to the internet.
Table 2. Classification performance of the system
|
Class Name |
Number of correct classifications |
Number of incorrect classifications |
Accuracy |
|
CassavaMD |
12 |
3 |
80% |
|
CassavaBSD |
12 |
3 |
80% |
|
CassavaRM |
15 |
0 |
100% |
|
CassavaGM |
14 |
1 |
93% |
|
CassavaGM |
15 |
0 |
100% |
|
CassavaHL |
15 |
0 |
100% |
Cassava is one of the six food items identified as a critical food product for Africa, owing to its importance as one of the major sources of food in the continent and its ability to improve the economy of African countries. It is the second most significant carbohydrate source in Sub-Saharan Africa, behind maize, consumed by roughly 500 million Africans every day. However, outbreak of diseases has affected the yield of farmers across Africa especially in Nigeria. The impact of these diseases on farmers' yield has prompted researchers to develop several solutions to detect these diseases quickly and accurately. Early detection and identification of these diseases are crucial in curbing their spread. Given the significant advancements in technology, especially in computer vision and smartphones, intelligent systems and expert systems have been developed to detect the diseases affecting their plants accurately. These systems provide a cheaper and simpler means for farmers to identify the diseases affecting their crops at any point in time. Therefore, a web and mobile-based application was developed to accurately and timely identify the disease that is affecting the Cassava leaves using the images of the Cassava leaves after using state-of-the-art CNN models (MobileNetV2, VGG16 and ResNet50) along with transfer learning techniques.
The limitations encountered include the small size of images curated per class and hosting the developed model as a web API.
To improve the accuracy of this project I suggest collection of more data points and I also recommend that more plant diseases be included in the dataset to make it more widely use by farmers.
We acknowledge the part sponsorship of Covenant University Center for Research and Innovation and Development (CUCRID), Ota, Ogun State, Nigeria.
Table 3. Comparative analysis of previous related works with the proposed developed system using significant performances indices
|
Author |
Year |
Size of dataset used. |
Training ratio |
Validation ratio |
Testing ratio |
Pre-processing technique used |
Machine Learning algorithm used |
Performance Metrics |
Deployed as a web application |
Deployed as a mobile application |
|
[10] |
2016 |
The dataset used consists of 54,306 images. |
80% |
0% |
20% |
The images were resized to 256 x 256 images |
The models used were AlexNet and GoogleNet. |
The accuracy if these models were 98% and 97% respectively. |
No |
No |
|
[35] |
2018 |
The dataset used contains 3242 images |
63% |
13% |
21% |
The images were resized to 224 x 224 |
The model used was MobileNet. |
The accuracy recorded was 89%. |
No |
No |
|
[25] |
2019 |
The dataset consists of 53,903 images. |
60% |
20% |
20% |
The images were resized to 224 x 224 pixels |
The models used were MobileNet, MNasNet, and InceptionV3. |
The models had accuracies of 95.32%, 97.32% and 96.93% respectively. |
No |
Yes |
|
[36] |
2019 |
The dataset used consists of 18,000 images. |
80% |
0% |
20% |
The images were resized to 224 x 224 |
The algorithms used were Cubic Support Vector Machine and Coarse Gaussian Support Vector Machine. |
The accuracy of these models was 83.9% and 61.6%. |
No |
No |
|
[14] |
2019 |
The dataset comprised of 2,415 images. |
The training ratio was 80% |
No data was used for validation |
The test ratio was 20% |
The images were resized |
Single Shot Detector model with the MobileNet detector & classifier. |
The accuracy was 94%. |
No |
Yes
|
|
[37] |
2019 |
The dataset comprises of 12,600 images. |
70% |
20% |
10% |
No pre-processing |
Faster RNN with MobileNetV1 |
Accuracy was 97% |
No |
No |
|
[13] |
2020 |
The dataset comprises of 2939 images. |
60% |
0 |
40% |
The images were resized to fit the model. |
The model used was MobileNetV1. |
Accuracy was 97%. |
No |
Yes |
|
[38] |
2020 |
The dataset consists of 54,306 images. |
70% |
20% |
10% |
The images were resized to 224 x 224 pixels. |
The models used were VGG16, GoogleNet and ResNet50. |
The models had accuracies of 97.82, 95.3 and 95.38 respectively. |
No |
No |
|
[28] |
2021 |
The used data set includes a total of 21,397 images consisting of healthy and four different diseases. |
80 |
0 |
20 |
The images were resized to 224 x 224. |
The models used were MobileNetV2 and ResNet50. |
The accuracy of the model was 85.4%. |
Yes |
No |
|
[29] |
2021 |
The dataset used consists of 5656 images. |
80% |
20% |
0% |
The images were resized to 224 x 224 pixels and augmented to create synthetic data. |
The model used was MobileNetV2. |
It had an accuracy of 97%. |
No |
No |
|
[18] |
2021 |
The dataset consists of 27518 images. |
80% |
0% |
20% |
The images were resized to 224 x 224 pixels |
The model used was DenseNet201. |
The accuracy of the model was 99.199%. |
No |
No |
|
[16] |
2022 |
The dataset used comprises of 5452 images. |
80% |
0% |
20% |
The images were resized to 224 x 224 |
The model used was MobileNet. |
Accuracy was 97%. |
No |
No |
|
[39] |
2022 |
The dataset used consists of 4000 images. |
70 |
20 |
10 |
The images were augmented and resized to 224 x 225 |
The models used were ResNet34 and ResNet50. |
The model had an accuracy of 99%. |
No |
No |
|
The designed System |
|
The dataset used consists of 2,517 images. |
70% |
20% |
10% |
The images were resized to the appropriate input image size/ data augmentation. |
The models used were MobileNetV2, VGG16 and ResNet50. |
The accuracies were: 98%, 92% and 75% respectively. |
Yes |
Yes |
[1] Abiodun, O.I., Jantan, A., Omolara, A.E., Dada, K.V., Mohamed, N.A., Arshad, H. (2018). State-of-the-art in artificial neural network applications: A survey. Heliyon, 4(11): e00938. https://doi.org/10.1016/j.heliyon.2018.e00938
[2] Otekunrin, O.A., Sawicka, B. (2019). Cassava, a 21st century staple crop: How can Nigeria harness its enormous trade potentials. Acta Scientific Agriculture, 3(8): 194-202. https://doi.org/10.31080/ASAG.2019.03.0586
[3] Nnadozie, A.K.O., Ume, S.I., Isiocha, S., Njoku, I.A. (2015). Nigerian Cassava potentials in national economic development. Science Journal of Business and Management, 3(5/1): 47-49. https://doi.org/10.11648/j.sjbm.s.2015030501.20
[4] Maruthi, M.N., Whitfield, E.C., Otti, G., Tumwegamire, S., Kanju, E., Legg, J.P., Mkamiloc, G., Kawukid, R., Benesie, I., Zacariasf, A., Mungag, T., Munga, F., Mbugua, E. (2019). A method for generating virus-free cassava plants to combat viral disease epidemics in Africa. Physiological and Molecular Plant Pathology, 105: 77-87. https://doi.org/10.1016/j.pmpp.2018.09.002
[5] Patil, B.L., Legg, J.P., Kanju, E., Fauquet, C.M. (2015). Cassava brown streak disease: A threat to food security in Africa. Journal of General Virology, 96(5): 956-968. https://doi.org/10.1099/jgv.0.000014
[6] Zárate-Chaves, C.A., Gómez de la Cruz, D., Verdier, V., López, C.E., Bernal, A., Szurek, B. (2021). Cassava diseases caused by Xanthomonas phaseoli pv. manihotis and Xanthomonas cassavae. Molecular Plant Pathology, 22(12): 1520-1537. https://doi.org/10.1111/mpp.13094
[7] Sangbamrung, I., Praneetpholkrang, P., Kanjanawattana, S. (2020). A novel automatic method for cassava disease classification using deep learning. Journal of Advances in Information Technology, 11(4): 241-248. https://doi.org/10.12720/jait.11.4.241-248
[8] Legg, J.P., Thresh, J.M. (2000). Cassava mosaic virus disease in East Africa: A dynamic disease in a changing environment. Virus Research, 71(1-2): 135-149. https://doi.org/10.1016/S0168-1702(00)00194-5
[9] Guo, Y., Liu, Y., Oerlemans, A., Lao, S., Wu, S., Lew, M.S. (2016). Deep learning for visual understanding: A review. Neurocomputing, 187: 27-48. https://doi.org/10.1016/j.neucom.2015.09.116
[10] Mohanty, S.P., Hughes, D.P., Salathé, M. (2016). Using deep learning for image-based plant disease detection. Frontiers in Plant Science, 7: 1419. https://doi.org/10.3389/fpls.2016.01419
[11] Atila, Ü., Uçar, M., Akyol, K., Uçar, E. (2021). Plant leaf disease classification using EfficientNet deep learning model. Ecological Informatics, 61: 101182. https://doi.org/10.1016/j.ecoinf.2020.101182
[12] LeCun, Y., Bengio, Y., Hinton, G. (2015). Deep learning. Nature, 521(7553): 436-444. https://doi.org/10.1038/nature14539
[13] Ramcharan, A., McCloskey, P., Baranowski, K., Mbilinyi, N., Mrisho, L., Ndalahwa, M., Legg, J., Hughes, D.P. (2019). A mobile-based deep learning model for cassava disease diagnosis. Frontiers in Plant Science, 10: 272. https://doi.org/10.3389/fpls.2019.00272
[14] Ramcharan, A., Baranowski, K., McCloskey, P., Ahmed, B., Legg, J., Hughes, D.P. (2017). Deep learning for image-based cassava disease detection. Frontiers in Plant Science, 8: 1852. https://doi.org/10.3389/fpls.2017.01852
[15] Ashwinkumar, S., Rajagopal, S., Manimaran, V., Jegajothi, B. (2022). Automated plant leaf disease detection and classification using optimal MobileNet based convolutional neural networks. Materials Today: Proceedings, 51: 480-487. https://doi.org/10.1016/j.matpr.2021.05.584
[16] Hassan, S.M., Maji, A.K., Jasiński, M., Leonowicz, Z., Jasińska, E. (2021). Identification of plant-leaf diseases using CNN and transfer-learning approach. Electronics, 10(12): 1388. https://doi.org/10.3390/electronics10121388
[17] Tiwari, V., Joshi, R.C., Dutta, M.K. (2021). Dense convolutional neural networks based multiclass plant disease detection and classification using leaf images. Ecological Informatics, 63: 101289. https://doi.org/10.1016/j.ecoinf.2021.101289
[18] Ferentinos, K.P. (2018). Deep learning models for plant disease detection and diagnosis. Computers and Electronics in Agriculture, 145: 311-318. https://doi.org/10.1016/j.compag.2018.01.009
[19] Wagle, S.A. (2021). A deep learning-based approach in classification and validation of tomato leaf disease. Traitement du Signal, 38(3): 699-709. https://doi.org/10.18280/ts.380317
[20] Loey, M., ElSawy, A., Afify, M. (2020). Deep learning in plant diseases detection for agricultural crops: a survey. International Journal of Service Science, Management, Engineering, and Technology (IJSSMET), 11(2): 41-58. https://doi.org/10.4018/IJSSMET.2020040103
[21] Sagar, A., Dheeba, J. (2020). On using transfer learning for plant disease detection. BioRxiv, 2020-05. https://doi.org/10.1101/2020.05.22.110957
[22] Ayu, H.R., Surtono, A., Apriyanto, D.K. (2021). Deep learning for detection cassava leaf disease. In Journal of Physics: Conference Series, 1751(1): 012072. https://doi.org/10.1088/1742-6596/1751/1/012072
[23] Enkvetchakul, P., Surinta, O. (2022). Effective data augmentation and training techniques for improving deep learning in plant leaf disease recognition. Applied Science and Engineering Progress, 15(3): 3810-3810. https://doi.org/10.14416/j.asep.2021.01.003
[24] Syamsuri, B., Kusuma, G.P. (2019). Plant disease classification using Lite pretrained deep convolutional neural network on Android mobile device. Int. J. Innov. Technol. Explor. Eng, 9(2): 2796-2804. https://doi.org/10.35940/ijitee.B6647.129219
[25] Sandler, M., Howard, A., Zhu, M., Zhmoginov, A., Chen, L. C. (2018). Mobilenetv2: Inverted residuals and linear bottlenecks. In Proceedings of the IEEE Conference on Computer Vision and Pattern Recognition, pp. 4510-4520.
[26] Howard, A.G., Zhu, M., Chen, B., Kalenichenko, D., Wang, W., Weyand, T., Andreetto, M., Adam, H. (2017). Mobilenets: Efficient convolutional neural networks for mobile vision applications. arXiv preprint arXiv:1704.04861. https://doi.org/10.48550/arXiv.1704.04861
[27] Metlek, S. (2021). Disease detection from cassava leaf images with deep learning methods in web environment. International Journal of 3D Printing Technologies and Digital Industry, 5(3): 625-644. https://doi.org/10.46519/ij3dptdi.1029357
[28] Abayomi-Alli, O.O., Damaševičius, R., Misra, S., Maskeliūnas, R. (2021). Cassava disease recognition from low-quality images using enhanced data augmentation model and deep learning. Expert Systems, 38(7): e12746. https://doi.org/10.1111/exsy.12746
[29] Simonyan, K., Zisserman, A. (2014). Very deep convolutional networks for large-scale image recognition. arXiv preprint arXiv:1409.1556. https://doi.org/10.48550/arXiv.1409.1556
[30] Ali, L., Alnajjar, F., Jassmi, H.A., Gocho, M., Khan, W., Serhani, M.A. (2021). Performance evaluation of deep CNN-based crack detection and localization techniques for concrete structures. Sensors, 21(5): 1688. https://doi.org/10.3390/s21051688
[31] He, K., Zhang, X., Ren, S., Sun, J. (2016). Deep residual learning for image recognition. In Proceedings of the IEEE Conference on Computer Vision and Pattern Recognition, pp. 770-778.
[32] Okokpujie, K.O., Reuben, A.B.E.R.E., Ofoche, J.C., Okokpujie, I.P. (2021). A comparative analysis performance of data augmentation on age-invariant face recognition using pretrained residual neural network. Journal of Theoretical and Applied Information Technology, 99(6): 1817-3195.
[33] Okokpujie, K., John, S., Ndujiuba, C., Badejo, J.A., Noma-Osaghae, E. (2021). An improved age invariant face recognition using data augmentation. Bulletin of Electrical Engineering and Informatics, 10(1): 179-191. https://doi.org/10.11591/eei.v10i1.2356
[34] De Ocampo, A.L.P., Dadios, E.P. (2018). Mobile platform implementation of lightweight neural network model for plant disease detection and recognition. In 2018 IEEE 10th International Conference on Humanoid, Nanotechnology, Information Technology, Communication and Control, Environment and Management (HNICEM), pp. 1-4. https://doi.org/10.1109/HNICEM.2018.8666365
[35] Emuoyibofarhe, O., Emuoyibofarhe, J.O., Adebayo, S., Ayandiji, A., Demeji, O., James, O. (2019). Detection and classification of cassava diseases using machine learning. International Journal of Computer Science and Software Engineering, 8(7): 166-176.
[36] Selvaraj, M.G., Vergara, A., Ruiz, H., Safari, N., Elayabalan, S., Ocimati, W., Blomme, G. (2019). AI-powered banana diseases and pest detection. Plant Methods, 15: 1-11. https://doi.org/10.1186/s13007-019-0475-z
[37] Barman, U., Choudhury, R.D., Sahu, D., Barman, G.G. (2020). Comparison of convolution neural networks for smartphone image based real time classification of citrus leaf disease. Computers and Electronics in Agriculture, 177: 105661. https://doi.org/10.1016/j.compag.2020.105661
[38] Mohameth, F., Bingcai, C., Sada, K.A. (2020). Plant disease detection with deep learning and feature extraction using plant village. Journal of Computer and Communications, 8(6): 10-22. https://doi.org/10.4236/jcc.2020.86002
[39] Chohan, M., Khan, A., Chohan, R., Katpar, S.H., Mahar, M.S. (2020). Plant disease detection using deep learning. International Journal of Recent Technology and Engineering, 9(1): 909-914. https://doi.org/10.35940/ijrte.A2139.059120