Mohammed Gollapalli* | Sheriff A. Kudos | Mustafa A. Alhamad | Abdullah A. Alshehri | Hamad S. Alyemni | Mustafa O. Alali | Rami M. Mohammad | Mohammad Aftab Alam Khan | Mamoun M. Abdulqader | Khalid M. Aloup
© 2022 IIETA. This article is published by IIETA and is licensed under the CC BY 4.0 license (http://creativecommons.org/licenses/by/4.0/).
OPEN ACCESS
The global proliferation of COVID-19 prompted research towards the virus's detection and eventual eradication. One important area of research is the use of machine learning (ML) to realize and battle COVID-19. The goal of this study is to use machine learning to monitor COVID and non-COVID-19 patients and decide whether or not to transfer them to the intensive care unit (ICU). The precise disease diagnosis was essential due to the lack of oxygen supplementation in the majority of hospitals around the world. It will improve the effectiveness of the ICU facilities and lessen the load on the medical personnel and the ICU facilities by accurately forecasting how patients will be treated. If stable patients are recognized among all patients, home treatment could be established for stable patients. In this research, three machine learning algorithms were chosen as the method used, which are K-Nearest Neighbor (KNN), Support Vector Machine (SVM), and Extra Tree Classifier. These algorithms were chosen for their simplicity and robustness and based on the conducted literature review. A dataset containing 100 ICU and 131 stable patients of Covid and non-Covid samples from 24th Moscow City State Hospital was used. By using SMOTE technique with 10-fold cross-validation and feature selection on the dataset, KNN achieved an accuracy of 94.65%, SVM with an accuracy of 94.65%, and an accuracy of 96.18% for the Extra Tree Classifier. The outcomes of this research on the selected dataset prove how accurate these algorithms were able to predict the classes.
COVID-19, intensive care unit, machine learning, K-Nearest Neighbor, support vector machine, extra tree classifier
Since the outbreak of Coronavirus in 2019 (COVID-19), the disease has gone on to become a pandemic worldwide. As of April 2021, there have been 136, 056, 956 cases of COVID-19 confirmed globally, with about 3 million deaths [1]. The ICU is physically, economically, and emotionally strained as the COVID-19 pandemic progresses [2]. The COVID-19 crisis exposed the insecurity of healthcare facilities, demonstrating how they can quickly become overburdened beyond the capability of available ICU beds and ventilators. Predictive approaches have been presented to help healthcare organizations prepare ahead for funding, staffing, ICU availability, and hospital bed capacity [3]. For the preparation of a partial reduction or full cancellation of non-emergency care, as well as non-urgent admissions, an early estimate of the proportion of current hospital or ICU capability that needs to be liberated is needed [4].
For ICU departments to learn which patients have COVID-19 and which do not, hospitals started developing new ways to detect Coronavirus carriers. Several innovations have increased the ICU capacity for COVID-19 patients by converting post-anesthesia care units (PACUs), medical tents, deploying care personnel, and others into ICUs. Following some previous pandemics such as influenza, reports have helped increase the capacity as well as rescheduling the non-urgent optional strategies. All of this showed that the current capacity is short and should be increased in the future [5].
Machine learning (ML) has proven to be an important field of study over the last decade, addressing many incredibly challenging and difficult problems in the real world, including healthcare [6]. In this study, KNN, Extra Trees, and SVM models are proposed to predict whether Covid and non-Covid-19 patients admitted will need ICU or not. Our study can also be used to prove whether a patient is stable or not. These predictions can also be used to show that the current ICU capacity is inadequate and that additional capacity will be required in the future [5].
Baranovskii et al. [7] involving the same dataset used in this paper employed a statistical method. This paper uses machine learning algorithms in the name of Extra Tree, KNN, and SVM. These three techniques have proved to be important in classification, with KNN providing simplicity [8], while SVM is well known for its robustness [9]. Extra Tree is Extra Trees have shown to be resistant to overfitting [10]. These three classifiers have been used in several Covid-19 medical applications, yielding very good results [11, 12].
Support Vector Machine (SVM), Extra Tree Classifier, and K-Nearest Neighbor (KNN) were deployed in this study. A SMOTE technique was used on the dataset to balance the data. 10 folds cross-validations and feature selection were then applied. Both KNN and SVM achieved an accuracy of 94.65%, whiles the Extra Tree Classifier achieved the highest accuracy of 96.18%.
The remainder of this article is divided into the following sections. An overview of related literature is presented in Section 2. The materials and methodology, which include the design tools, dataset description, data preprocessing, and description of proposed techniques, are covered in Section 3. Section 4 contains the empirical studies while Section 5 presents the results and analysis. Knowledge Extraction is presented in Section 6 and finally, Section 7 concludes the paper.
Since the onset of the COVID-19 pandemic in late 2019, much effort has been made to find the cure, as well as the vaccine for this illness. Until recently, several attempts in medicine have been to evaluate the treatment of this disease, but none has proven to be very effective. Before the vaccine was recently discovered, most of the therapy for covid-19 was trying out different medications and looking for the ones which look more likely to be effective in its treatment. Further clinical studies have been made using different treatments along with a placebo to find out the recovery time of this medication as compared to the placebo.
Using Artificial Intelligence and Machine Learning algorithms, Pourhomayoun and Shakibi [13] were able to determine, as well as predict the health and mortality risk associated with covid-19 patients. They used a dataset of 2,670,000 patients diagnosed with covid-19 in 146 countries, out of which 307,382 were labeled samples. The aim was to help hospitals and medical facilities decide on which patients needed immediate attention. Their results showed 89.98% accuracy in the prediction of mortality. Their method included Artificial Neural Networks, Decision trees, Logistics Regression, Support Vector Machine (SVM), and K-Nearest Neighbor (KNN).
In China, Kang et al. [14] developed a model to predict the severity of COVID-19 in people diagnosed with sars-Cov-2. With a total of 151 cases, they used 5 steps in their methods namely feature selection, model building, data splitting, prevention of overfitting, and evaluation combined with artificial neural network algorithms. Their focus was on Artificial Neural Networks and their model achieved an accuracy of 0.953, which can be of benefit in the treatment of covid-19 patients.
To predict Covid-19 cases, a combination of machine learning methods with adaptive neuro-fuzzy inference systems as well as enhanced beetle antennae search swarm intelligence metaheuristics was used [15]. Each method played a role in the job, enhanced beetle antennae search provided a utilization that determined parameters of the adaptive neuro-fuzzy inference system and overall enhanced the performance of the prediction model. First, the model was implemented with enhanced beetle antennae search algorithm that made the deficiencies of the original model no longer a problem, after that, it was tested and validated against a wider set of benchmark functions and proved that it outperformed the original implementation. The dataset for the cases was taken from World Health Organization for China’s outbreak. The previously mentioned method achieved an accuracy of 0.9763 (CESBAS-ANFIS) which is relatively high compared to the accuracy of 0.9645 achieved by (FPASSA-ANFIS). Finally, to further prove the robustness of the proposed method, it was tested on other datasets of weekly influenza confirmed cases in China and the USA, ending with a better result compared to other proposed sophisticated approaches proving its superiority.
In predicting the number of individuals who are going to be affected by COVID-19, Mojjada et al. [6] used Machine Learning models in their study. The methods used for prediction were exponential smoothing (ES), the lower Absolute Reductor and Selection Operator (LASSo), Vector Assistance (SVM), and four normal potential forecasts like Linear Regression (LR). What this study is trying to get out of these methods is the prediction of the following: mortality rates, recovered estimates in the next 10 days, and the number of newly infected people by COVID-19. It was concluded that the pandemic will go worse as the prediction shows that the mortality rate will rise, and the survival rate will decline according to the SVM, and LR along with LASSo which has been effective in the estimation and verification of the death rate to an extent. The ES performed better in the current forecast domain.
In a study by Arvind et al. [16], a machine learning algorithm was developed to diagnose intubation among patients diagnosed or on suspicion of COVID-19. A machine learning algorithm was trained to predict the aforementioned based on prior vitals, laboratory, and demographic data, and then it was compared to the ROX index, a validated prognostic tool for the prediction of mechanical ventilation. The Area under the ROC Curve (AUC) and Area Under the Precision-Recall Curve (AUPRC) showed that the prediction model of the study used outperformed the ones that ROX used significantly with an accuracy of 0.83 and 0.32 of AUC and AUPRC respectively, while’s ROX’s AUC had an accuracy of 0.64 and AUPRC accuracy of 0.13
To figure out the factors that determine the survivability and the experience of adult patients with confirmed COVID-19 cases [17], 66,123 patients’ records were picked from “nominal records of a normative and web-based system for the epidemiological surveillance of viral respiratory diseases” that belongs to the Mexican Institute of Social Security. The patient records were inserted into a regression model that determined the survival rate of the patients. The 7-day survival was 72.2% which went down to 47.6%, 35.0%, and 23.9% on days 15, 21, and 30 of their hospital stay respectively. Within the study, it was found that the factors that were connected to an increased risk of death were male gender, age, pneumonia upon admission to the hospital, immunosuppression, and personal history of chronic non-communicable diseases. It was found that there was a reduced risk of fatality among patients with asthma history.
The study of Annweiler et al. [18] had the objective of finding whether Vitamin D can improve the survival rates among frail elders. Their experiment included 66 residents of a nursing home split into two groups. The first group is called the “Intervention group” which was given vitamin D3 supplements during COVID-19 or in the preceding month. And the other group which was called the “Comparator Group” included the rest of the participants. The study focuses on two outcomes. The first outcome is COVID-19 mortality, and the second outcome is the ordinal scale for clinical improvement (OSCI). 82.5% of the participants in the intervention group survived COVID-19, as compared to 44.4% of the participants in the Comparator group. It was found that there is a correlation between bolus vitamin D3 supplements during or before COVID-19 and less severity of COVID-19 with a better survival rate.
Although most of the papers reviewed in this study do not correspond to our work, it can be noticed that most of the papers implemented algorithms like Support Vector Machine (SVM) and K-NN. This shows how well these algorithms perform in COVID-19 detection. As such, we hope to start with these algorithms before moving to others based on what the data says.
So far, we have not come across any work which classifies Covid-19 patients into ICU or non-ICU patients using machine learning and data science. This gives more reason for conducting this experiment as an addition to the studies done on Covid-19.
This section outlines the conceptual framework for predicting COVID and non-COVID-19 patients in Hospital’s Intensive Care Unit(ICU).
3.1 Design and tools
This experiment was carried out using Python on Juypter IDE. Part of the preprocessing was performed on Excel. Scikit-learn library was used to implement machine learning techniques and algorithms. Pandas were used for data analysis and manipulation such as loading the dataset into python, data inspection, and visualizing the class counts Imblearn library's SMOTE technique with radom state 11 was used to oversample the minority class. Furthermore, the Finally, Matplotlib library was used for plotting the findings.
KNN, SVM, and Extra Tree Classifier models were then deployed in training the dataset. GridsearchCV algorithm was used in obtaining the optimal parameters.
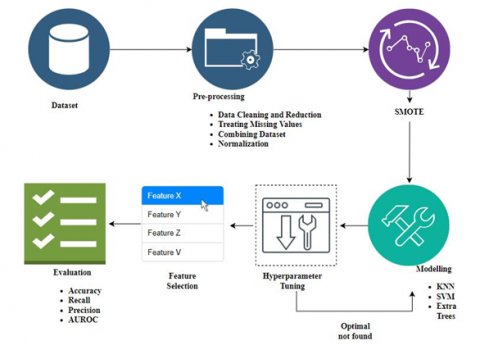
Figure 1. Workflow
Sequential Feature Selection with the forwarding technique available in the mxltend library was used to obtain the best feature subset. Eventually, the average accuracy, recall, and precision for each model were evaluated. Finally, the confusion matrix and the AUROC for each model were plotted. All procedures in this experiment were conducted using 10-fold stratified cross-validation. Figure 1 explains the experimental framework of this study.
3.2 Description of dataset
The Dataset was obtained from Research gate [15] in a CSV format. It consists of single-center case series of COVID-19 and non-COVID-19 pneumonia patients collected from the 24th Moscow City State Hospital. The dataset contains the data on ICU-transferred (N=100) and Stable (N=131) patients with COVID-19 (N=156) and non-COVID-19 viral pneumonia (N=75) cases. Among the COVID-19 patients in this study, 82 patients developed Refractory Respiratory Failure (RRF) or Severe Acute Respiratory Distress Syndrome (SARDS) and were transferred to the Intensive Care Unit (ICU). 74 patients had a Stable course of the disease and were not transferred to ICU [7]. The ICU part had 17 attributes, whiles the Stable part had 15. The collected data are presented below in Table 1.
Table 1. Description of collected dataset
|
Attributes |
|
Gender |
|
Age (years) |
|
Age > 60 |
|
SARS-CoV-2 RT-PCR testing results |
|
Time between the disease onset and admission to the hospital (days) |
|
Time between admission to the hospital and transfer to ICU (days) |
|
Artificial lung ventilation in ICU needed |
|
C-reactive protein (CRP) upon admission (mg/L) |
|
International Normalized Ratio (INR) upon admission |
|
Prothrombin Time (PT) upon admission (sec.) |
|
Fibrinogen upon admission (mg/L) |
|
Chest Computed Tomography (CT) upon admission: Lung tissue affected (%) |
|
Platelet count upon admission (PL) (10^9/L) |
|
Chest CT1, 1 week after admission: Lung tissue affected (%) |
|
CRP1, 1 week after admission (mg/L) |
|
Platelet count, 1 week after admission (PL1) (10^9/L) |
|
Patient Identification, whether ICU/STP |
3.3 Data preprocessing
The data preprocessing stage is a critical step and ensuring that the data is clean and suitable for use in developing the ML models. This helps to enhance the model's accuracy and efficiency. The first two steps of the data preprocessing were conducted using Excel. Subsequent steps were performed with the python programming language. The following steps outline the data preprocessing stage:
3.3.1 Data cleaning and reduction
The first step was to make the dataset look equal in terms of attributes. The dataset came in 2 parts, one for ICU patients and the other for Stable patients. The ICU part had 17 attributes whiles the Stable part had 15 attributes. The extra two attributes in the ICU part which were: ‘Time between admission to the hospital and transfer to ICU (days)’ and ‘Artificial lung ventilation in ICU’ were deleted. Consequently, we had an equal number of attributes for the dataset. The final dataset used for the experiment is shown in Table 2.
Table 2. Cleaned dataset
|
Attributes |
|
Gender |
|
Age (years) |
|
Age > 60 |
|
SARS-CoV-2 RT-PCR testing results |
|
Time between the disease onset and admission to the hospital (days) |
|
C-reactive protein (CRP) upon admission (mg/L) |
|
International Normalized Ratio (INR) upon admission |
|
Prothrombin Time (PT) upon admission (sec.) |
|
Fibrinogen upon admission (mg/L) |
|
Chest Computed Tomography (CT) upon admission: lung tissue affected (%) |
|
Platelet count upon admission (PL) (10^9/L) |
|
Chest CT1, 1 week after admission: Lung tissue affected (%) |
|
CRP1, 1 week after admission (mg/L) |
|
Platelet count, 1 week after admission (PL1) (10^9/L) |
|
Patient Identification, whether ICU/STP |
3.3.2 Treating missing values
The next step was dealing with missing values. Both the ICU and Stable patients’ datasets had missing values in 9 attributes. The number of missing values in each attribute is shown in the table below. The missing values were fixed with the mean of each attribute. Table 3 shows the number of missing values for each dataset.
The missing values for the attributes in each dataset were fixed with their mean. Eq. (1) shows the formula for the mean.
$\operatorname{Mean}(\bar{x})=\frac{\sum X}{n}$ (1)
where, ∑X denotes the sum of all data points, and n represents the number of data points. Table 4 shows the mean for the attributes of each dataset.
Table 3. Number of missing values
|
Attributes |
Number of Missing Values |
|
|
ICU |
Stable |
|
|
Time |
1 |
3 |
|
CPR |
3 |
3 |
|
INR |
14 |
9 |
|
PT |
14 |
9 |
|
Fibrinogen |
32 |
18 |
|
Chest CT |
12 |
21 |
|
CPR1 |
46 |
4 |
|
Chest CT1 |
44 |
7 |
|
PL |
42 |
8 |
Table 4. Mean of missing values
|
Attributes |
Local mean of attributes with missing values |
|
|
ICU |
Stable |
|
|
Time |
7 |
8 |
|
CPR |
122 |
56.5 |
|
INR |
1.27 |
1.22 |
|
PT |
13.8 |
13.3 |
|
Fibrinogen |
4.77 |
4.92 |
|
Chest CT |
60 |
50 |
|
CPR1 |
132.5 |
7 |
|
Chest CT1 |
80 |
40 |
|
PL |
193 |
307 |
3.3.3 Combining the datasets
The two datasets were then combined and uploaded into the Jupyter IDE for further preprocessing. The ‘Patient Identification’ was changed from ‘ICU’ and ‘STP’ to 1 and 0, respectively. The statistical analysis of the dataset is presented in Table 5. It presents the mean, median, standard deviation, maximum and minimum values of the two datasets after they were integrated.
Table 5. Statistical analysis of the dataset
|
Attribute |
Mean |
Median |
Standard deviation |
Maximum |
Minimum |
|
Gender |
0.567 |
1 |
0.496 |
1 |
0 |
|
Age |
58.385 |
59 |
15.12 |
94 |
20 |
|
Age > 60 |
0.463 |
0 |
0.499 |
1 |
0 |
|
SARS-CoV-2 RT-PCR |
0.675 |
1 |
0.469 |
1 |
0 |
|
Time |
8.597 |
7 |
6.471 |
50 |
1 |
|
CPR |
97.032 |
86 |
67.209 |
328 |
1 |
|
INR |
1.273 |
1.24 |
0.151 |
1.92 |
0.98 |
|
PT |
13.912 |
13.5 |
1.644 |
20.6 |
10.7 |
|
Fibrinogen |
4.917 |
4.77 |
1.173 |
11.48 |
1.24 |
|
PL |
182.654 |
50 |
75.176 |
493 |
38 |
|
Chest CT |
52.446 |
170 |
16.546 |
92 |
10 |
|
CPR1 |
66.061 |
27 |
71.123 |
323 |
0 |
|
Chest CT1 |
52.39 |
52 |
24.471 |
100 |
0 |
|
PL1 |
260.212 |
248 |
96.83 |
547 |
14 |
3.3.4 Normalization
The dataset was normalized using sklearn prebuilt MinMaxScaler which according to Arvind et al. [16], rescales the dataset between ranges of 0 to 1. This keeps the shape of the original distribution and does not change the embedded information in them. The formula for the MinMaxSclare is given in Eq. (2) as:
$z_i=\frac{x_i-\min (x)}{\max (x)-\min (x)}$ (2)
where, zi is the scaled value, and max(x) and min(x) are the maximum and minimum values of the attribute x.
3.3.5 SMOTE
Synthetic Minority Oversampling Technique is a strategy for generating synthetic samples from the minority class. It has the potential to outperform basic oversampling and it is one of the most used techniques [19]. SMOTE balances the two classes by resampling [17]. It does so by the generation of new synthetic samples from the minority class based on small sets of nearby instances, which are found via k-NN. It is given by Eq. (3):
$s=x+u \cdot\left(x^R-x\right)$ (3)
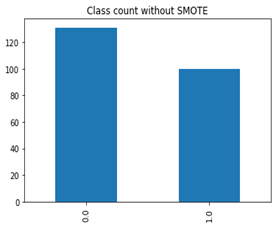
The data imbalance is caused by the STP class having 31 more records than the ICU class as shown in Figure 2.where, x denotes the sample of the minority class, xR are samples randomly chosen from x’s nearest neighbor, R is an integer value, and u is any random value between 0 and 1.
Figure 2. Before SMOTE
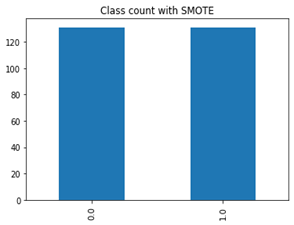
The latter class has been oversampled to 131 to match the former as demonstrated in Figure 3. In the end, both classes ended up having 131 samples when it was 100 for ICU and 131 for STP.
Figure 3. After SMOTE
3.4 Description of the proposed techniques
In this experiment, we used three classification algorithms. These are K Nearest Neighbor, Support Vector Machine, and Extra Tree Classifier. These algorithms are briefly described below.
3.4.1 K-Nearest Neighbor (K-NN)
K-nearest neighbor (KNN) is one of the basic and oldest classification algorithms techniques. K in KNN stands for the number of nearest neighbors consider in the voting. For the same sample object, various values for 'K' can result in different classification results [20]. A distance metric is used to choose the value for k. K-NN is used for classification as well as regression due to its simplicity in understanding and implementation [21]. K-NN is considered to be a Lazy Learning technique as its classification is training-based [21].
3.4.2 Support Vector Machine (SVM)
The Support Vector Machine (SVM) is one of the most well-known machine learning algorithms today [22]. This algorithm has a higher level of robustness and accuracy than other algorithms [23]. It consists of supervised machine learning models that include a kernel function for regression (SVR) and nonlinear classification (SVC) [24]. SVM was originally designed for classification models, however, it is currently being used in regression models [25]. In two-class learning, SVM determines the best optimal classification feature to distinguish between the members of the two classes in a given training data. It is capable of restricting the effects of outliers by defining the hyperplane using relevant data points as support vectors, thereby making it more favorable than other models. It is more accurate than neural networks since it is not affected by overfitting [24].
3.4.3 Extra tree classifier
Extra Tree Classifier [26] is similar to the random forest ensemble technique and differs from it in the construction mode of the ensemble of the trees. As described by Mojjada et al. [6] it is a classification and regression ensemble method to adopt a randomized tree. The Extra-Trees classifier generates a set of unpruned decision trees using the standard top-down method. It entails heavily randomizing both attribute and cut-point selection while splitting a tree node [27]. In the most extreme case, it generates entirely randomized trees with structures independent of the training sample’s output values [28]. The main logic of the algorithm is explicit randomization and has attributes combined with ensemble averaging, which reduces contrasts or similarities more than how other methods do it. Its increased accuracy is due to how it smooths and reduces computational burdens by optimal cut points in standard trees, making it productive in the case of many problems determined by a large number of numerical features [28].
4.1 Performance measures
Three performance metrics were utilized in this study, namely; Accuracy, Precision, and Recall.
Accuracy: is measured as the percentage of correctly classified cases out of the total number of cases [29].
Accuracy $=\frac{T P+T N}{T P+T N+F P+F N}$ (4)
Precision: It is the percentage of the positive predictions that are true positive.
Precision $=\frac{T P}{T P+F P}$ (5)
Recall: it is the proportion of the total positive that is anticipated to be positive.
Recall $=\frac{T P}{T P+F N}$ (6)
where, True Positive (TP): The outcome of correct cases classified as ICU patients; False Positive (FP): The outcome of incorrect cases classified as ICU patients.; True Negative (TN): The outcome of correct cases classified as non-ICU patients; False Negative (FN): The outcome of incorrect cases classified as non-ICU patients.
The Receiver Operating Characteristics Curve (ROC) was also plotted to visualize the performance of the models on the distribution of the class [30].
4.2 Training procedure
The importance of hyper-parameter optimization in achieving the best outcomes in any machine learning study cannot be overstated. This study used GridSearchCV with stratified 10 cross-validations to find the best hyper-parameter for each of the models as shown in Table 6. The GridSearchCV is a tool for fine-tuning model parameters. It operates by running through all of the parameters that have been fed into the parameter grid and identifying the optimal parameter combinations. Tuning hyperparameters is critical for determining the highest accuracy in each model. Table 3 shows the hyperparameters for the SMOTED and non-SMOTED datasets for each model, as well as the range, best value, and accuracy they produced.
Table 6. Hyperparameter tuning
|
Algorithm |
Sampling Technique |
Hyper-parameter |
Hyper-parameter Range |
Best Value |
|
K-NN |
Non-SMOTE |
Metric |
‘minkowski’,’manhattan’,’euclidean’ |
manhattan |
|
N_neighbors |
5,7,9,11,13,15,17,19,21,23,25,27,29,31,33,35,37,39 |
15 |
||
|
SMOTE |
Metric |
‘minkowski’,’manhattan’,’euclidean’ |
manhattan |
|
|
N_neighbors |
5,7,9,11,13,15,17,19,21,23,25,27,29,31,33,35,37,39 |
9 |
||
|
SVM |
Non-SMOTE |
Kernel |
‘linear’, ‘poly’,’rbf’, ‘sigmoid’ |
rbf |
|
Cost (C) |
1,2,3,4,5,6,7,8,9,10,15,20,25,30 |
8 |
||
|
Gamma |
1,0.1,0.01,0.001,0.0001 |
0.01 |
||
|
SMOTE |
Kernel |
‘linear’, ‘poly’,’rbf’, ‘sigmoid’ |
rbf |
|
|
Cost (C) |
1,2,3,4,5,6,7,8,9,10,15,20,25,30 |
2 |
||
|
Gamma |
1, 0.1, 0.01, 0.001, 0.0001 |
0.1 |
||
|
Extra Tree |
Non-SMOTE |
N_estimators |
100, 200, 400, 1000 |
200 |
|
Max_depth |
None, 10, 50, 100, 200, 300, 400 |
10 |
||
|
SMOTE |
N_estimators |
100, 200, 400, 1000 |
100 |
|
|
Max_depth |
None, 10, 50, 100, 200, 300, 400 |
50 |
To assess the performance of the SMOTE and the original dataset, the GridsearchCV technique was used in training the algorithms on both datasets to obtain the hyper-parameters of the algorithms. The performance of the two datasets and the models were compared in terms of recall, precision, and accuracy, using stratified 10-fold cross-validation. Table 7 compares the outcomes of the proposed models before and after the sampling.
Table 7. Testing performance of classifiers with optimal hyperparameters for SMOTE and Non-SMOTE
|
Algorithm |
Sampling Technique |
Testing Recall |
Testing Precision |
Testing Accuracy |
|
KNN |
Original |
85.00% |
96.59% |
92.20% |
|
SMOTE |
90.83% |
94.44% |
92.74% |
|
|
SVM |
Original |
90.00% |
96.77% |
94.37% |
|
SMOTE |
92.36% |
95.27% |
93.89% |
|
|
Extra Tree |
Original |
90.00% |
94.73% |
93.50% |
|
SMOTE |
95.41% |
97.65% |
96.56% |
The results in Table 7 show a little change in accuracy and precision before and after using the SMOTE algorithm, but a considerable difference in recall after using the SMOTE technique. This is due to a disparity in the number of positive and negative cases in the dataset, which causes the models to be biased toward correctly predicting the negative class while the positive class is being mispredicted. To avoid further complications, it is crucial to correctly predict whether a patient should be placed in ICU [31]. Consequently, an increase in the recall rate focusing on minimizing the number of FN is required. Based on the result in Table 7, it can be stated that the SMOTE technique had a favorable impact on the performance of the models, with Extra Tree achieving the best results in terms of recall, precision, and accuracy. The next experimental steps were conducted using the sampled dataset.
5.1 Feature selection
It is impossible to overstate how important feature selection is to a model's performance. By removing features that are not important to the model, feature selection aids in speeding up computation [32]. In this study, forwarding technique which is a type of sequential feature selection (SFS) was employed. In essence, sequential feature selection belongs to the wrapper techniques that employ greedy search algorithms to sequentially add and remove features from a dataset. Even though it is automatic, Sequential Feature Selection is more precise than filter approaches and offers more control than embedding methods [33]. The best feature subset produced by each of the models is presented in Table 8.
From Table 8, it can be concluded that Extra Tree Classifier is the best-performing model with the highest accuracy of 96.18% among the three models trained. It can also be observed that all the models included 'CRP, 1 week after admission (mg/L)' and 'Chest CT, 1 week after admission: lung tissue affected (%)' as part of their feature subset. This goes to show how these two attributes are crucial in determining ICU-based patients. All the models had the same number of selected features which is 7. Both KNN and SVM had the same accuracy of 94.65%.
Table 8. Results of best features
|
Model |
No. Features |
Selected Features |
Accuracy |
|
K-NN |
7 |
'CRP upon admission (mg/L)' 'Fibrinogen upon admission (mg/L)' 'Platalet count upon admission (10^9/L)' 'Chest CT upon admission: lung tissue affected (%)' 'CRP, 1 week after admission (mg/L)' 'Chest CT, 1 week after admission: lung tissue affected (%)' 'Platelet count, 1 week after admission (10^9/L)'] |
94.65% |
|
SVM |
7 |
'Gender’ 'Age (years)' 'Age >60 years' 'SARS-CoV-2 RT-PCR testing results 'CRP, 1 week after admission (mg/L)' 'Chest CT, 1 week after admission: lung tissue affected (%)' 'Platelet count, 1 week after admission (10^9/L)' |
94.65% |
|
Extra Tree |
7 |
'Age, years' 'Time between the disease onset and admission to the hospital (days)' 'CRP upon admission (mg/L)' 'Fibrinogen upon admission (mg/L)' 'Chest CT upon admission: lung tissue affected (%)' 'CRP, 1 week after admission (mg/L)' 'Chest CT, 1 week after admission: lung tissue affected (%)' |
96.18% |
5.2 Results of the final model
Table 9 shows the proposed model's overall accuracy, precision, and recall after feature selection and hyperparameter optimization. We can observe from the table that the Extra Tree Classifier prevails in accuracy and recall with a score of 96.18% and 95.41% respectively. KNN and SVM had the same score in all the performance measures, having 94.65%, 91.60%, and 97.56 in accuracy, recall, and precision respectively. Both classifiers slightly outperformed Extra Tree in precision.
Any health-related model's goal is to produce as few or no false positives as feasible. Per the recall of the three classifiers, we can conclude that the best-performing classifier is the Extra Tree. Not only did it have the highest accuracy, but also the highest recall, which signifies fewer false negatives as compared to the other two classifiers.
Table 9. Models' performance
|
Classifier |
Accuracy |
Recall |
Precision |
|
K-NN |
94.65% |
91.60% |
97.56% |
|
SVM |
94.65% |
91.60% |
97.56% |
|
Extra tree |
96.18% |
95.41% |
96.89% |
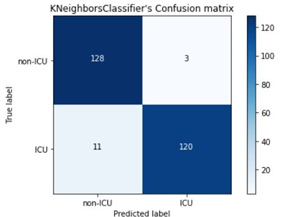
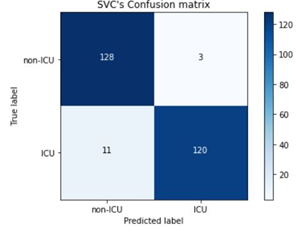
The confusion matrices of the three classifiers are presented in Figures 4-6. It is observed that both KNN and SVM had the same number of TP, TN, FP, and FN, which is evident in their performances being the same. In comparison,
KNN and SVM had the highest TN rates and least FP rates of 128 and 3 respectively, as compared to Extra Tree’s 127 and 4. Conversely, Extra Tree had the highest number of TPs which is 125 compared to the 120 of KNN and SVM. In addition, it had the least number of FN which is 6 as compared to that of KNN and SVM which is 11. The confusion matrix has brought to light how well Extra Tree is able to classify ICU patients due to its high TP rates and less FN rates, which makes it ideal in the prediction of Covid and Non-Covid patients in the ICU.
Figure 4. Extra Trees' Confusion Matrix
Figure 5. KNN's Confusion Matrix
Figure 6. SVM's Confusion Matrix
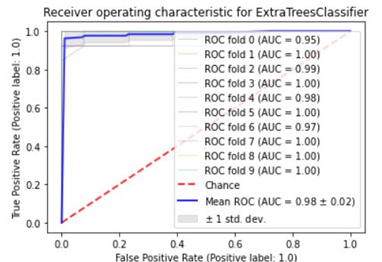
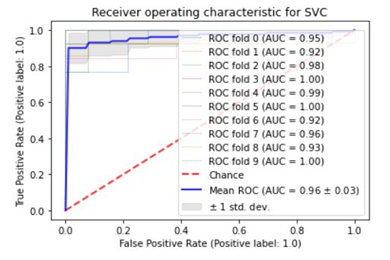
5.3 Further analysis
Figures 7-9 show the suggested model's Area Under the Receiver Operating Characteristics (AUROC). In order to assess the models' capacity to differentiate between ICU and non-ICU patients, the ROC-AUC was plotted with 10-fold cross-validation. As seen in the figure, Extra Tree Classifier had the highest AUROC score of the three, with 0.98. KNN came in second with an AUROC of 0.97 whiles SVM earned the lowest with an AUROC of 0.96. These models' performance demonstrates how well they were able to differentiate between positive and negative cases [34].
Figure 7. Extra Trees' AUROC
Figure 8. KNN's AUROC
Figure 9. SVM’s Confusion Matrix
Our research has found an effective method that is highly accurate to detect COVID and non-COVID patients in need of the intensive care unit. This will help reduce the stress on the Intensive Care Unit and make work easier for health practitioners as illustrated in the below sections.
6.1 Connection to existing literature
As mentioned before, Kang et al. [14] used such technologies to make a model for COVID-19 severity prediction. They used 151 samples in their study for pattern finding using an algorithm by the name Artificial Neural Network and they achieved 95.3% accuracy. Meanwhile, we had 231 samples rectified by SMOTE which would even the number of desired and undesired classes, then using an algorithm by the name of Extra Tree Classifier we achieved 96.18% which is slightly higher but with more samples used.
6.2 Interpretation of results
Our models were trained on several samples of Covid and the non-Covid patient either in Stable or ICU conditions. Out of the three models trained, Extra Tree Classifier had the highest accuracy of 96.18% and a recall of 95.14%. This result indicates how well the model was able to classify the positive and negative whiles minimizing the number of false negatives.
One of our findings is that we see the reliability of the aforementioned SMOTE in an unbalanced dataset. We saw an increase in recall performance in all three models used as shown in Table 9. Extra Tree Classifier saw a 5% increase in accuracy when SMOTE was applied. KNN’s accuracy also increased with the application of SMOTE In machine learning, we seek every percentage we can get, especially when it is mortality related.
We assume our study suggests that not all attributes are required for detection. The use of Feature Selection increased the accuracy whiles reducing the number of attributes. What this implies is, that with the given attributes, feature selection would reduce the number of attributes by selecting what would maximize the accuracy while having the least number of attributes, consequently making the model training faster and more efficient.
Finally, all three models selected ‘CRP, 1 week after admission (mg/L)’ and ‘Chest CT, 1 week after admission: Lung tissue affected (%)’ as part of their feature subset, which shows how important they are in the detection of ICU patients.
6.3 Limitations
The limitation of this study is its application. This study used a dataset from another country we had to get because local data is either scarce or non-existent. The demography and way of life differ from country to country. Although the results are likely to be applicable anywhere, it is better to use a dataset from where the system will be applied.
Our study alleviates the issue of having patients manually checked by practitioners which could result in a waiting queue that is potentially deadly, causing morality issues. In this study, we employed KNN, SVM, and Extra Tree Classifier on Covid and Non-Covid-19 patients’ datasets to detect Stable and ICU patients. After the application SMOTE and feature selection, the Extra Tree Classifier had the highest accuracy of 96.18%, a recall of 95.41, and a precision of 96.89 with just 7 features. This makes the Extra Tree Classifier the ideal model among the three proposed models for the detection of ICU patients. Future works can employ the ensemble technique which might produce a higher accuracy than ours. Finally, we propose an exploration of other diseases related to COVID-19 as it is a trending issue, and its victims are considerably noticeable.
[1] J.U. of M. Hopkins. (2021). Coronavirus Resource Center. https://coronavirus.jhu.edu/, accessed on Apr. 12, 2021.
[2] Christian, M.D., Devereaux, A.V., Dichter, J.R., Rubinson, L., Kissoon, N. (2014). Introduction and executive summary: Care of the critically ill and injured during pandemics and disasters: CHEST consensus statement. Chest, 146(4): 8S-34S. https://doi.org/10.1378/chest.14-0732
[3] Aziz, S., Arabi, Y.M., Alhazzani, W., et al. (2020). Managing ICU surge during the COVID-19 crisis: Rapid guidelines. Intensive Care Medicine, 46(7): 1303-1325. https://doi.org/10.1007/s00134-020-06092-5
[4] Remuzzi, A., Remuzzi, G. (2020). COVID-19 and Italy: what next?. The lancet, 395(10231): 1225-1228. https://doi.org/10.1016/S0140-6736(20)30627-9
[5] Alban, A., Chick, S.E., Dongelmans, D.A., Vlaar, A.P., Sent, D. (2020). ICU capacity management during the COVID-19 pandemic using a process simulation. Intensive care medicine, 46(8): 1624-1626. https://doi.org/10.1007/s00134-020-06066-7
[6] Mojjada, R.K., Yadav, A., Prabhu, A.V., Natarajan, Y. (2020). Machine learning models for covid-19 future forecasting. Materials Today: Proceedings. https://doi.org/10.1016/j.matpr.2020.10.962
[7] Baranovskii, D.S., Klabukov, I.D., Krasilnikova, O.A., Nikogosov, D.A., Polekhina, N.V., Baranovskaia, D.R., Laberko, L.A. (2021). Prolonged prothrombin time as an early prognostic indicator of severe acute respiratory distress syndrome in patients with COVID-19 related pneumonia. Current Medical Research and Opinion, 37(1): 21-25. https://doi.org/10.1080/03007995.2020.1853510
[8] Wu, X., Kumar, V., Ross Quinlan, J., Ghosh, J., Yang, Q., Motoda, H., McLachlan, G.J., Ng, A., Liu, B., Yu, P.S., Zhou, Z.H., Steinbach, M., Hand, D.J., Steinberg, D. (2008). Top 10 algorithms in data mining. Knowledge and Information Systems, 14(1): 1-37. https://doi.org/10.1007/s10115-007-0114-2
[9] Gollapalli, M., Alfaleh, A. (2022). An artificial intelligence approach for data modelling patients inheritance of sickle cell disease (SCD) in the eastern regions of Saudi Arabia. Mathematical Modelling of Engineering Problems, 9(4): 1079-1088. https://doi.org/10.18280/mmep.090426
[10] Okoro, E.E., Obomanu, T., Sanni, S.E., Olatunji, D.I., Igbinedion, P. (2022). Application of artificial intelligence in predicting the dynamics of bottom hole pressure for under-balanced drilling: Extra tree compared with feed forward neural network model. Petroleum, 8(2): 227-236. https://doi.org/10.1016/j.petlm.2021.03.001
[11] Pahar, M., Klopper, M., Warren, R., Niesler, T. (2021). COVID-19 cough classification using machine learning and global smartphone recordings. Computers in Biology and Medicine, 135: 104572. https://doi.org/10.1016/j.compbiomed.2021.104572
[12] Gupta, M.D., Jha, M.K., Bansal, A., et al. (2021). COVID 19-related burnout among healthcare workers in India and ECG based predictive machine learning model: Insights from the BRUCEE-Li study. Indian Heart Journal, 73(6): 674-681. https://doi.org/10.1016/j.ihj.2021.10.002
[13] Pourhomayoun, M., Shakibi, M. (2021). Predicting mortality risk in patients with COVID-19 using machine learning to help medical decision-making. Smart Health, 20: 100178. https://doi.org/10.1016/j.smhl.2020.100178
[14] Kang, J., Chen, T., Luo, H., Luo, Y., Du, G., Jiming-Yang, M. (2021). Machine learning predictive model for severe COVID-19. Infection, Genetics and Evolution, 90: 104737. https://doi.org/10.1016/j.meegid.2021.104737
[15] Zivkovic, M., Bacanin, N., Venkatachalam, K., Nayyar, A., Djordjevic, A., Strumberger, I., Al-Turjman, F. (2021). COVID-19 cases prediction by using hybrid machine learning and beetle antennae search approach. Sustainable Cities and Society, 66: 102669. https://doi.org/10.1016/j.scs.2020.102669
[16] Arvind, V., Kim, J.S., Cho, B.H., Geng, E., Cho, S.K. (2021). Development of a machine learning algorithm to predict intubation among hospitalized patients with COVID-19. Journal of Critical Care, 62: 25-30. https://doi.org/10.1016/j.jcrc.2020.10.033
[17] Murillo-Zamora, E., Hernandez-Suarez, C.M. (2021). Survival in adult inpatients with COVID-19. Public Health, 190: 1-3. https://doi.org/10.1016/j.puhe.2020.10.029
[18] Annweiler, C., Hanotte, B., de l’Eprevier, C.G., Sabatier, J.M., Lafaie, L., Célarier, T. (2020). Vitamin D and survival in COVID-19 patients: A quasi-experimental study. The Journal of Steroid Biochemistry and Molecular Biology, 204: 105771. https://doi.org/10.1016/j.jsbmb.2020.105771
[19] Blagus, R., Lusa, L. (2013). SMOTE for high-dimensional class-imbalanced data. BMC Bioinformatics, 14(1): 1-16.
[20] Uddin, S., Khan, A., Hossain, M.E., Moni, M.A. (2019). Comparing different supervised machine learning algorithms for disease prediction. BMC medical Informatics and Decision Making, 19(1): 1-16. https://doi.org/10.1186/s12911-019-1004-8
[21] Cunningham, P., Delany, S.J. (2020). k-Nearest Neighbour Classifiers. 2nd Edition (with Python examples) no. 1, pp. 1-22. https://doi.org/10.1145/3459665
[22] Duda, R.O., Hart, P.E., Stork, D.G. (1995). Pattern classification and scene analysis 2nd ed. ed: Wiley Interscience, 13: 14.
[23] Gollapalli, M., Li, X., Wood, I. (2013). Automated discovery of multi-faceted ontologies for accurate query answering and future semantic reasoning. Data & Knowledge Engineering, 87: 405-424. https://doi.org/10.1016/j.datak.2013.05.005
[24] Otchere, D.A., Ganat, T.O.A., Gholami, R., Ridha, S. (2021). Application of supervised machine learning paradigms in the prediction of petroleum reservoir properties: Comparative analysis of ANN and SVM models. Journal of Petroleum Science and Engineering, 200: 108182. https://doi.org/10.1016/j.petrol.2020.108182
[25] Olatunji, S.O. (2019). Improved email spam detection model based on support vector machines. Neural Computing and Applications, 31(3): 691-699. https://doi.org/10.1007/s00521-017-3100-y
[26] Thankachan, K. (2022). What? When? How?: ExtraTrees Classifier. Towards Data Science. https://towardsdatascience.com/what-when-how-extratrees-classifier-c939f905851c, accessed on Mar. 05, 2022).
[27] Geurts, P., Ernst, D., Wehenkel, L. (2006). Extremely randomized trees. Machine learning, 63(1): 3-42. https://doi.org/10.1007/s10994-006-6226-1
[28] Ampomah, E.K., Qin, Z., Nyame, G. (2020). Evaluation of tree-based ensemble machine learning models in predicting stock price direction of movement. Information, 11(6): 332. https://doi.org/10.3390/info11060332
[29] Gollapalli, M. (2022). Ensemble machine learning model to predict the waterborne syndrome. Algorithms, 15(3): 93.
[30] Gollapalli, M. (2015). Literature review of attribute level and structure level data linkage techniques. arXiv preprint arXiv:1510.02395.
[31] Mohammad, M.A., Aljabri, M., Aboulnour, M., Mirza, S., Alshobaiki, A. (2022). Classifying the mortality of people with underlying health conditions affected by COVID-19 using machine learning techniques. Applied Computational Intelligence and Soft Computing, 2022: 3783058. https://doi.org/10.1155/2022/3783058
[32] Gollapalli, M., Alansari, A., Alkhorasani, H., Alsubaii, M., Sakloua, R., Alzahrani, R., Al-Hariri, M., Alfares, M., AlKhafaji, D., Argan, R.A. (2022). A novel stacking ensemble for detecting three types of diabetes mellitus using a Saudi Arabian dataset: Pre-diabetes, T1DM, and T2DM. Computers in Biology and Medicine, 147, 105757. https://doi.org/10.1016/j.compbiomed.2022.105757
[33] Verma, Y. (2021). A Complete guide to sequential feature selection. Analytics India Mag (AIM). https://analyticsindiamag.com/a-complete-guide-to-sequential-feature-selection/, accessed on Apr. 13, 2022.
[34] Gollapalli, M., AlMetrik, M.A., AlNajrani, B.S., AlOmari, A.A., AlDawoud, S.H., AlMunsour, Y.Z., Abdulqader, M.M., Aloup, K.M. (2022). Task failure prediction using machine learning techniques in the google cluster trace cloud computing environment. Mathematical Modelling of Engineering Problems, 9(2): 545-553. https://doi.org/10.18280/mmep.090234