Zainal Arifin* | Zikri Nurachim | Syamsul Hadi | Rendy Adhi Rachmanto | Singgih Dwi Prasetyo
© 2022 IIETA. This article is published by IIETA and is licensed under the CC BY 4.0 license (http://creativecommons.org/licenses/by/4.0/).
OPEN ACCESS
The supply of fossil energy is decreasing along with the development of civilization and technological advances. Solar energy is one of the renewable energies that can reduce these problems. Solar cells can convert solar energy into electrical energy using the principle of the photovoltaic effect. The performance of photovoltaic panels is affected by the increase in temperature in the photovoltaic panels. This study aims to identify the effect of increasing the number of deflectors on the air concentrator which is implemented as an active cooling of solar cells. This research was carried out experimentally by integrating an air concentrator, deflector, and heatsink on a PV panel. The application of various without concentrators, concentrators without deflectors, concentrators with two deflectors, concentrators with four deflectors, and concentrators with six deflectors, the temperature values are 56.70℃, 54.66℃, 53.30℃, 51.63℃ and 53.70℃. From several variations of the addition of deflectors that have been carried out, it is found that through the application of a concentrator using four deflectors can obtain the most optimal results by producing a maximum power of 24.50 W with a total efficiency of 6.35%. In this configuration, a temperature drop of 5.07℃ is obtained.
air concentrator, air deflector, cooling method, photovoltaic
Energy demand will increase by 50% over the next two decades [1]. The use of fossil fuels has the disadvantage of being limited in number and causing environmental damage. Renewable and environmentally friendly energy sources are needed to fix this problem. Solar cells can convert solar energy into electrical energy with photovoltaic effect [2-4]. Temperature that are too high will result in lower efficiency [5]. Each solar cell has an optimum working temperature to achieve the best efficiency.
Passive and active cooling can be done for cooling solar cell. Active cooling is adding additional energy to the solar cells to cool the solar panels. Passive cooling does not require additional energy to remove heat from the solar cells, such as adding heat pipes or heat sinks to capture heat from solar cells [6]. In this research, heat sink is passive cooling.
Previous studies have used passive cooling by adding perforated fin plates as heat sinks for cooling photovoltaic modules [7-10]. Study found that using an air concentrator that maximizes airflow is effective for lowering temperature because airflow can affect the heat transfer coefficient of solar panel [11-13]. The airflow inside the concentrator can change using an air deflector [11]. A heat sink serves to expand the heat transfer area so that heat is released faster and can lower the temperature of the photovoltaic panels.
In the concentrator, the shape of the contraction determines of how the concentrator work. Design of the contraction section can accelerate the flow, reduce turbulence, creating uniform flow, and avoid flow separation [14, 15]. Amanlou et al. [11] conducted research using experimental and simulation methods to determine the effect of diffuser shape on PV/T performance. Efficiency increased up to 20% in one of the sketches.
Someshwar et al. researched on experimental methods by adding a heat sink and a diffuser with three deflectors at the bottom of the panel. Research shows that the temperature of the photovoltaic panel drops to 50℃-65℃. Efficiency of photovoltaic panels increased to 10.55 %. The diffuser with three deflectors causes the airflow under the panel to become more uniform [16].
Based on several studies that have been carried out, there are many developments that have been carried out to increase the efficiency of PV solar cells through the application of passive and active cooling systems. In the application of these two cooling systems, there are several challenges and obstacles, respectively. Heat transfer in the heat sink is affected by the air flow generated by wind concentrator. In our research, we will identify the effect of increasing the number of deflectors on a wind concentrator which is implemented as an active cooling system for PV solar cells.
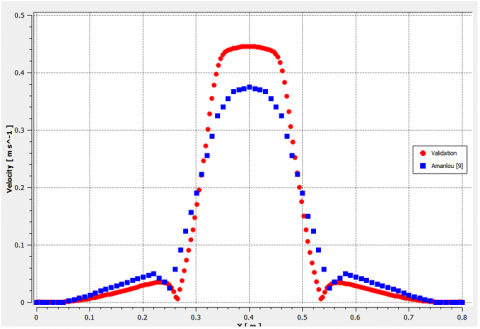
The validation of the airflow simulation in the concentrator refers to the research conducted by Amanlou et al. [11]. The study used a diffuser with an inlet velocity value of 0.5 m/s. This study resulted in a trend of velocity values at the diffuser outlet. The velocity trend is used as a reference to determine the right simulation model with a comparison of the velocity trend, as shown Figure 1.
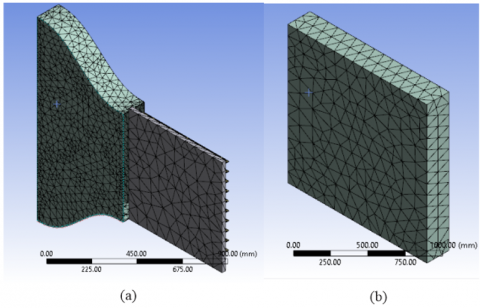
A three-dimensional geometrical model of concentrator is created to study the distribution of air velocity. Figure 2 shows the computational domain using Space Claim (variation of concentrator with deflector configuration) and generated mesh for the considered domain, respectively. The dimensional of the computational domain for the case considered are given in Table 1.
Figure 1. Comparison of velocity magnitude at outlet
Figure 2. Mesh generated for (a) concentrator, heat sink and photovoltaic panel, (b) fluid domain
Table 1. Dimension of computational domain
|
Parameters |
Dimension |
|
Length of concentrator inlet |
1235 mm |
|
Height of concentrator inlet |
150 mm |
|
Length of concentrator outlet |
655 mm |
|
Height of concentrator outlet |
150 mm |
|
Enclosure length |
1300 mm |
|
Enclosure height |
210 mm |
|
Enclosure width |
1320 mm |
Meshing in this study uses linear order elements in order to be able to adapt to the shape of the design easily. Cell size is limited to 90 mm in the entire domain. The concentrator part has a cell size value of 25 mm, the photovoltaic panel part has a cell size value of 15 and mm, and the heat sink part has a cell size value of 10 mm. This simulation aims to determine the airflow generated by the wind concentrator, so it takes a mesh that is small enough to add phenomena near the deflectors wall.
Examination was carried out under the assumption of turbulence flow in a photovoltaic system. The objective was to determine the air flow pattern. A pressure-based solver and ambient temperature of 27℃ (300 K) chosen for case to obtain simulation results. The results of the simulation shown in Figure 3.
Figure 3 shows a simulation of the temperature distribution that occurs in each variation of the concentrator. (a) shows a concentrator without deflectors, (b) shows a concentrator with two deflectors, (c) shows a concentrator with four deflectors and (d) a concentrator with six deflectors. From the contour of the velocity distribution that occurs, it can be seen that the addition of the number of deflectors can affect the velocity domain that occurs in each concentrator. The increase in wind speed causes the wind flow to become turbulent. Turbulence increases the heat transfer in the fluid particles, the speed of heat transfer and enlarges the boundary layer of the wind flow.
Figure 3. Result of ANSYS fluent simulation
Radiation intensity used in this study is the radiation intensity of a 500-Watt halogen lamp with 20 lamps. Figure 4 shows the framework of the solar simulator used by researchers. Radiation intensity used is 400 W/m2, 600 W/m2, 800 W/m2, 950 W/m2, and 1,100 W/m2. Wind generated from the blower with an average speed of 2.5 m/s and measured by an anemometer. Thermocouples for measuring the temperature of the photovoltaic panel during the experiment.
Figure 4. Solar simulator
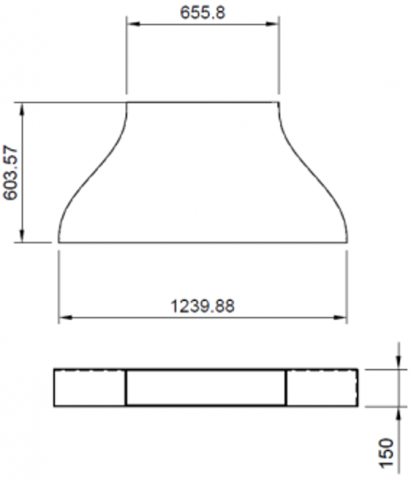
The experiment using a photovoltaic panel from Lens 50 Wp combined with a copper heat sink at the bottom of the photovoltaic panel. Concentrator is attached to the part exposed to the air generated by the blower. Configuration and size of the deflector on the air concentrator shown in Figure 5 with units of mm.
(a) Without deflector
(b) Two deflectors
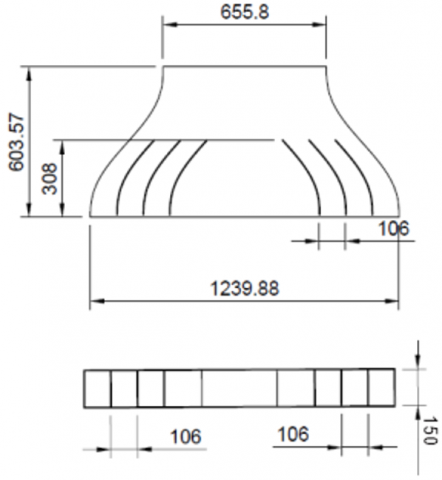
(c) Four deflectors
(d) Six deflectors
Figure 5. Air deflector configuration
3.1 Photovoltaic performance parameters
Figure 6. Scheme of the research
Figure 6 shows the scheme of this research. A Variable resistor is a variation of the load with 17 different load values to form the I-V curve. Multimeter measure the current and voltage produced by photovoltaic panels with varying loads. Once the current and voltage are obtained, then we got ISC and VOC value. PMPP and efficiency are calculated.
(1) Short circuit current (ISC) is a state of very high current (I) assuming minimum electrical resistance (R) or no resistance.
(2) Open circuit voltage (VOC) is the maximum voltage from the solar cell, and this occurs when the solar cell current is zero.
(3) Maximum Power Point (PMPP) is the product of the current (IMPP) and voltage (VMPP) produced at a point on the I-V curve, which formulated by the following equation:
$P_{M P P}=V_{M P P} \times I_{M P P}$ (1)
(4) Fill factor (FF) is the ratio between the maximum power (PMPP) with the multiplication of VOC and ISC. The fill factor (FF) formulated as follows:
$F F=\frac{P_{M P P}}{I_{S C} \times V_{O C}}=\frac{I_{M P P} \times V_{M P P}}{I_{S C} \times V_{O C}}$ (2)
(5) Efficiency (η) is the ratio between the maximum power (PMPP) and the solar radiation received by the solar cell panel (Plight). A Solar radiation power defined as the product of the intensity of sunlight (Irad) and the cross-sectional area of the solar cell (A). Efficiency calculated by the following equation:
$\eta=\frac{P_{M P P}}{I_{\text {light }}}=\frac{P_{M P P}}{I_{\text {rad }} \times A}=\frac{I_{S C} \times V_{O C} \times F F}{I_{\text {rad }} \times A}$ (3)
4.1 Temperature of photovoltaic panel
High temperature can reduce efficiency of a photovoltaic panels [17]. Razali and Someshwar stated that increasing air velocity around photovoltaic panel and heat sink could minimized the temperature difference between heat sink and environment [16, 18]. Increased air velocity can reduce panel temperature due to increasing heat transfer.
Figure 7. Radiation intensity connection with work temperature
Figure 7 shows that the temperature of the surface of the photovoltaic panels increases as the intensity of radiation received by the panels increases. The higher the radiation is given, more photon energy absorbed by the panel. Number of photons absorbed will increase the excitation of electrons in the panel. Electron excitation gives off heat, so the temperature of the photovoltaic panel will increase [9].
The highest temperature occurs in variations without a concentrator and radiation intensity of 1,100 W/m2 with a temperature value of 56.70℃. The variation with the concentrator, concentrator with two deflectors, concentrator with four deflectors, and concentrator with six deflectors has a photovoltaic temperature of 54.46℃, 53.30℃, 51.63℃, 53.70℃. Variation concentrator with four deflectors can reduce temperature up to 5.07℃ due to the distribution of air flow and velocity produced. Figure 2 shows that the four-deflector concentrator has a faster flow, indicated by the presence of redder and orange colors than other variations.
4.2 Short circuit current
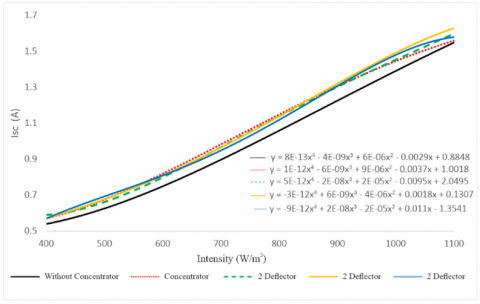
ISC can be affected by the size of the intensity of radiation given to the photovoltaic panel [19]. Measurement of ISCshown in Figure 8.
Figure 8. Radiation intensity connection with short circuit current
ISC will increase along with the intensity of radiation received by the photovoltaic panel because the photon energy received by the photovoltaic panel is getting bigger, so the photons can be excited quickly [19]. The temperature can affect the ISC value produced by photovoltaic panels [20]. Variation without concentrator, with concentrator, concentrator with two deflectors, concentrator with four deflectors, and concentrator with six deflectors has ISC value of 1.55 A, 1.56 A, 1.6 A, 1.63 A, and 1.58 A at 1,100 W/m2 intensity. ISC value has a slight difference because ISChas a small temperature coefficient.
4.3 Open circuit voltage
Singh stated that the value of VOC will increase when the intensity of radiation received by the photovoltaic panel increase, and VOC will decrease when the temperature of the photovoltaic is high [17].
Figure 9 shows the connection between intensity radiation and open-circuit voltage (VOC). Graph shows VOC increases until 600 W/m2 and decrease after 600 W/m2. Variation without concentrator, with concentrator, concentrator with two deflectors, concentrator with four deflectors, and concentrator with six deflectors has VOC value of 19 V, 19.1 V, 19.3 V, 19.4 V, and 19.2 V at 1100 W/m2 intensity. This is due to the reduced bandgap in photovoltaic panels [17].
Figure 9. Radiation intensity connection with open-circuit voltage
4.4 Maximum power
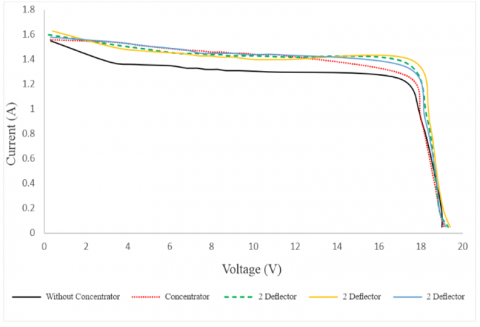
The maximum power of the photovoltaic panel obtained by multiplying current and voltage, as shown in Eq. (1). Islam’s research proves that increasing radiation intensity can increase the maximum power generated [21]. Radziemska and Zhang proved that the higher the temperature of the photovoltaic panel, the smaller the maximum power generated at the same radiation intensity [22, 23]. The I-V curve at intensity 1,100 W/m2 shown in Figure 10.
Figure 10. I-V Curve
The value of the I-V curve is obtained from the experimental results. Each variation has an I-V curve. PMPP is obtained from the highest multiplication value between IMPP and VMPP on each I-V curve. With the I-V curve we can ensure that the PMPP results have good accuracy.
Figure 11. Radiation intensity connection with maximum power
In Figure 11, all variations have a maximum power increase linearly with radiation intensity because the value of current and voltage will increase when the radiation intensity increases. Variation concentrator with four deflectors has the highest maximum power value. Variation without concentrator, with concentrator, concentrator with two deflectors, concentrator with four deflectors and concentrator with six deflectors has maximum power value of 21.12 W at 56.70℃, 21.97 W at 54.46℃, 23.73 W at 53.30℃, 24.50 W at 51.63℃, and 23.18 W at 53.70℃ because radiation will have more minor penetration when the temperature is high [23].
4.5 Efficiency
Efficiency is the maximum power (PMPP) divided by radiant power received by the photovoltaic panel (Plight). Someshwar stated that the increase in radiation intensity causes the photovoltaic panel to overheat, so the efficiency will decrease [16].
Figure 12. Temperature connection with efficiency
Figure 12 show that at intensity of 950 W/m2, variation without concentrator, concentrator without deflector, concentrator with two deflectors, concentrator with four deflectors, and concentrator with six deflectors has efficiency value of 5.38% at 52.76℃, 5.85% at 51.03℃, 6.39% at 49.43℃, 6.77% at 48.73℃, and 5.99% at 50℃. Based on these data shows that the increase in temperature is inversely proportional to the magnitude of the resulting efficiency. Solar panels in general can apply a 0.5% reduction in efficiency with every 1℃-temperature increase. Therefore, it is important to keep the panel working temperature at the most optimal condition.
Chikate et al. [24] prove that negative temperature coefficient of VOC for every increase in temperature causing lower efficiency. Increasing temperature also causes the bandgap between the valence band and the conduction band to decrease, increasing the resistance value and a slower electron transfer [25]. Slowed electron transfer causes the efficiency of the photovoltaic panel to decrease. Electron transfer accelerates when the temperature of the panel decreases and can increase the efficiency of the photovoltaic panel [26].
Research on increasing the number of deflectors in solar panel concentrators has been successfully carried out. The test was carried out at a radiation intensity of 1,100 W/m2. In photovoltaic panels, the application of a concentrator without deflector, two deflectors, four deflectors, and six deflectors can reduce the working temperature of each panel by 2.24℃, 3.40℃, 5.07℃, and 3.00℃. The use of a concentrator with four deflectors is the best variation with the lowest operating temperature compared to others, which is 51.63℃ at an intensity of 1,100 W/m2.
Photovoltaic panels that apply a variety of concentrator, concentrator with two deflectors, concentrator with four deflectors, and concentrator with six deflectors increase maximum power by 0.72 W, 2.48 W, 3.25 W, and 1.93 W at 1100 W/m2 radiation intensity and increase efficiency by 0.47%, 1.01%, 1.39%, and 0.61% at 950 W/m2 radiation intensity. Variation of the concentrator with four deflectors can increase the performance of the photovoltaic panel most optimally, namely at a maximum power of 24.50 W and efficiency of 6.77%.
The most optimal conditions are obtained from concentrators that use four deflectors because they are able to produce the most even wind flow. The addition of the number of deflectors is indeed effective in reducing the working temperature of the panel but becomes less effective if there are too many because it can interfere with the wind flow rate. the integration of concentrators, deflectors and heatsinks still has good development potential, as evidenced by the increase in panel performance in this study.
This work was partially supported by a grant from PDUPT 2021 (research grant number 221.1/UN27.22/HK.07.00/2021) from the Ministry of Research, Technology, and Higher Education, Republic of Indonesia.
|
A |
area, m2 |
|
FF |
fill factor |
|
Irad |
radiation intensity, W/m2 |
|
ISC |
current at zero resistance, A |
|
IMPP |
current at maximum power |
|
P |
power, W |
|
PMPP |
maximum power generated, W |
|
Plight |
radiation power, W |
|
R |
resistance, Ω |
|
T |
temperature, ℃ |
|
v |
velocity, m/s |
|
VMPP |
voltage at maximum power, V |
|
VOC |
voltage at zero current, V |
|
Greek symbols |
|
|
η |
efficiency, % |
[1] Sumathi, S., Ashok Kumar, L., Surekha, P. (2015). RETRACTED CHAPTER: Soft computing techniques in wind energy conversion systems. In RETRACTED BOOK: Solar PV and Wind Energy Conversion Systems, pp. 309-390. http://dx.doi.org/10.1007/978-3-319-14941-7_5
[2] Soliman, A.M., Hassan, H., Ookawara, S. (2019). An experimental study of the performance of the solar cell with heat sink cooling system. Energy Procedia, 162: 127-135. https://doi.org/10.1016/j.egypro.2019.04.014
[3] Prasetyo, S.D., Prabowo, A.R., Arifin, Z. (2022). The effect of collector design in increasing PVT performance: Current state and milestone. Materials Today: Proceedings, 63: S1-S9. https://doi.org/10.1016/j.matpr.2021.12.356
[4] Arifin, Z., Prasetyo, S.D., Prabowo, A.R., Tjahjana, D.D.D.P., Rachmanto, R.A. (2021). Effect of thermal collector configuration on the photovoltaic heat transfer performance with 3D CFD modeling. Open Engineering, 11(1): 1076-1085. https://doi.org/10.1515/eng-2021-0107
[5] Yu, Y., Yang, H., Peng, J., Long, E. (2019). Performance comparisons of two flat-plate photovoltaic thermal collectors with different channel configurations. Energy, 175: 300-308. https://doi.org/10.1016/j.energy.2019.03.054
[6] Prajapati, S., Fernandez, E., Saxena, R. (2017). Experimental investigations on the performance of PV modules with/without module cooling. International Journal of Research in Electronics and Computer Engineering, 5(4): 92-96.
[7] Popovici, C.G., Hudişteanu, S.V., Mateescu, T.D., Cherecheş, N.C. (2016). Efficiency improvement of photovoltaic panels by using air cooled heat sinks. Energy Procedia, 85: 425-432. https://doi.org/10.1016/j.egypro.2015.12.223
[8] El Mays, A., Ammar, R., Hawa, M., Abou Akroush, M., Hachem, F., Khaled, M., Ramadan, M. (2017). Improving photovoltaic panel using finned plate of aluminum. Energy Procedia, 119: 812-817. https://doi.org/10.1016/j.egypro.2017.07.103
[9] Arifin, Z., Tjahjana, D.D.D.P., Hadi, S., Rachmanto, R.A., Setyohandoko, G., Sutanto, B. (2020). Numerical and experimental investigation of air cooling for photovoltaic panels using aluminum heat sinks. International Journal of Photoenergy, 2020: 1-9. https://doi.org/10.1155/2020/1574274
[10] Maulana, A., Rachmanto, R.A., Hadi, S., Arifin, Z. (2021). Photovoltaic performance with heat sink from copper and aluminum material. In IOP Conference Series: Materials Science and Engineering, 1096(1): 012051. https://doi.org/10.1088/1757-899x/1096/1/012051
[11] Amanlou, Y., Hashjin, T.T., Ghobadian, B., Najafi, E.G. (2018). Air cooling low concentrated photovoltaic/thermal (LCPV/T) solar collector to approach uniform temperature distribution on the PV plate. Applied Thermal Engineering, 141: 413-421. https://doi.org/10.1016/j.applthermaleng.2018.05.070
[12] Prasetyo, S.D., Prabowo, A.R., Arifin, Z. (2022). Investigation of thermal collector nanofluids to increase the efficiency of photovoltaic solar cells. International Journal of Heat and Technology, 40(2): 415-422. https://doi.org/10.18280/ijht.400208
[13] Prasetyo, S.D., Harsito, C., Sutanto, Suyitno. (2019). Energy consumption of spray dryer machine for producing red natural powder dye and its stability. In AIP Conference Proceedings, 2097(1): 030076. https://doi.org/10.1063/1.5098251
[14] Bell, J.H., Mehta, R.D. (1988). Contraction design for small low-speed wind tunnels (No. NASA-CR-177488).
[15] Arifin, Z., Tribhuwana, B.A., Kristiawan, B., Tjahjana, D.D.D.P., Hadi, S., Rachmanto, R.A., Prasetyo, S.D., Hijriawan, M. (2022). The effect of soybean wax as a phase change material on the cooling performance of photovoltaic solar panel. International Journal of Heat and Technology, 40(1): 326-332. https://doi.org/10.18280/ijht.400139
[16] Bhakre, S.S., Sawarkar, P.D. (2021). Effect of air distribution on cooling of photovoltaic panel and its performance. In Advances in Mechanical Engineering, pp. 495-502. https://doi.org/10.1007/978-981-15-3639-7_59
[17] Singh, P., Ravindra, N.M. (2012). Temperature dependence of solar cell performance—an analysis. Solar Energy Materials and Solar Cells, 101: 36-45. https://doi.org/10.1016/j.solmat.2012.02.019
[18] Razali, A.A., Sadikin, A. (2015). CFD simulation study on pressure drop and velocity across single flow microchannel heat sink. Journal of Advanced Research Design, 8: 12-21.
[19] Khan, F., Singh, S.N., Husain, M. (2010). Effect of illumination intensity on cell parameters of a silicon solar cell. Solar Energy Materials and Solar Cells, 94(9): 1473-1476. https://doi.org/10.1016/j.solmat.2010.03.018
[20] Javed, A. (2014). The effect of temperatures on the silicon solar cell. International Journal of Emerging Technologies in Computational and Applied Sciences (IJETCAS).
[21] Islam, M.N., Rahman, M.Z., Mominuzzaman, S.M. (2014). The effect of irradiation on different parameters of monocrystalline photovoltaic solar cell. In 2014 3rd International Conference on the Developments in Renewable Energy Technology (ICDRET), pp. 1-6. https://doi.org/10.1109/ICDRET.2014.6861716
[22] Zhang, L., Yu, Y., Ma, H., Zhang, Y., Cao, P. (2018). Design of photovoltaic power supply MPPT circuit for wsn node based on current observation. International Journal of Online Engineering, 14(7): 45-61. https://doi.org/10.3991/ijoe.v14i07.8495
[23] Radziemska, E. (2003). The effect of temperature on the power drop in crystalline silicon solar cells. Renewable Energy, 28(1): 1-12. https://doi.org/10.1016/S0960-1481(02)00015-0
[24] Chikate, B.V., Sadawarte, Y., Sewagram, B.D.C.O.E. (2015). The factors affecting the performance of solar cell. International Journal of Computer Applications, 1(1): 0975-8887.
[25] Furkan, D., Mehmet Emin, M. (2010). Critical factors that affecting efficiency of solar cells. Smart Grid and Renewable Energy, 1(1): 47-50. https://doi.org/10.4236/sgre.2010.11007
[26] Menni, Y., Chamkha, A.J., Lorenzini, G., Kaid, N., Ameur, H., Bensafi, M. (2019). Advances of nanofluids in solar collectors - a review of numerical studies. Mathematical Modelling of Engineering Problems, 6(3): 415-427. https://doi.org/10.18280/mmep.060313