Mohammed S.M. Noori* | Rafaa M. Abbas
© 2022 IIETA. This article is published by IIETA and is licensed under the CC BY 4.0 license (http://creativecommons.org/licenses/by/4.0/).
OPEN ACCESS
In earthquake engineering problems, uncertainty exists not only in the seismic excitations but also in the structure's parameters. This study investigates the influence of structural geometry, elastic modulus, mass density, and section dimension uncertainty on the stochastic earthquake response of a multi-story moment resisting frame subjected to random ground motion. The North-south component of the Ali Gharbi earthquake in 2012, Iraq, is selected as ground excitation. Using the power spectral density function (PSD), the two-dimensional finite element model of the moment resisting frame's base motion is modified to account for random ground motion. The probabilistic study of the moment resisting frame structure using stochastic finite element utilizing Monte Carlo simulation was presented using the finite element program ABAQUS. The dynamic reliability and probability of failure of the stochastic and deterministic structure based on the first passage failure were checked and evaluated. Results revealed that the probability of failure increased due to randomness in stiffness and mass of the structure. Generally, natural frequencies for the lower modes of vibration and relative displacements for the lower stories were more sensitive to the randomness in system parameters.
reliability, Monte Carlo simulation, uncertain system, random excitation, stochastic, finite element
Earthquakes are one of the most dangerous natural hazards, both to people and their property [1]. Since that earthquake-induced ground motion is a form of random excitation, random vibration theory and methodologies should be employed in analyzing and studying the seismic response of structures [2]. Typically, the random excitation will be described in terms of its power spectral density (PSD), which is a function that characterizes the distribution of a quantity's power over a particular frequency range [3].
Classical random vibration theory focuses on the uncertainty in the response resulting from a prescribed uncertainty in the excitation, but the structural properties are assumed to be described exactly. Yet uncertainty in the definition of many real structures does exist [4]. Therefore, most engineering structures can be described as random since they possess randomness due to variability in their geometric or material parameters or randomness resulting from the assembly process and manufacturing tolerances [5].
Dynamic characteristics, i.e., the natural frequency, is one of the parameters that significantly affect the structure response. Because the natural frequency is related to structural stiffness and mass, it is possible that the structure's stiffness and mass qualities could be a source of uncertainty in the natural frequency. In this situation, probabilistic-based analyses are necessary to be utilized. Thus, considering the statistical parameters associated with the distribution of random variables should be determined.
With the increasing complexity of structures, computational methods such as finite element analysis (FEA) are becoming increasingly popular. However, the deterministic finite element can only predict the mean value of the natural frequencies of a stochastic structure. Still, they can provide no information on the variance of the natural frequencies about their mean value. Instead, the deterministic analysis would yield an approximation to the response of the ensemble member whose properties closely match that of the finite element model [6].
Analyzing the response variability of stochastic systems received a lot of attention. Consequently, a new field, " Stochastic Finite Element," was coined for stochastic mechanics. Although there have been papers on Monte Carlo solutions and reliability considerations, most of the studies done in stochastic finite elements have been on the analysis of stochastic systems under deterministic loading [7].
Because of the random nature of loading, material specifications, and implementation issues, probabilistic-based analyses are necessary to be utilized. Thus, considering the statistical parameters associated with the distribution of random variables should be determined. The reliability-based analysis is an important approach to structural analysis and design that considers uncertainty [8].
Most recently, Soltani et al. [9], discussed the random response of a single degree of freedom systems with random natural frequencies. Jun et al. [10] discussed the random response of MDOF to a random excitation. However, the authors did not deal with the random properties of the system. Gao [5] discussed the random response of truss with random properties.
In the current study, reliability analysis of a multi-story stochastic building frame structure with uncertain parameters and excitation is performed to assess the reliability and safety of this system. To achieve the goals of this study, a MDOF system subject to seismic base excitation is examined via probabilistic finite element Abaqus code by using Monte Carlo simulation and python script to generate pseudo-random values for the considered random parameters. Statistical characteristics for the natural frequencies and relative story displacements will be evaluated and discussed.
The stochastic earthquake analysis in this paper is based on the stationary assumption, in which the statistical parameters mean and variance do not vary across time. A stationary model makes them less sophisticated, simplifies computations, and gives satisfactory results [11]. Because seismic motions occur infrequently, the data available for use in random processes is limited. Hence, some difficulties are encountered when calculating statistics to represent the random process, such as ensemble averages. Because a single record is insufficient for producing general conclusions, an ergodicity assumption is applied, and only one earthquake record from the local area can be utilized. The PSD function of acceleration seismic motion is assumed to be in the form of a filtered Gaussian white noise, S0, of ground motion and the soil surface is simulated as a single degree of freedom linear system, as shown in Figure 1, then, the Kanai–Tajimi spectrum model [12] can be obtained:
$S(\omega)_{K T}=\frac{1+4 \xi_g^2\left(\omega / \omega_g\right)^2}{\left[1-\left(\omega / \omega_g\right)^2\right]^2+4 \xi_g{ }^2\left(\omega / \omega_g\right)^2} S_0$ (1)
$S(\omega)_{K T}=\left|H_{K T}(i \omega)\right|^2 S_0$ (2)
where, S(ω)KT is the PSD function of the stationary ground motion process, ξg, is the damping ratio of the soil on the site and, ωg, is the natural frequency of the site.
Figure 1. Kanai-Tajimi filtered white noise [13]
To estimate the filter parameters, Vanmarcke [14] suggests the method of the spectral moment, which is key statistical parameters of the PSD function [15]. The ith spectral moment λi is defined as:
$\lambda_i=\int_0^{\infty} \omega^i G(\omega) d \omega$ (3)
The variance of the excitation is the zero spectral moment.
$\lambda_0=\sigma_0^2=\int_0^{\infty} G(\omega) d \omega$ (4)
The central frequency, ωc, and the shape factor, δ, of the random process can be directly evaluated from the first few spectral moments:
$\omega_c=\sqrt{\lambda_2 / \lambda_0}$ (5)
$\delta=\sqrt{1-\left(\lambda_1^2 / \lambda_2 \lambda_0\right)}$ (6)
Because the central frequency and shape factor are functions of the spectral moments (λ0, λ1, and λ2), they are expressed in terms of the filter parameters, i.e., ωg, ξg and S0. Hence, it can be computed by matching the variance of acceleration, the central frequency, and the shape factor of the actual and theoretical power spectral density.
The equations of motion of a multi-degree-of-freedom structure, when it is under random ground motion vibration, is as follows [16]:
$[M]\{\ddot{y}\}+[C]\{\dot{y}\}+[K]\{y\}=-[M]\{E\} \ddot{x}_g(t)$ (7)
where, [M], [C], and [K] are the mass, damping, and stiffness matrices of the structure, respectively; {E} is an index vector of the inertial forces. It is normally assumed that the ground acceleration, $\ddot{x}_g(t)$, is a stationary Gaussian random process.
When the order of the matrices defined by Eq. (7) is high, the mode superposition is usually used. Assuming only the lowest q normalized modes are considered, and the order of the matrix [M] is n, then an n×q matrix [Φ] and the corresponding diagonal q×q eigenvalue matrix [Ω2] can be obtained from:
$[K][\Phi]+[M][\Phi]\left[\Omega^2\right]$ (8)
and
$[\Phi]^T[M][\Phi]=[I]$ (9)
where, [I] is a unit matrix.
The structural relative displacement vector {y} is decomposed into:
$\{y\}=[\Phi]\{U\}=\sum_{j=1}^q\left\{\phi_j\right\} u_j$ (10)
Thus, Eq. (7) is reduced to:
$\{\ddot{U}\}+[\bar{C}]\{\dot{U}\}+\left[\Omega^2\right]\{U\}=-\{\gamma\} \ddot{x}_g(t)$ (11)
where,
$[\bar{C}]=[\Phi]^T[C][\Phi]$ (12)
and
$\{\gamma\}=[\Phi]^T[C]\{E\}$ (13)
If [C] is an orthogonal damping matrix, then $[\overline{\bar{C}}]$ will be a diagonal matrix. Assuming the j th diagonal elements of $[\overline{\bar{C}}]$ and [Ω2] are 2 ξjωj and $\omega_j^2$, respectively; the PSD matrix of the displacement response {y} would be:
$\left[S_{y y}(\omega)\right]=\sum_{j=1}^q \sum_{k=1}^q \gamma_j \gamma_k H_j^*(\omega) H_K(\omega)\{\phi\}_j\{\phi\}_k^T S_{\ddot{x_g}}(\omega)$ (14)
where, $S_{\ddot{X_g}}(\omega)$ represents the PSD function of the ground acceleration $\ddot{X}_g(t)$, γj and {ϕj} are the jth mode participation factor and mode shape, respectively.
The jth order frequency response function Hj of the structure is:
$H_j=\frac{1}{\left(\omega_j^2-\omega^2+2 i \xi_j \omega \omega_j\right)}$ (15)
Although being high time-consuming computational method, still the Monte Carlo simulation (MCs) method considered the as one of the most powerful and accurate simulation tools to estimate the reliability and failure probability of uncertain structures numerically [17]. This method uses random sampling from random variable distributions. The “crude" or "direct" Monte Carlo simulation, in which pseudo-random sampling is the basic version, is the most fundamental form of the Monte Carlo method. In MCs, the failure probability is described as:
$\hat{p}_f=\frac{N_f}{N}$ (16)
where, N is the total number of samples and Nf is the number of samples in the failure domain.
MCs is a most general approach for the stochastic finite element method (SFEM) [18]. The deterministic FEM and the Monte Carlo simulation technique are merged in this methodology. The SFEM can express randomness in one or more of the main components of the classic FEM, such as geometry, material properties, and external forces.
The idea of level-crossings is closely related to a system's reliability. This is particularly true for first-passage failure when a system only qualifies as failing when a particular stress process or displacement, {X(t)}, reaches a threshold level b within the stated time interval [0, T]. According to Poisson process method, for deterministic structural parameter's, structural response is a stationary Gaussian process, the crossing times of the response's x(t) and limits (b) submitted to the Poisson process, and Eq. (17) and Eq. (18) can be used to estimate the dynamic probability of failure and reliability [19]:
$p_f(t) \approx 1-\exp \left\{-v_0 T \exp \left[-\frac{1}{2}\left(\frac{b}{\sigma_x}\right)^2\right]\right\}$ (17)
$R(t) \approx \exp \left\{-v_0 T \exp \left[-\frac{1}{2}\left(\frac{b}{\sigma_x}\right)^2\right]\right\}$ (18)
where, T is the duration of the stationary process, σx is a root mean square of response, and v0 is zero mean cross rate expressed as follows:
$v_0=\frac{1}{2 \pi} \sqrt{\frac{\lambda_2}{\lambda_0}}$ (19)
where, λ0, and λ2 zero, and the second spectral moment, respectively, defined as.
$\lambda_m=\int_0^{\omega_c} \omega^m G_s(\omega) d \omega \quad$ For $m=0,1,2$ (20)
When both structural parameters and the excitation are random, the system reliability may be evaluated by calculating the probability of an equivalent extreme-value event. Hence, the seismic excitation and structural response are assumed having zero mean. ye and σx are the extremes value and standard division of structural response y(t), respectively, the dimensionless parameters explain below [19].
$\eta=\frac{y_e}{\sigma_x}$ (21)
Assuming a Poisson process for the number of horizontal crossings, the estimated mean of the extreme value, taking parameter uncertainty into account, is about.
$E(\eta)=\left(\sqrt{2 \ln v_0 T}+\frac{0.5772}{\sqrt{2 \ln v_0 T}}\right)$ (22)
and variance of η is:
$\sigma^2(\eta)=\frac{\pi^2}{6} \frac{\sigma_x{ }^2}{(2 \ln v T)}$ (23)
The extreme value of the stochastic process y(t) is expressed as:
$y_e=E(\eta) \times \sigma_x$ (24)
The limit state function of the inter-story drift system is expressed as follows:
$G(\Delta)=R(\Delta)-Q(\Delta)$ (25)
where, R(∆) is the structure drift limit equal to 0.01 from story height, and Q(∆) represents the extreme value of structural drift due to the loading including the uncertainties of the structural parameters. Effective seismic weight and design earthquake ground motion characteristics are the factors related to the amount of structural drift caused by load. Limit state function G(∆)≤0 is the failure state. G(∆)>0 is a safe state. The target reliability of the steel structure system is shown in Table 1.
Table 1. Target reliability indices [20]
|
Type of Component |
Loading Condition |
||
|
D+(L or S) |
D+L+W |
D+L+E |
|
|
Members |
3.0 |
2.5 |
1.75 |
|
Connections |
4.5 |
4.5 |
4.5 |
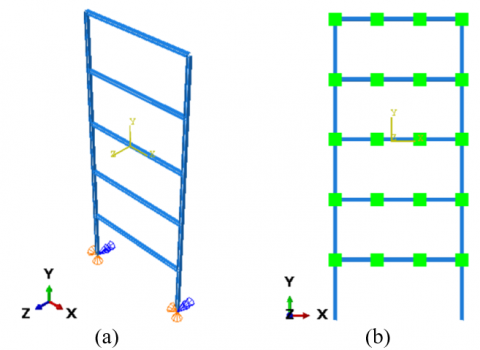
In the following a numerical example is presented and analyzed to demonstrate dynamic reliability analysis for a case study of five-story MDOF frame structure, shown in Figure 2, when stochastic response due to uncertainty in both structure physical properties and seismic excitation force are taken into account.
Figure 2. 3D view of multi-story moment resisting frame
6.1 Proposed structural system
Uncertainty and reliability analysis has been executed for an interior frame of the multi story building system, shown in Figure 2. The frame system consists of one bay with 9m width in the short direction and four bays with 6m width in the long direction. The frame system as shown in Figure 3 is made up of a concrete slab of 150mm thick supported by four steel floor beams with a cross-section of S10 ×25.4 that is supported by girders with a cross-section of W10×100 and this girder is placed on a column with a cross-section of W10×88.
The structural steel material is Grade A36, characterized by yield stress of 250 MPa and elastic modulus of 200000 MPa. The proposed sections for different members have been preliminarily selected and checked relying on the static load analysis based on design requirements characteristics of the deterministic ents for AISC 360. Uniformly distributed load of 2.0 kPa and 2.4 kPa have been adopted for the superimposed and live loads respectively for repeated floors and 3.5 kPa and 1 kPa have been adopted for the superimposed and live load, respectively, for roof floor according to the American Society of Civil Engineers (ASCE Standard).
Based on the traditional one-way floor analysis, these loads are transformed into line loads supported by the floor beams. The line load represents uniform pressure from the tributary area assigned to the floor beams due to floor self-weight, imposed and live loads. The reactions from the floor beams are applied as point loads on the supporting girders.
Figure 3. Interior frame of the MDOF moment resisting frame
6.2 Random ground excitation
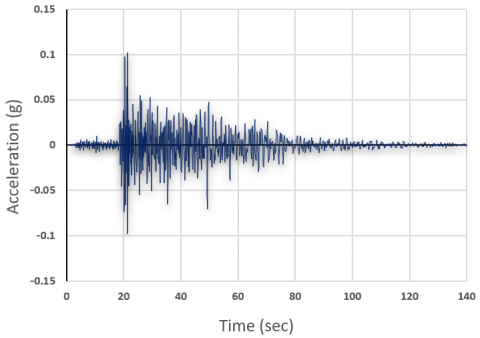
The 2012 North-South component of Ali Gharbi earthquake, shown in Figure 4, in Iraq [21] is chosen as the excitation ground motion.
Figure 4. North-South component of Ali Gharbi ground motion
The SeisomSignal software has been used to estimate the Fourier Amplitude and power spectral density. Figure 5 shows how the amplitude of the ground motion is distributed with respect to frequency.
Using the spectral moment method, Acceleration spectral density function parameters of filtered white noise ground motion have been estimated, shown in Figure 5. The calculated values of natural frequency and damping ratio for the filter were ωg=12.25 rad/s, ξg=0.32, respectively. The intensity factor of an earthquake was S0=0.00472 (m2/s3).
Figure 5. Actual and theoretical PSD Function for the 2012 N-S component of Ali Gharbi earthquake
6.3 Stochastic earthquake analysis with deterministic structural parameters
The dynamic characteristics of the deterministic MDOF portal frame structures have been analyzed using ABAQUS finite element software. The two dimensions portal frame has been modeled using wire part B21, as shown in Figure 6 (a). To simulate boundary conditions for the 2D frame, all translational and rotational degrees-of-free-dome at the supports were restrained. Point inertia mass has been used in the location of the floor beam to describe the load transmitted from the concrete floor slab, superimposed and live load, as shown in Figure 6 (b). Total self-weight and superimposed have been assigned, and also a quarter of live load has been included according to (ASCE 7, 2010). A Mesh size of 100mm has been assigned to discretize the structure.
Figure 6. Structural modeling in ABAQUS finite element software
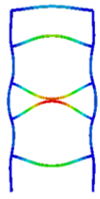
The structure's natural frequency and mode shapes was obtained by modal analysis, and five values were extracted as illustrated in Figure 7 and Table 2.
(a) mode shape 1:0.476 Hz mode shape 2: 1.554 Hz
(b) mode shape 3: 2.931 Hz mode shape 4: 3.145 Hz
(c) mode shape 5: 3.705 Hz
Figure 7. Mode shapes and natural frequency of the system
Table 2. Natural frequencies and mass participation of moment resisting frame
|
Mode no. |
Frequency (Hz) |
Frequency (rad/sec) |
Mass participation in X-direction % |
Mass participation in Y-direction % |
|
1 |
0.476 |
2.99 |
81.5 |
- |
|
2 |
1.554 |
9.76 |
92.4 |
- |
|
3 |
2.931 |
18.41 |
96.82 |
- |
|
4 |
3.145 |
19.76 |
- |
13.5 |
|
5 |
3.705 |
23.27 |
- |
14.8 |
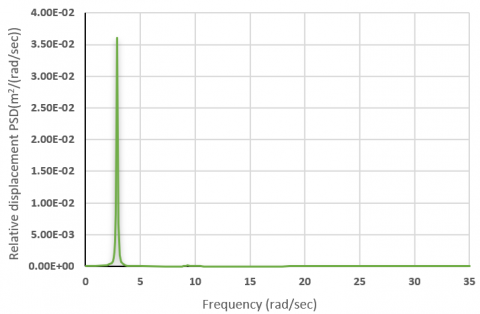
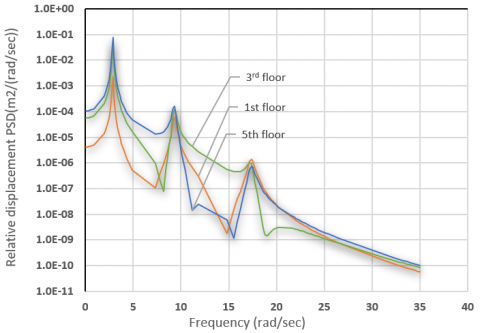
Performing random vibration analysis with a base motion of the portal frame in the X-direction. The frequency of interest range response has been set. Hence, the power spectrum density of relative displacement was obtained, as shown in Figure 8 through Figure 10. The PSD of Relative displacement of these floors shows that the first two modes are prominent while the first mode is dominating, but in fact, the log scale in Figure 11 shows that the contribution of the first three modes in the system response. The mean square, MS, and root mean square, RMS, of relative displacement for each floor have been illustrated in Table 3.
Table 3. Mean square and root mean square of relative displacement
|
Story no. |
Mean square (m2) |
RMS (m) |
|
1 |
6.4469×10⁻⁵ |
0.00803 |
|
2 |
0.0004245 |
0.0206034 |
|
3 |
0.00102723 |
0.0320472 |
|
4 |
0.00167482 |
0.040922 |
|
5 |
0.00217578 |
0.046645 |
Figure 8. Relative displacement PSD of 1st floor
Figure 9. Relative displacement PSD of 3rd floor
Figure 10. Relative displacement PSD of 5th floor
Figure 11. Relative displacment power spectral density for different floor in logscele
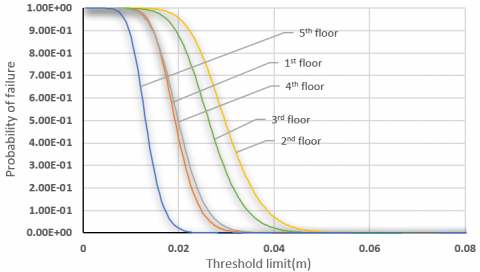
The probability of failure of the system has been estimated for three response intervals of 10, 15, and 20 seconds as shown in Figure 12 through Figure 14. Based on this estimate, the reliability index was obtained, as illustrated in Table 4. The results showed that the probability of failure slightly increased when response time increased. Therefore, the reliability index of the system wasn't significantly affected. Although that the response time has slightly affected the structure reliability but the second floor with increasing time response moved out from the safe domine to failure when compared with the target reliability index shown in Table 1.
Table 4. Probability of failure and reliability index for 0.01 H drift limit
|
Story no. |
10 sec |
15 sec |
20 sec |
|||
|
pf |
β |
pf |
β |
pf |
β |
|
|
1st story |
2.51×10⁻⁵ |
4.05 |
3.76×10⁻⁵ |
3.95 |
5.02×10⁻⁵ |
3.88 |
|
2nd story |
3.61×10⁻² |
1.79 |
5.37×10⁻² |
1.61 |
7.09×10⁻² |
1.46 |
|
3rd story |
1.07×10⁻² |
2.3 |
1.60×10⁻² |
2.14 |
2.13×10⁻² |
2.02 |
|
4th story |
1.33×10⁻⁴ |
3.64 |
2.00×10⁻⁴ |
3.54 |
2.67×10⁻⁴ |
3.46 |
|
5th story |
1.17×10¹⁰ |
6.33 |
1.75×10⁻¹⁰ |
6.27 |
2.34×10⁻¹⁰ |
6.22 |
Figure 12. Probability of failure of each floor with time 10 sec
Figure 13. Probability of failure of each floor with time 15 sec
Figure 14. Probability of failure of each floor with time 20 sec
6.4 Stochastic earthquake analysis with non-deterministic structural parameters
To illustrate the effect of the randomness of structure parameters including stiffness k, and mass m, on the natural frequency and random seismic response, MCS was performed to update the random variables of interest for each FEA trial. Python programming has been used to develop the deterministic FE model, and then the random input variables of interest are updated based on the idea of parameter updating functionality. In this study, members cross-section dimensions, modulus of elasticity, column length, and the applied load are considered random variables, and these parameters' statistical characteristics are summarized in Table 5.
Table 5. Statistical properties of member parameters
|
Random variables |
Mean/Nominal |
COV |
Distribution type |
|
|
Cross section dimension |
Depth of the web |
1.0009 |
0.004 |
Normal |
|
Width of the flange |
1.0139 |
0.009 |
Normal |
|
|
Thickness of the flange |
0.9927 |
0.044 |
Normal |
|
|
Thickness of the web |
1.054 |
0.037 |
Normal |
|
|
Modulus of elasticity |
0.993 |
0.034 |
Normal |
|
|
Column length |
1 |
0.07 |
Lognormal |
|
|
Load |
Weight of a girder |
1.03 |
0.1 |
Normal |
|
Weight of a slab |
1.05 |
0.1 |
Normal |
|
|
Superimposed load |
1.03 |
0.1 |
Normal |
|
|
Live load |
1 |
0.1 |
Gumbel |
|
Probabilistic modal analyses of random structural parameters of the interior MDOF portal frame have been estimated using SFEM with python script coding. MATLAB function has been used to generate 1,000 pseudo-random samples of cross-section dimensions, modulus of elasticity, column length, and structural effective mass. The result of natural frequency obtained from sample data has been presented in Table 6. The mean value, standard deviation, and coefficient of variation of the five natural frequencies have been estimated.
Table 6. Computational results for the natural frequency
|
Mode no. |
Mean value (rad/sec) |
Variance (rad/sec)2 |
Standard division (rad/sec) |
COV |
|
1 |
2.9248 |
0.0250 |
0.1582 |
0.054 |
|
2 |
9.5515 |
0.2993 |
0.5471 |
0.0573 |
|
3 |
18.0301 |
1.2639 |
1.1242 |
0.0624 |
|
4 |
19.4780 |
0.6836 |
0.8268 |
0.0424 |
|
5 |
22.9431 |
0.8915 |
0.9442 |
0.0412 |
Results presented revealed that mean values for the natural frequencies were in close agreement to that shown Table 2 for the deterministic analysis indicating the validity of the stochastic analysis with random variables. The result shows that the horizontal translation modes were affected higher than the local modes, and it's more sensitive to the uncertainties of structural parameters. Due to the randomness in natural frequency, the system response was affected. The RMS of relative displacement has been presented in Table 7.
Table 7. Computational results for the RMS of relative displacement
|
Story no. |
Mean value (m2) |
RMS (m) |
Standard division (m) |
COV |
|
1 |
0.0082 |
1.8795×10⁻⁶ |
0.0014 |
0.1663 |
|
2 |
0.0211 |
5.3556×10⁻⁶ |
0.0023 |
0.1099 |
|
3 |
0.0328 |
8.8507×10⁻⁶ |
0.0030 |
0.0907 |
|
4 |
0.0418 |
1.1098×10⁻⁶ |
0.0033 |
0.0796 |
|
5 |
0.0477 |
1.2539×10⁻⁶ |
0.0035 |
0.0742 |
In relative displacement, the result for COV shows that the lower story has been more affected than the upper stories due to the uncertainty in the system parameters. The failure probability estimates for the threshold level of 1% are shown in Figure 13 through Figure 17 and summarized in Table 6.
Figure 15. The overall probability of failure for a 10-sec response
Figure 16. The overall probability of failure for a 15-sec response
Figure 17. The overall probability of failure for a 20-sec response
Results presented revealed that randomness in the system's stiffness and mass influences the system's reliability and, generally, the probability of failure increased due to randomness in the stiffness and mass of the structure. This conclusion is confirmed by comparing results presented in Tables 7 and 8 for deterministic and stochastic systems, respectively.
Table 8. Probability of failure and reliability index for stochastic system
|
Story no. |
10 sec |
15 sec |
20 sec |
|||
|
pf≈0 |
β |
pf |
β |
pf |
β |
|
|
1st story |
≈0 |
- |
≈0 |
- |
≈0 |
- |
|
2nd story |
6.60×10⁻² |
1.50 |
7.6×10⁻² |
1.43 |
1.01×10⁻² |
1.27 |
|
3rd story |
1.20×10⁻² |
2.25 |
1.6×10⁻² |
2.14 |
2.20×10⁻² |
2.01 |
|
4th story |
≈0 |
- |
≈0 |
- |
≈0 |
- |
|
5th story |
≈0 |
- |
≈0 |
- |
≈0 |
- |
This paper has performed a reliability analysis for the multi-story moment resisting frame excited by random ground motion with deterministic and stochastic structural parameters. The current study revealed the following conclusions:
·The probability of failure and the reliability index of the deterministic structure affected slightly due to the excitation time interval. Generally, the probability of failure increased and the reliability index decreased with increasing time interval.
·The horizontal translation modes were affected higher than the local modes with randomness in parameters, and it's more sensitive to the uncertainty of structural parameters.
·The lower stories relative displacement has been more affected than the upper stories due to the uncertainty in the system parameters.
·Results for the stochastic MDOF structure indicated that the response of the intermediate floors were increasingly shifted out of the safe domain to failure with increasing excitation time.
·Randomness in the system's stiffness and mass influences the system's reliability and probability of failure. Generally, the probability of failure increased due to randomness in stiffness and mass of the structure.
Acknowledgment is devoted to the Civil Engineering Department at the University of Baghdad for their helpful support throughout this research.
[1] Sun, Y.G., Teng, Y.Y., Chen, C., Qiang, H.Y. (2015). Dynamics response and study of the shore container cranes in an earthquake. Mathematical Modelling of Engineering Problems, 2(4): 13-16. https://doi.org/10.18280/mmep.020403
[2] Dai, J., Gao, W., Zhang, N., Liu, N. (2010). Seismic random vibration analysis of shear beams with random structural parameters. Journal of Mechanical Science and Technology, 24(2): 497-504. https://doi.org/10.1007/s12206-009-1210-x
[3] Machado, M.R., Khalij, L., Fabro, A.T. (2019). Dynamic analysis of a composite structure under random excitation based on the spectral element method. International Journal of Nonlinear Sciences and Numerical Simulation, 20(2): 179-190. https://doi.org/10.1515/ijnsns-2018-0050
[4] Liang, Z., Lee, G.C. (2015). Random Vibration: Mechanical, Structural, and Earthquake Engineering Applications. https://doi.org/10.1201/b18374
[5] Gao, W. (2007). Random seismic response analysis of truss structures with uncertain parameters. Engineering Structures, 29(7): 1487-1498. https://doi.org/10.1016/j.engstruct.2006.08.0
[6] Loughlan, J. (2018). Thin-Walled Structures: Advances in Research, Design and Manufacturing Technology. https://doi.org/10.1201/9781351077309
[7] Arregui-Mena, J.D., Margetts, L., Mummery, P.M. (2014). Practical application of the stochastic finite element method. Archives of Computational Methods in Engineering, 23(1): 171-190. https://doi.org/10.1007/s11831-014-9139-3
[8] Soltani, M., Ghasemi, S. (2020). Structural drift corresponding to the critical excitations. Journal of Structural Engineering and Geo-Techniques, 10(2): 27-34.
[9] Soltani, M.H., Ghasemi, S.H., Soltani, A., Lee, J.Y., Nowak, A.S., Jalilikhani, M. (2020). State-of-the-art reliability analysis of structural drift control corresponding to the critical excitations. Journal of Earthquake Engineering, 1-17. http://dx.doi.org/10.1080/13632469.2020.1798829
[10] Jun, L., Dafu, X., Bingyan, J. (2014). Random structural dynamic response analysis under random excitation. Periodica Polytechnica Civil Engineering, 58(3): 293-299. https://doi.org/10.3311/ppci.7523
[11] Hacıefendioğlu, K., Başağa, H.B., Banerjee, S. (2017). Probabilistic analysis of historic masonry bridges to random ground motion by Monte Carlo simulation using response surface method. Construction and Building Materials, 134: 199-209. https://doi.org/10.1016/j.conbuildmat.2016.12.101
[12] Ge, X.G., Li, C.D., Azim, I., Gong, G.H., Li, Y.X. (2021). Structural dynamic responses of linear structures subjected to Kanai-Tajimi excitation. Structures. 34: 3958-3967. https://doi.org/10.1016/j.istruc.2021.08.092
[13] Liu, S.C. (1968). Statistical analysis and stochastic simulation of ground-motion data. Bell System Technical Journal, 47(10): 2273-2298. https://doi.org/10.1002/j.1538-7305.1968.tb01086.x
[14] Vanmarcke, E.H. (1976). Structural response to earthquakes. Seismic Risk and Engineering Decisions, 287-337. https://doi.org/10.1016/b978-0-444-41494-6.50011-4
[15] Di Maio, R., Galluzzo, D., Nardone, L., Rocca, M., Esposito, A., Manzo, R. (2020). Statistical moments of power spectrum: A fast tool for the classification of seismic events recorded on volcanoes. Advances in Geosciences, 52: 67-74. https://doi.org/10.5194/adgeo-52-67-2020
[16] Li, Q., Zhang, Y.H., Wu, J.R., Lin, J.H. (2004). Seismic random vibration analysis of tall buildings. Engineering Structures, 26(12): 1767-1778. https://doi.org/10.1016/j.engstruct.2004.06.013
[17] Tran, N., Nguyen, T. (2020). Reliability assessment of steel plane frame's buckling strength considering semi-rigid connections. Engineering, Technology & Applied Science Research, 10(1): 5099-5103. https://doi.org/10.48084/etasr.3231
[18] Hang, D.T., Nguyen, X.T., Tien, D.N. (2022). Stochastic buckling analysis of non-uniform columns using stochastic finite elements with discretization random field by the point method. Engineering, Technology & Applied Science Research, 12(2): 8458-8462. https://doi.org/10.48084/etasr.4819
[19] Zhang, S.R., Liu, F.L., Xiao, J.Q., Hu, Y.C., Deng, H.R. (2020). Dynamic reliability sensitivity analysis for inter-story isolation structure under stochastic excitations. Journal of Vibroengineering. 22(4): 880-895. https://doi.org/10.21595/jve.2020.21127
[20] William, S. (2013). Steel Design Fifth Edition. Cengage Learning.
[21] Iraqi Seismic Network at the Iraqi Meteorological Organization and seismology (IMOS). http://meteoseism.gov.iq/.