Mohammed Gollapalli* | Aljawharah Alfaleh
© 2022 IIETA. This article is published by IIETA and is licensed under the CC BY 4.0 license (http://creativecommons.org/licenses/by/4.0/).
OPEN ACCESS
Sickle cell disease (SCD) is a genetic illness that affects red blood cells and can lead to major complications like Acute Chest Syndrome (ACS), Cerebrovascular Accident (CVA), and even death from a stroke. SCD is frequent in some places of the world, especially where consanguineous marriages are common, such as in Saudi Arabia. This research presents artificial intelligence (AI) models that were tested on hospital clinical data collected between 2008 to 2020 using five different classifiers: Naive Bayes, Neural Networks (NN), Support Vector Machine (SVM), J48, and PART. To select the optimum classification approach, we analyzed the models based on the accuracy kappa statistics and the classification time. We also compared performance criteria such as sensitivity, specificity, accuracy, F1 measure, and AUC. The naive Bayes classifier outperformed the other classifiers with 92.22% accuracy in our investigation, which was then utilized to determine key elements that are common between SCD patients’ inheritance and demographic data. The findings of this study through AI are aimed to assist hospital doctors and practitioners understand the correlation between disease inheritance and other factors, allowing them to better manage the disease by increasing disease awareness in the community, particularly among mothers. In terms of accuracy, all classifiers obtained above 92%. J48, NN and SVM exhibited 92.99% accuracy, then PART exhibits accuracy as 92.92% followed by Naïve Bayes at 92.22%. In terms of classification time, Naïve Bayes was fastest (0.01 sec), then J48 (0.03 sec), then PART (0.24 sec) and SVM (0.28 sec) while NN was slowest at 22.43 sec.
sickle cell disease, data modelling, computational statistics, machine learning, artificial intelligence
Sickle cell disease (SCD) is a rare heredity blood disorder disease which was recognized in 1963 specifically in the eastern region of Saudi Arabia. Most SCD patients live in the eastern province where, of every 10,000 people, 145 are SCD patients. The south-eastern province has a smaller number of patients: of every 10,000, 24 are SCD patients. Sickle cell trait (SCT) carriers have been observed in Saudi Arabia: approximately 2% to 27% of the Saudi population [1] across different regions. Among children aged 5 to 14 years, SCD has the worst results with highest number of patients, followed by children and infants under 5 years of age [2]. Consanguineous marriage (marriage between closely related relatives) among 57.7% of the population was a key reason for these statistics, and this percentage could easily be increased to over 80% in countries such as Saudi Arabia [3]. Furthermore, when two parent have SCT, they have a 25% chance of transmitting their child with the disease; the percentage is even higher (50%) when one parent has SCT and the other has SCD. Saudi Arabia has a significant challenge controlling the disease because the community is not sufficiently educated on the consequences of consanguineous marriages. Although the government implemented programs to educate people and decrease the risks of SCD patients from marriage contracts using medical tests in a premarital screening program, the results indicated couples continued to practice with marriage procedures and local traditions.
The existing techniques in the literature have been investigated in these regards and different approaches have been put into trial especially the statistical analysis [1]. Each approach has its own pros and cons. The current study is novel and unique in the following way.
(1) Nature of dataset: the dataset is novel and no one else has investigated it in the past. It is based on realistic data from KFU Hospital spanned over 12 years clinical records. Moreover, the dataset is versatile and contains several features that none of the existing studies focused.
(2) Earlier studies investigated limited number of algorithms, usually one or two also lacking AI based approaches. While the undergoing study investigated several AI based classifiers over the unique dataset to appropriately analyze the feature set.
(3) The study is focused on Saudi Arabia’s eastern region (Dammam).
This research aims to employ artificial intelligence (AI) modeling techniques through data mining to understand the prevalence of SCD, determine the inheritance information among SCD patients, and study the hospital admissions and discharge causes for SCD. Experiments were conducted on five most frequently used classifiers on SCD, namely naïve Bayes, J48, SVM, neural network (NN), and PART, on SCD patient’s clinical data and relevant knowledge was extracted. These five models were carefully chosen based on review of the literature work [4] conducted as part of ongoing research.
2.1 Clinical data
The study involves 12 years of clinical data of SCD patients who visited and were treated at the King Fahad University Hospital, located in Saudi Arabia, from January 2008 to April 2020. Patients’ sensitive data (such as mobile numbers and national IDs) was excluded, while clinical, laboratory, and pharmacy data was included in this study. Patients included Saudi and non-Saudi nationals of various ages living primarily in the country's eastern regions. The clinical dataset contained 1428 SCD patients, 100 of whom had undoubtedly inherited this rate disease from their mothers. We primarily aimed to understand these patients through their clinical records to investigate the common factors between their inheritance probability and demographic data [5], as shown in Table 1.
Table 1. SCD variables for constructing prediction models
|
Variable |
Description |
|
Patient Family Succession |
|
|
Sex |
A male/female indicator of patient |
|
Age |
Age of the patient when diagnosed |
|
Marital status |
Married/Single or unknown |
|
Nationality |
Country of origin |
|
Residence |
Patient address |
|
Visits count |
How many times patient visited the hospital |
|
Year of last visit |
Date of the last patient visit to the hospital |
|
Patient family inheritance |
Patient inherited the disease from the mother (yes/no) |
|
Patient Treatment |
|
|
SCD type |
Three categories of sickle cell disease |
|
Service |
The department from which the patient received the service (e.g., pediatric/internal medicine or obstetrics) |
|
Patient’s profile characteristic |
An adult/pediatric patient |
|
Stay time |
Time patient spent in the hospital (in days) |
|
Blood transfer type |
Blood type the patient received |
|
Disease Complications |
|
|
Complication information |
Any symptoms or other medical issues patients had when admitted. |
|
Stay time |
Time patient spent in the hospital (in weeks) |
|
Race |
Ethnicity of the patient |
|
Admission |
An adult/pediatric patient |
|
Admission type |
From emergency/non-emergency |
|
Admission year |
Year of patient’s admission |
|
Hospital discharge summary |
Reason for the discharging routine (Normal discharge/against medical advice/to other hospital/expired or dead/absconded from hospital) |
|
Discharge year |
Year of patient’s discharge |
2.2 Ethical considerations
Through the official ethical review process, the IRBs of all the participating institutions have given their approval to this study. This study did not necessitate any changes in the patient’s clinical treatment. All information was handled with care to protect the anonymity and confidentiality of the patients.
This section comprehensively details the retrospective study conducted as a first step on each of the target questions for SCD patient data through descriptive statistics [6]. The study aimed to understand the determinant factors associated with SCD patients who are getting admitted and being treated at different departments of the hospital.
3.1 Patient epidemiology
While SCD is a rare blood disorder worldwide, incidence of this disease in Saudi Arabia continues to increase mainly because consanguineous marriages are still practiced, resulting in children inheriting the disease and ultimately suffering [7]. In the eastern region of the country, disease statistics are particularly high despite government efforts to reduce disease prevalence over the past decade [8]. Children could inherent SCD from their mother or father and have a 50% risk of inheriting the disorder if one of their parents has a sickle cell gene. As there are little or no signs, sickle cell trait (SCT) may not be discovered early; hence, patients even with 50% transfer SCD to their child if both parents have a sickle cell trait [9]. In this study, we discovered 100 unique patients (children) who inherited illness from their parents (mother).
Figure 1 indicates the ages of those patients who were admitted and got treated in the hospital along with the historical SCD records of their mothers. As can be seen, patients (children) with inheritance details available were between the ages of 1 and 25 years; majority of these children were between 10 and 20 years of age. Newborns had the least patient inheritance track record information.
Figure 1. SCD inheritance by infants and children
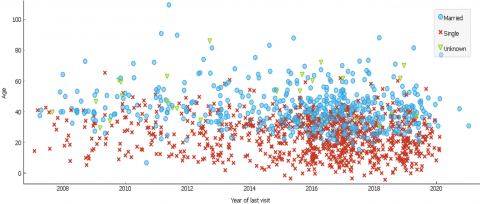
3.2 Hospital visits
The analysis on hospital visits was performed on SCD patients who visited between Jan 2008 and Apr 2020. As can be seen from Figure 2, the number of hospital visits clearly sparked on SCD cases over the past decade. The most patients under the age of 25 with SCD were singles, while married patients were mainly over the ages of 20. For patients between 20 and 40 years of age, more appointments were frequently made.
Table 2. Population visits statistics and marital status
|
Aggregate |
Low |
Moderate |
Over Mod. |
High |
Very High |
|
Married |
|||||
|
Count |
330 (38.02%) |
86 (40.38%) |
113 (35.99%) |
9 (36.00%) |
3 (37.50%) |
|
Mean |
40 |
42.8 |
45.1 |
47.7 |
53.7 |
|
Min |
34 |
11 |
23 |
34 |
45 |
|
Max |
64 |
86 |
88 |
64 |
63 |
|
Var |
94.9 |
158.7 |
160.7 |
94.9 |
54.2 |
|
Singles |
|||||
|
Count |
15 (1.73%) |
122 (57.28%) |
197 (62.74%) |
15 (60.00%) |
5 (62.50%) |
|
Mean |
33.1 |
23.1 |
25.5 |
33.1 |
30.2 |
|
Min |
20 |
7 |
8 |
20 |
24 |
|
Max |
43 |
63 |
58 |
43 |
34 |
|
Var |
38.4 |
113.9 |
76 |
38.4 |
14.6 |
|
Not specified |
|||||
|
Count |
1 (0.12%) |
5 (2.35%) |
4 (1.27%) |
1 (4.00%) |
0 (0.00%) |
|
Mean |
57 |
48.2 |
56 |
57 |
- |
|
Min |
57 |
32 |
36 |
57 |
- |
|
Max |
57 |
83 |
70 |
57 |
- |
|
Var |
0 |
378.2 |
153.5 |
0 |
- |
|
Summary |
|||||
|
Count |
868 |
213 |
314 |
25 |
8 |
|
Mean |
29.6 |
31.6 |
32.9 |
39.3 |
39 |
|
Min |
2 |
7 |
8 |
20 |
24 |
|
Max |
101 |
86 |
88 |
64 |
63 |
|
Var |
216.8 |
236.1 |
201.7 |
117.7 |
158.5 |
Table 2 provides frequency statistics of hospital visits made by SCD patients, along with their ages and marital status (married, single, not specified). We discretized the number of hospital visits within the last 12 years into five categories based on visits (low: visits below 50; moderate: visits between 50 and 100; over moderate: visits between 100 and 500; high: visits between 500 and 1000; and very high: visits over 1000). The low visits group had 868 patients (of 1428) with different marital status.
The number of married low visit patients were 330 (38.02%) and 15 (1.73%) for single patients. In exceptional conditions, three married patients and five single patients visited the hospital more than 1000 times. Overall, among all genders, mean ages of married patients who visited the hospital was 41 and, patients who are singles was 23 years.
Figure 2. SCD hospital visits by different marital status
3.3 Gender demographics
Table 3. Gender and inheritance statistics of SCD patients
|
|
Gender |
Inherited |
||
|
City |
Females |
Males |
Yes |
No |
|
Abha |
1 (0.13%) |
1 (0.15%) |
2 (0.15%) |
- |
|
Abqaiq |
1 (0.13%) |
1 (0.15%) |
2 (0.15%) |
- |
|
Al Ahsa |
54 (7.11%) |
66 (9.87%) |
118 (8.89%) |
2 (2.00%) |
|
Al Khobar |
396 (52.17%) |
388 (58.00%) |
709 (53.39%) |
75 (75.00%) |
|
Al Qatif |
164 (21.61%) |
105 (15.70%) |
261 (19.65%) |
8 (8.00%) |
|
Arar |
1 (0.13%) |
0 (0.00%) |
1 (0.08%) |
0 (0.00%) |
|
Bahrain |
1 (0.13%) |
0 (0.00%) |
1 (0.08%) |
0 (0.00%) |
|
Dammam |
81(10.67%) |
61 (9.12%) |
134 (10.09%) |
8 (8.00%) |
|
Dhahran |
40 (5.27%) |
24 (3.59%) |
58 (4.37%) |
6 (6.00%) |
|
Jeddah |
1 (0.13%) |
1 (0.15%) |
2 (0.15%) |
- |
|
Jubail |
2 (0.26%) |
4 (0.60%) |
6 (0.45%) |
- |
|
Khafji |
0 (0.00%) |
1 (0.15%) |
1 (0.08%) |
- |
|
Khames Moshait |
0 (0.00%) |
1 (0.15%) |
1 (0.08%) |
- |
|
Kharkhir |
0 (0.00%) |
1 (0.15%) |
1 (0.08%) |
- |
|
Kuwait |
1 (0.13%) |
1 (0.15%) |
2 (0.15%) |
- |
|
Makkah |
1 (0.13%) |
0 (0.00%) |
1 (0.08%) |
- |
|
Najran |
0 (0.00%) |
2 (0.30%) |
2 (0.15%) |
- |
|
Rahima |
3 (0.40%) |
0 (0.00%) |
3 (0.23%) |
- |
|
Ras Tanura |
2 (0.26%) |
0 (0.00%) |
2 (0.15%) |
- |
|
Riyadh |
5 (0.66%) |
11 (1.64%) |
15 (1.13%) |
1 (1.00%) |
|
Sharora |
1 (0.13%) |
0 (0.00%) |
1 (0.08%) |
- |
|
Tarot |
3 (0.40%) |
0 (0.00%) |
3 (0.23%) |
- |
|
Unknown |
1 (0.13%) |
1 (0.15%) |
2 (0.15%) |
- |
|
Total |
759 |
669 |
1328 |
100 |
Table 3 displays the residential cities of all the patients, along with gender and inheritance statistics, who live throughout Saudi Arabia. The results indicate that there were 58% female patients with SCD (759) than 52.17% male patients (669) who visited the hospital living mostly in and around Al Khobar city. Furthermore, 21.61% were females from Al Qatif town while 15.70% were SCD males. In addition, cities in the eastern regions of the country had more SCD patients. For instance, 10.67% female patients and 9.12% male patients were from Dammam city. Al Ahsa also has lower female patients (7.11%), while Dhahran and Jubail had lower male patients. In addition, 16% of patients came from other regions, such as the city of Riyadh, the capital city.
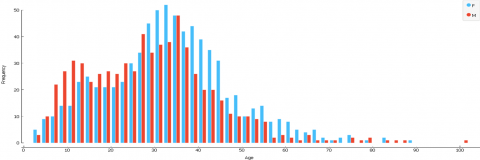
Table 3 presents the inheritance statistics. The number of patients who inherited the disease were 100 (7%) among 1428 patients. Among these patients, 75% lived in Al Khobar city, and other SCD patients lived in other eastern region cities: Al Qatif (8%), Dammam (8%), Dhahran (6%), and Al Ahsa (2%). We determined the relationship between genders and patient ages as shown in Figure 3 and found that female patients were greater than male patients over 30 years old. Almost 50% of both female and male patients were between the ages of 30 and 40. Less than 5% of patients were over 60 years old.
Figure 3. SCD patients gender (male/female) statistics
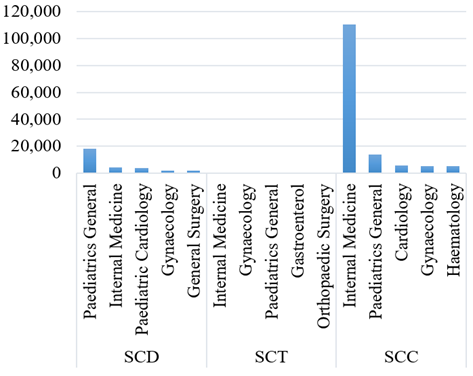
Figure 4. Top 5 services (visits) by each SCD type
3.4 Treatment types
SCD patients received various clinical services from different hospital departments. The services received by patients based on various forms of SCD are shown in Figure 4. As can be seen, with a combined (SCD, SCT, and SCC), the most visited department in the hospital found to be Internal Medicine for Adults, followed by combined visits at the Department of Pediatrics for children [10]. For SCC patients, the top 5 services received in the descending order are the Internal medication (110,570), followed by pediatrics (13,986), cardiology (5530), gynecology (5377), and hematology (5317). For SCD patients, pediatrics (17,933) was the highest, followed by internal medication (4401), pediatrics (3861), gynecology (1909), and general surgery (1632). For SCT patients, though minimal visits, internal medication (513) was still the highest, then gynecology (265), pediatrics (157), gastroenterology (59), and orthopedic surgery (53).
This section thoroughly describes our experimental research on various artificial intelligence (AI) data modeling approaches used as the second stage (after the retrospective study) on the target questions to understand patient’s family inheritance through machine learning. The study used Weka data mining software [11] to classify and correlate between distinct attributes on each of the target classes. Based on patient variables such as gender, marital status, hospital visits, SCD inheritance among parents and their offspring, reasons for hospital admissions and discharges of SCD patients, and knowledge patterns were retrieved to predict SCD.
4.1 Data classification
A critical step of supervised learning is selecting the right classifier for the given training dataset [11, 12]. In this study, we compared various classification algorithms to test the accuracy with ten-fold cross-validation results. Using the literature review conducted in Ref. [4], we identified the classification algorithms most frequently used for SCD data mining and machine learning. Based on this identification, we compared the five most-applied classifiers: Naive Bayes, J48, SVM, NN, and PART algorithms to predict patients’ inheritance [13]. In addition, parameter optimization was performed to determine the best classification results of each algorithm [14]. The most optimum metrics were used to compare the selected five classifications, including the percentage of correctly categorized instances, kappa statistics, and classification time in seconds. The percentage of instances correctly classified are the accuracy of the classification results, indicating how correctly the variables were predicted [15].
Kappa statistic tests were conducted to predict the agreement percentages with the true classes, where 1 implies full agreement and 0 implies no agreement. The time of each classifier was also measured to complete the classification process in Weka data mining software on the identical hardware and software platforms. The bar graph of properly classified instances, wrongly classified instances, and accuracy (percentages) illustrating the variations between the classifiers was also analyzed. To obtain a more detailed analysis of the classified results, the confusion matrix was also employed on each of the target classes. The classifier confusion matrix was used to compare the true positive and true negative values. In addition, we did not rely just on the accuracy values in the comparison in our analytics, as that could often create to misleading results. Performance metric results were employed to demonstrate the sensitivity, also known as recall, to assess the proportion of the true positive values over the total number of positive instances, as well as specificity, also known as the negative ratio, to measure all the correctly predicted negative values which were calculated as follows [16].
Sensitivity=TP/(TP+FN) (1)
Specificity=TN/(TN+FP) (2)
Performance metric used in this study was employed to measure the classifiers accuracy and F1 scores. These accuracy metrics were used to show the expected measure of instances as positive, while the weighted average accuracy and recall were compared using the F1 score as follows:
Precision=TP/(TP+FP) (3)
F1 score=2*(Precision*Recall)/(Precision+Recall) (4)
The last two metrics used in the comparison of classifier algorithms were the precision and AUC. The AUC was calculated based on the true positive and false positive rates. We determined the accuracies of the confusion matrix in Weka data mining software based on the following measurements:
Accuracy=(TP+TN)/(TP+FN+TN+FP) (5)
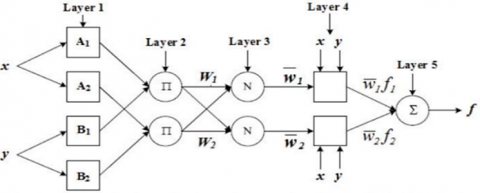
5.1 Neural networks
Classification was performed with default values for all NN parameters except the “hidden layer” [17]. Each time the experiment was done but with different types and numbers of hidden layer to find the best combination classified number of instances. Figure 5 shows a generic NN architecture for binary classification with five layers, including input, hidden and output layers.
Figure 5. Generic NN model for binary classification
Figure 6. Accuracies for different hidden layer values
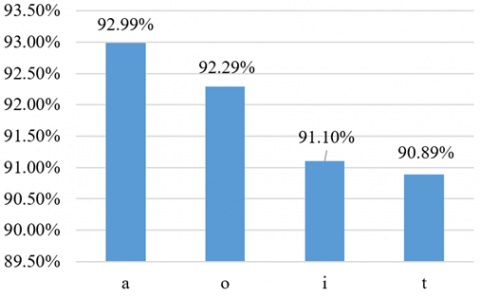
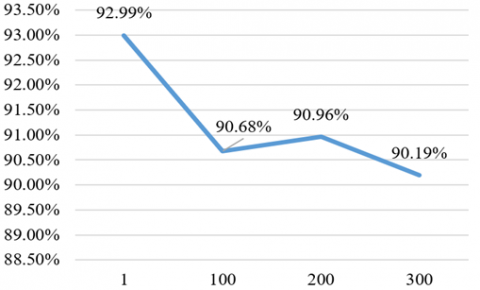
The values for NN parameter set in the experiment are letters: “a” (default) is the dataset’s classes and attributes divided by 2, “o” is the number of classes in the dataset, “t” is the dataset’s classes plus the attributes, and “i” is the number of attributes in the dataset. Figure 6 represents different hidden layer types with different accuracies. The hidden layer value “a” (default value) had highest classification accuracy, so we choose “a” as optimal value. Experiments were repeated with different seed values 1, 100, 200 and 300 and hidden layer was changed to “a”. Our results (as shown in Figure 7) revealed best accuracy of 92.99% is achieved when the seed is set to 1.
Figure 7. Accuracies for different seed values
Finally, the last parameter manipulated was learning rate, which had different results when all parameters remained at the default value, except for the hidden layer “o” and seed to 1. Figures 8 and 9 display the accuracies of different learning rate values: 0.3 had the highest accuracy result at 92.99%. Table 4 summarizes experimental results on the optimal values obtained for the NN classifier on the patient’s data model.
Figure 8. Different learning rates with accuracy results
Figure 9. Accuracies of different kernel types
Table 4. Optimum parameters of NN
|
Parameter |
Optimal value chosen |
|
Hidden layer |
a |
|
Seed |
0 |
|
Learning rate |
0.01 |
5.2 Naïve bayes
The classification accuracy of the Naïve Bayes [18] classifier is primarily affected by two factors. The first parameter is the numeric value’s distribution, which is set to Gaussian by default but may be changed to kernel by changing the “kernel estimator” from False to True. The “supervised discretization” option is the second parameter, which allows the user to convert numeric values to nominal values. The two factors had no influence on the patient’s clinical data model for Naive Bayes. As a result, the default parameters were used as the optimal values.
5.3 Support vector machine
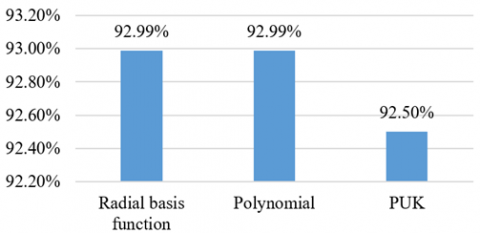
The parameter optimization strategy was employed to the patient clinical data model using Support Vector Machine (SVM) [19]. It is among the promising classifiers in healthcare data analytics. First, the experiment used all default values for the SVM parameters, except for the kernel parameter, each time the experiment was run with a different kernel value. Figure 8 provides the accuracies for different kernel types and highlights that the radial basis function and polynomial had the highest accuracies at 92.99%. Since the two kernel types had the same accuracy result, we chose the default, polynomial. The second parameter, cost, was changed many times (1, 10, 50, and 100), but all other parameters remained with default. Figure 10 displays the variation of the accuracy results for different cost values. The highest accuracy was 1 at 92.99%.
Figure 10. Accuracies of different cost values
Table 5 presents the optimum values of the proposed SVM algorithm for the patient clinical data model.
Table 5. Optimum parameters of SVM
|
Parameter |
Optimal value chosen |
|
Kernel type |
Polynomial |
|
C |
1 |
5.4 J48
The J48 classifier was applied as part of the optimization strategy to find the best accuracy result. It is quite effective probabilistic and lightweight classifier for binary problems. Figure 11 provides different values for the confidence factor and their accuracies. As can be seen, the highest accuracy result of confidence factor values among 0.1, 0.25, and 0.4 scales were achieved at 92.99%, so the optimal value was set to 0.25, the default value for the confidence factor.
Figure 11. Accuracies of different cost values
Table 6. Optimum parameters of J48
|
Parameter |
Optimal value chosen |
|
Confidence factor |
0.25 |
|
Seed |
1 |
|
Min. no. of instances per leaf |
2 |
The manipulation of other parameters did not affect the accuracy of the J48 classifier, which remained at 92.99%; all other parameters were optimal with their default values. Table 6 presents the summarized optimum values detected for J48 parameters on the patient clinical data model.
5.5 PART
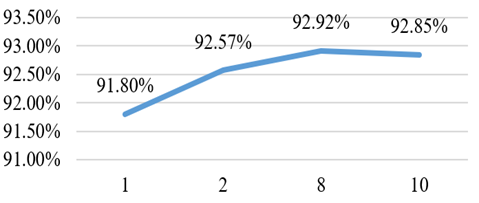
The PART classifier was employed as part of optimization strategy to find the best accuracy result. Figure 12 depicts different values of minimum number of objects and their accuracy results that were experimented. The accuracy result indicates that 8 is the most optimal value achieved for minimum number of objects at 92.92%. The second parameter was seed and its values were changed every time the experiment was run, but it always provided the same result (92.92%), which is the default optimal value. Table 7 provides the optimal values of the PART classifier for the patient family inheritance model.
Figure 12. Accuracies of PART classifier
Table 7. Optimum parameters of PART
|
Parameter |
Optimal value chosen |
|
Min. no. of instances per leaf |
8 |
|
Seed |
1 |
All the classification models rigorously experimented in this study were analyzed based on their optimal parameter measurements. We divided the target class on patient’s “family inheritance” into yes and no. “Yes” defined the patient and the patient’s mother as both having SCD, a family inheritance case, and visiting the hospital for treatment. Based on the SCD clinical data, in the last 12 years, we discovered 100 unique patients who certainly inherited this rare disease from their mothers (of 1428 patients). In the classification analysis, we compared five selected frequently employed methods to extract the best classification algorithm on the patient’s data. The classification models experimented using Weka data mining software are Naïve Bayes, J48, SVM, NN, and PART. First, we compared the classification methods’ accuracy, kappa statistics, and time. Table 8 presents the performance results of our comparison. As can be seen, the accuracies of the five classification methods were convergent. All classifiers had similar accuracy result (92.99%), while PART and Naïve Bayes had very close results (92.22%).
The kappa statistic for the Naïve Bayes classifier was the highest at 0.3252, while for SVM, it was 0, and for J48, it was 0.2721. In terms of speed, the Naïve Bayes was again the best which completed within 0.01 seconds, while the slowest classifier was NN at 22.43 seconds. The results are visualized in Figure 13, detailing the correctly classified instances, incorrectly classified instances, and the accuracy results.
Figure 13. Comparative graph of different classifiers
Table 9 illustrates the confusion matrix displaying the number of correctly classified instances for the five classification methods. Class “yes” (inherited) and class “no” (not inherited) were significantly classified accurately in all the classifiers. J48 and SVM had the same number of correctly classified instances at 1,328 as well as had the highest accuracy. Naïve Bayes had 32 instances correctly classified as inherited, which is the largest number of correctly classified instances for class “yes” among all classes.
To improve the criteria for detecting best classification model, we calculated performance metrics and compared classifiers as displayed in Table 10. As exemplified, J48 and SMO had highest sensitivity for class “yes”, denoting the inheritance of disease from the mother’s patient, while Naïve Bayes and PART classifiers were also close. Furthermore, Naïve Bayes was highest for class “no”, which defines the disease as not inherited. Specificity was also the highest irrespective of class yes/no for the naïve Bayes classifiers, which depend mainly on the correct classification rates.
Precision was also high in Naïve Bayes, demonstrating the proportion of number of instances among all the instances of actual values predicted correctly either in the “yes” or in the “no” class. F1 score, accuracy, and AUC were almost similar for Naïve Bayes and other classifier results for class “yes”. Hence, based on the experiment analysis, we conclude that for the given clinical dataset, naive Bayes emerged as the best classification algorithm for the prediction of inheritance and patient’s characteristics. As such, the naive Bayes classification method was employed to interpret the output for the knowledge discovery on the family inheritance.
Table 11 presents the qualitative compassion of the study [1]. The study was carefully selected for comparison due to its similarity of the community where the dataset was collected that is Eastern region of Saudi Arabia. However, the proposed study contains more instances and time span (4 times) compared to the study [1]. Moreover, this study [1] is purely clinical study while proposed study is AI based classification study for SCD disease.
Table 8. Performance statistics of different classifiers
|
Classifier |
Sensitivity |
Specificity |
Precision |
F1 score |
Accuracy |
AUC |
Class |
|
Naive Bayes |
0.968 |
0.320 |
0.950 |
0.959 |
0.922 |
0.904 |
Yes |
|
0.320 |
0.968 |
0.427 |
0.320 |
0.922 |
0.904 |
No |
|
|
J48 |
1.000 |
0.000 |
0.930 |
0.964 |
0.929 |
0.499 |
Yes |
|
0.000 |
1.000 |
0.000 |
0.000 |
0.929 |
0.499 |
No |
|
|
SVM |
1.000 |
0.000 |
0.930 |
0.964 |
0.929 |
0.500 |
Yes |
|
0.000 |
1.000 |
0.000 |
0.000 |
0.929 |
0.500 |
No |
|
|
NN |
0.953 |
0.310 |
0.948 |
0.951 |
0.929 |
0.868 |
Yes |
|
0.310 |
0.953 |
0.333 |
0.321 |
0.929 |
0.868 |
No |
|
|
PART |
0.980 |
0.200 |
0.942 |
0.961 |
0.929 |
0.873 |
Yes |
|
0.200 |
0.980 |
0.453 |
0.274 |
0.929 |
0.873 |
No |
Table 9. Confusion matrix of classification models
|
|
Classification |
Predicted (Not inherited) |
Predicted (inherited) |
|
Naïve Bayes |
Actual (Not Inherited) |
1285 |
43 |
|
Actual (Inherited) |
68 |
32 |
|
|
SVM |
Actual (Not Inherited) |
1328 |
0 |
|
Actual (Inherited) |
100 |
0 |
|
|
NN |
Actual (Not Inherited) |
1295 |
33 |
|
Actual (Inherited) |
80 |
20 |
|
|
J48 |
Actual (Not Inherited) |
1328 |
0 |
|
Actual (Inherited) |
100 |
0 |
|
|
PART |
Actual (Not Inherited) |
1314 |
14 |
|
Actual (Inherited) |
87 |
13 |
Table 10. Performance metric of different classifiers
|
Classifier |
Correctly Classified |
Kappa Statistic |
Classification Time (sec’s) |
|
Naïve Bayes |
92.22% |
0.3252 |
00.01 |
|
J48 |
92.99% |
0.2721 |
00.03 |
|
SVM |
92.99% |
0 |
00.28 |
|
NN |
92.99% |
0.2721 |
22.43 |
|
PART |
92.92% |
0.2405 |
00.24 |
Table 11. Comparison
|
Parameter |
Study in [1] |
Proposed Study |
|
Dataset region |
Dammam |
Dammam |
|
Dataset period |
2016-2019 (3 years) |
2008-2020 (12 years) |
|
Features |
Clinical |
Clinical + human factors |
|
Missing value |
Mortality information |
None |
|
Methods |
Clinical and statistics |
AI based classifiers |
|
Outcome |
Purely clinical |
Clinical and public/administrative |
Table 12. Data classification of patient inheritance
|
Attribute |
Yes |
No |
|
Sex |
||
|
Male |
64 (45.63%) |
607 (62.74%) |
|
Female |
38 (54.36%) |
723 (37.25%) |
|
Marital State |
||
|
Single |
101 (98.05%) |
790 (59.35%) |
|
Married |
2 (01.94%) |
541 (40.64%) |
|
Visits Count |
||
|
Low |
40 (38.09%) |
830 (62.26%) |
|
Moderate |
25 (23.8%) |
190 (14.25%) |
|
Over Moderate |
38 (36.19%) |
278 (20.85%) |
|
High |
1 (00.95%) |
26 (1.95%) |
|
Very High |
1 (00.95%) |
9 (00.67%) |
|
Age |
||
|
below 11.9 |
37 (33.63%) |
110 (8.22%) |
|
11.9-21.8 |
61 (55.45%) |
184 (13.75%) |
|
21.8-31.7 |
5 (04.55%) |
348 (26.00%) |
|
31.7-41.6 |
1 (0.90%) |
394 (29.44%) |
|
41.6-51.5 |
1 (0.90%) |
179 (13.37%) |
|
51.5 and above |
5 (4.50%) |
123 (9.16%) |
|
Hospital Visits |
||
|
before 2009.2 |
4 (3.64%) |
72 (5.38%) |
|
2009.2-2010.4 |
1 (0.91%) |
45 (3.36%) |
|
2010.4-2011.6 |
3 (2.73%) |
45 (3.36%) |
|
2011.6-2012.8 |
3 (2.73%) |
51 (3.81%) |
|
2012.8-2014 |
11 (10.00%) |
146 (10.91%) |
|
2014-2015.2 |
5 (4.55%) |
97 (7.25%) |
|
2015.2-2016.4 |
16 (14.55%) |
231 (17.26%) |
|
2016.4-2017.6 |
27 (24.55%) |
301 (22.50%) |
|
2017.6-2018.8 |
8 (7.27%) |
131 (9.79%) |
|
2018.8 and above |
32 (29.09%) |
219 (16.37%) |
|
Nationality |
||
|
Yemen |
6 (5.35%) |
21 (1.56%) |
|
Saudi Arabia |
95 (84.82%) |
1290 (91.7%) |
|
Sudan |
1 (0.89%) |
3 (0.22%) |
|
Palestine |
1 (0.89%) |
3 (0.22%) |
|
Jordan |
1 (0.89%) |
3 (0.22%) |
|
Nigeria |
2 (1.78%) |
5 (0.37%) |
|
Other Nationalities |
6 (5.34%) |
15 (1.08%) |
|
Residence |
||
|
Al Khobar |
76 (61.29%) |
709 (52.44%) |
|
Al Ahsa |
3 (2.42%) |
119 (8.80%) |
|
Dammam |
9 (7.26%) |
135 (9.99%) |
|
Al Qatif |
9 (7.26%) |
262 (19.38%) |
|
Dhahran |
7 (5.65%) |
59 (4.36%) |
|
Other cities |
20 (16%) |
68 (3.134%) |
The application of the Naïve Bayes classification model for patient family inheritance is displayed in Table 12, which includes the correlation summary on the patient's inheritance target class [20]. The results illustrate that most patients who inherited the disease from their mothers were female (54.36%). Patients’ marital status was also studied in this classification techniques [21, 22], and the majority (98.05%) of SCD patients who inherited the disease were singles.
An important feature on SCD inheritance modeling is the number of times SCD patients visited the hospital. In summary, 38.09% of the patients classified as inherited rarely visited the hospital in the last 12 years (less than 50 times), 36.19% visited the hospital between 100 to 500 times (over moderate), while 23.8% visited the hospital between 50 to 100 times (moderate), and 0.95% visited more than 500 times (very high). We also studied the relationship between the ages of patients who visited the hospital and their mothers in the last 12 years. The results indicate that most patients (55.45%) were between the ages of 11 and 21 years old, while 33.63% were below 11 years old and the rest were above 21 years old.
Between 2008 and 2020, we analyzed how many inherited patients made their last visits under different circumstances to the hospital. We observed 29.09% made their last visits between 2018 and 2020, and 24.55% visited between 2016 and 2017. Notably, after 2015, the number of last visits spiked except from 2017 to 2018 (7.27%). Two other features of the demographic data studied in this classification were the patients’ nationality and their residence. The results identified most inherited patients were obviously local Saudi citizens and residence (84.82%), followed by Yemeni (5.35%); the rest of the patients were other nationalities, such as Syrian or Palestinian. Regarding SCD patient’s residence, the classification results similar to [23] also indicated that most of the patients with inheritance cases are living in the eastern province of Saudi Arabia city primarily in the cities of Khobar (61.29%), while 7.26% are living in the city of Dammam and Al Qatif, followed by Dhahran (5.65%), and around 16% live in other cities of the country and are treated in the hospital.
Sickle cell disease, a blood disorder, is widespread among people primarily living in the eastern regions of Saudi Arabia due to the common practice of consanguineous marriages. Since there is no permanent cure, researchers and doctors have developed temporary methods to make life easier for SCD patients and their families. In this research, we first conducted statistical retrospective analysis and predicted the problems and various factors associated with SCD. We visualized and discussed in detail the patients’ disease inheritance reasons currently occurring in regions where the disease incidence is getting higher than the rest of the nation.
King Fahad University Hospital is a major public hospital located in the eastern province region. Through serving SCD patients from different cities, doctors at the hospital have noticed the rapid growth of SCD cases over the past decade. This research involved employing prediction models on twelve years (2008-2020) of SCD clinical data, obtained through official ethical approval process. This involved applying the five unique classification models most frequently employed for SCD research (naive Bayes, NN, SVM, J48, and PART classifiers) which were identified through the review of literature conducted in our previous work. The experiments involved analyzing, predicting, and identifying the optimize parameters of classifier algorithms. We measured and found naïve Bayes outperformed in the experiments (92.22%) which was further selected to extract the needed SCD patients’ inheritance knowledge (primarily from their mothers).
In conclusion, this research provided critical knowledge on SCD inheritance related causes, and management strategies in the eastern region of the country where SCD cases are rapidly growing especially in the last decade. Knowing data relationship between the inheritance of the disease and other factors would allow the government to educate and manage the disease by increasing disease awareness in the community, especially among mothers. The future direction of this research could consider how SCD patients who are infected with the currently ongoing pandemic COVID-19 is a major area of interest. The future research direction could also include how this rare heredity disease is infecting behavior of SCD patients living under different living conditions.
|
AI |
Artificial intelligence |
|
AUC |
Area under the curve |
|
ACS |
Acute chest syndrome |
|
CVA |
Cerebrovascular accident |
|
IRB |
Institutional review board |
|
NB |
Naive bayes algorithm |
|
NN |
Neural networks algorithm |
|
PART |
Partial decision tree algorithm |
|
SCC |
Sickle cell crisis |
|
SCD |
Sickle cell disease |
|
SVM |
Support vector machine algorithm |
|
SCT |
Sickle cell trait |
[1] Al-Ali, A.K., Alsulaiman, A., Alfarhan, M., et al. (2021). Sickle cell disease in the Eastern Province of Saudi Arabia: Clinical and laboratory features. American Journal of Hematology, 96(4): E117-E121. https://doi.org/10.1002/ajh.26096
[2] Mansingh, G., Osei-Bryson, K.M., Asnani, M. (2016). Exploring the antecedents of the quality of life of patients with sickle cell disease: using a knowledge discovery and data mining process model-based framework. Health Systems, 5(1): 52-65. https://doi.org/10.1057/hs.2015.3
[3] Alotaibi, M.M. (2017). Sickle cell disease in Saudi Arabia: A challenge or not. Journal of Epidemiology and Global Health, 7(2): 99.
[4] Alfaleh, A., Gollapalli, M. (2020). A critical review of data mining techniques used for the management of sickle cell disease. in Proc. ICCMS, Brisbane, Australia, pp. 147-152. https://doi.org/10.1145/3408066.3408105
[5] Deshpande, N.M., Gite, S., Aluvalu, R. (2021). A review of microscopic analysis of blood cells for disease detection with AI perspective. PeerJ Computer Science, 7: e460. https://doi.org/10.7717/peerj-cs.460
[6] Goyal, K.K., Paray, A.H. (2019). A survey of different approaches of machine learning in healthcare management system. International Journal of Advanced Networking and Applications, 11(3): 4270-4276. http://dx.doi.org/10.35444/IJANA.2019.11032
[7] Gosadi, I.M., Gohal, G.A., Dalak, A.E., Alnami, A.A., Aljabri, N.A., Zurayyir, A.J. (2021). Assessment of factors associated with the effectiveness of premarital screening for hemoglobinopathies in the south of Saudi Arabia. International Journal of General Medicine, 14: 3079. https://doi.org/10.2147%2FIJGM.S321046
[8] Hejazi, R.A., Mandourah, N.A., Alsulami, A.S., Bakhsh, H.T., Diri, R.M., Noor, A.O. (2021). Commonly used agent for acute pain management of sickle cell anemia in Saudi Emergency Department: A narrative review. Saudi Pharmaceutical Journal, 29(6): 487-496. https://doi.org/10.1016/j.jsps.2021.02.001
[9] Patel, A., Gan, K., Li, A.A., Weiss, J., Nouraie, M., Tayur, S., Novelli, E.M. (2021). Machine-learning algorithms for predicting hospital re-admissions in sickle cell disease. British Journal of Haematology, 192(1): 158-170. https://doi.org/10.1111/bjh.17107
[10] Balogun, J.A., Asinobi, A.O., Olaniyi, O., Adegoke, S.A., Oladeji, F.A., Idowu, P.A. (2019). Ensemble model for the risk of anemia in pediatric patients with sickle cell disorder. International Journal of Computers in Clinical Practice (IJCCP), 4(2): 33-59. https://doi.org/10.4018/IJCCP.2019070103
[11] Solanki, A.V. (2014). Data mining techniques using WEKA classification for sickle cell disease. International Journal of Computer Science and Information Technologies, 5(4): 5857-5860.
[12] Sen, B., Ganesh, A., Bhan, A., Dixit, S., Goyal, A. (2021). Machine learning based diagnosis and classification of sickle cell anemia in Human RBC. In 2021 Third International Conference on Intelligent Communication Technologies and Virtual Mobile Networks (ICICV), Tirunelveli, India, pp. 753-758. https://doi.org/10.1109/ICICV50876.2021.9388610
[13] Petrović, N., Moyà-Alcover, G., Jaume-i-Capó, A., González-Hidalgo, M. (2020). Sickle-cell disease diagnosis support selecting the most appropriate machine learning method: Towards a general and interpretable approach for cell morphology analysis from microscopy images. Computers in Biology and Medicine, 126: 104027. https://doi.org/10.1016/j.compbiomed.2020.104027
[14] Sanap, S.A., Nagori, M., Kshirsagar, V. (2011). Classification of anemia using data mining techniques. In International Conference on Swarm, Evolutionary, and Memetic Computing, pp. 113-121. https://doi.org/10.1007/978-3-642-27242-4_14
[15] Khalaf, M., Hussain, A.J., Keight, R., Al-Jumeily, D., Fergus, P., Keenan, R., Tso, P. (2017). Machine learning approaches to the application of disease modifying therapy for sickle cell using classification models. Neurocomputing, 228: 154-164. https://doi.org/10.1016/j.neucom.2016.10.043
[16] Gollapalli, M., Li, X., Wood, I. (2013). Automated discovery of multi-faceted ontologies for accurate query answering and future semantic reasoning. Data & Knowledge Engineering, 87: 405-424. https://doi.org/10.1016/j.datak.2013.05.005
[17] Xu, M., Papageorgiou, D.P., Abidi, S.Z., Dao, M., Zhao, H., Karniadakis, G.E. (2017). A deep convolutional neural network for classification of red blood cells in sickle cell anemia. PLoS Computational Biology, 13(10): e1005746. https://doi.org/10.1371/journal.pcbi.1005746
[18] Patgiri, C., Ganguly, A. (2021). Adaptive thresholding technique based classification of red blood cell and sickle cell using Naïve Bayes Classifier and K-nearest neighbor classifier. Biomedical Signal Processing and Control, 68: 102745. https://doi.org/10.1016/j.bspc.2021.102745
[19] Khalaf, M., Hussain, A.J., Alafandi, O., Al-Jumeily, D., Alloghani, M., Alsaadi, M., Dawood, O.A., Abd, D.H. (2019). An application of using support vector machine based on classification technique for predicting medical data sets. In International Conference on Intelligent Computing, pp. 580-591. https://doi.org/10.1007/978-3-030-26969-2_55
[20] Marinho, C.D.L., Maioli, M.C.P., Amaral, J.L.M.D., Lopes, A.J., Melo, P.L.D. (2019). Respiratory resistance and reactance in adults with sickle cell anemia: Part 2—fractional-order modeling and a clinical decision support system for the diagnosis of respiratory disorders. PLoS One, 14(3): e0213257. https://doi.org/10.1371/journal.pone.0213257
[21] Dami, S., Yahaghizadeh, M. (2021). Predicting cardiovascular events with deep learning approach in the context of the internet of things. Neural Computing and Applications, 33(13): 7979-7996. https://doi.org/10.1007/s00521-020-05542-x
[22] Gollapalli, M.A., Chabani, S. (2022). Modeling and verification of aircraft takeoff through novel quantum nets. Computers, Materials and Continua, 72(2): 3331-3348.
[23] Gollapalli, M. (2022). Ensemble machine learning model to predict the waterborne syndrome. Algorithms, 15(3): 93. https://doi.org/10.3390/a15030093