Ayodeji Olalekan Salau* | M.R. Pooja | Nahla Flayyih Hasani | Sepiribo Lucky Braide
© 2022 IIETA. This article is published by IIETA and is licensed under the CC BY 4.0 license (http://creativecommons.org/licenses/by/4.0/).
OPEN ACCESS
Predictive modeling of asthma characterized by the systematic use of Machine Learning and Deep Learning techniques to develop classification/prediction models is a vital tool which is being deployed in most of the computer mediated decision making processes. Spirometry, being one of the most commonly used lung function tests, helps in the diagnosis and continuous monitoring of asthma and is recommended by both the national and international guidelines for the management of the disease when compared to other pulmonary function tests. It has been found to be more reliable because it has more parametric values. Despite the generalization of the respiratory equations in spirometry with respect of selected ethnic groups, the equation yields a considerable difference when compared to the spirometric readings in the general population. In an effort to overcome such differences that deviate from actual observations, in this paper, we have proposed a neural network model that can output a vector of Tiffeneau-Pinelli index. The neural network model for the prediction of Tiffeneau-Pinelli index was able to reproduce a vector of indices that very closely approximated the actual observed values with a very low estimated error with an optimized radial basis fit neural net. This can be used as a reliable means to estimate some of the vital lung function parameters irrespective of the differences in the general population.
spirometry, reference equations, longitudinal data, sigmoidal, Tiffeneau-Pinelli index
Asthma is a chronic lung disease in which the obstruction of the airway is generally considered reversible, which means that the obstruction of the lung can be resolved with treatment and in some cases spontaneously. However, in the case of failure to recognize the disease at an early stage, the disease could be progressive and finally become irreversible. These days, mining the most interesting patterns from multiple phenotypes of medical data poses a significant challenge [1, 2]. The prevalence of airway diseases is significantly underestimated [3]. This necessitates authors to propose an approach that aids in the prediction of the disease using severity indicators that can be identified at an early stage, allowing for early medical interventions that alleviate disease severity, thereby lowering the mortality rate [4, 5]. Spirometry, being one of the most commonly used lung function tests, helps in the diagnosis and continuous monitoring of Asthma and is recommended by both, national and international agencies and guidelines for the management of the disease [6]. To determine whether the results of spirometric tests fall within the normal range, a comparison of the results against the reference equations describing the sample characterizing the "normal" population is essential [7]. There are numerous of such reference equations available, but the majority of them are only applicable to specific populations for a given age and gender [8].
1.1 Major contribution of the paper
Global Lung Initiative has been instrumental in releasing reference equations that have now been globally accepted across a broad age range, varying from 3 to 95 years for five different ethnic groups, including South East Asian, North East Asian, Black, Caucasian and others. Despite the generalization of respiratory equations to the selected ethnic groups, the equations most times yield a considerable difference compared to the general population's spirometric readings. In an effort to overcome such differences that deviate from the actual observations, we propose in this paper a neural network model that can give the vector of Tiffeneau-Pinelli Index. The Tiffeneau-Pinelli Index is a ratio that is indicative of several obstructive respiratory diseases, for a given age, height, and gender for a specific individual. It is concluded from the error estimation metrics: MAE, MSE, and RMSE that the output vector showed consistency with the observed values from the spirometry tests. With this in mind, we propose a risk assessment model that can be used as a reliable tool to estimate lung function parameters based on basic information such as gender, age, and height.
The proposed approach for the prediction of vectors produces a range of values that closely approximate to the actual vector compared to the ARTP prediction vector produced by respiratory equations in the normal population. This thereby provides an effective solution to assess risk of the disease at its early stage. The target vector corresponds to the actual Tiffeneau index, obtained through spirometry tests. This helps one in predicting the index using the proposed approach well before getting the spirometry tests done as the inputs vary closely to predict the target as observed by experimental results.
The rest of the paper is organized as follows. Section 2 presents a review of related works including the technological advances made in clinical diagnosis of asthma especially with respect to pulmonary function testing. We also discuss some of the common neural network and deep learning architectures which have been proposed in studies concerning prognosis of asthma. Section 3 discusses the Methodology deployed, with a discussion on the proposed neural networks model, the process of training and learning, and the optimization techniques with respect to the adoption of the activation functions. In Section 4, the results are presented along with inferences drawn, while in Section 5, the paper is concluded.
Pulmonary function test plays a vital role in respiratory medicine. It is utilized to analyze obstructions to airways, evaluate its seriousness and outcomes, outline hazard factors, recognize early lung ailment, and screen the lungs for lung decay. The pulmonary function changes with age, height, sex, and ethnicity. Therefore, test outcomes should be contrasted with anticipated qualities, and lower and maximum points of confinement of the typical values that are suitable for the individual being tried. There are numerous reference conditions, contributing to reference equations and most are identified with Caucasians [7, 8]. The suitability and appropriateness of the equations were not tested with the number of special cases, and the LLN or ULN (lower and upper limits of normal) were not absolutely determined. Similarly, many prediction equations rely on a smaller number of subjects and information gathered decades ago. Changes in spirometry methods and secular trends (i.e. a pattern in respiratory functioning in progressive birth associates) may influence the applicability of today’s results [9-11].
A comparison validating the results of spirometric tests against the reference equations describing the sample characterizing the “normal” population is utmost required in order to ascertain whether the results fall within the normal range [12-26]. A huge number of such reference equations are available, but they are mostly applicable to selected ethnic populations for a given age and gender [27, 28]. The proposed neural network model for the prediction of Tiffeneau-Pinelli index was able to reproduce a vector of indices that are very close to the actual observed values with a very low estimated error with an optimized radial basis fit neural net model. The error was low when evaluated on the test set for the prediction of index vector pertaining to both males and females.
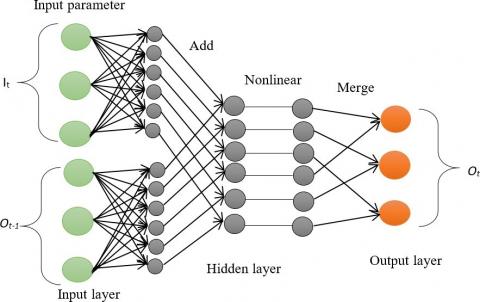
A neural network (NN) architecture typically imitates the network of neurons as such in the human brain and is constructed using connected layers, with the first and last layers being called the input layer and output layer, respectively [9]. The layers in between the input and the output layers are called hidden layers. This is depicted in Figure 1. Learning using NN usually happens in two phases. The first phase involves applying a non-linear transformation of the input to create a statistical model as an output. The second phase refines the model using derivatives. Both the phases are repeated in succession. While the underlying principles between CNN and NN are same, CNN does bring in some new concepts, besides the difference their input which is 2-dimensional vs. 1-dimensional in a standard neural network. A simple CNN has been used as the basis for the prediction process adopted in the neural network. A single 4x4 input matrix, with one 2x2 kernel matrix and a single convolution layer with one unit, one Rectified Linear Unit layer with one unit, a single pooling layer and a single fully connected (FC) layer was used. The elements of the filter matrix are equivalent to the unit weights in a standard NN and are updated during the backpropagation phase.
Figure 1. Neural Network Architecture used for classification
Deep learning networks in recent years have received a lot of unprecedented attention owing to the significant achievements in the field of healthcare and informatics accomplished by the intelligent deployment of the right network types. Deep learning networks incorporate sufficient depth into ANN by introducing more cascaded hidden layers built on same functions by exploring meaningful information which has a greater utility, especially with medical data that pose a lot of challenges [3-5]. Deep learning for asthma diagnosis is significant, more especially in the presence of extensive data of signs and symptoms as well as measures obtained from objective tests [18]. In this study, the number of neurons in each case was chosen to be less than the number of inputs and the same number of neurons was used in all the layers. An empirical analysis of the different activation functions employed in the hidden layers, including linear and non-linear functions was carried out to identify the most suitable performing activation function for the data under consideration. The performance of different optimizers was also analyzed.
3.1 Data acquisition and preprocessing
The data used in this study was obtained from the SPIROLA dataset. The dataset basically contains longitudinal data with respect to individual patients recorded over time. However, the data is not strictly periodic in nature; though it is closer to being called time series data. The dataset contains the following features: Age, Sex, Race, and pulmonary function parameters such as FEV1 and FVC. These are included as the primary attributes along with optional attributes such as second best FEV1 and second best FVC. For the sex attribute, the male attribute is represented as 1 in our dataset and female attribute as 2.
3.1.1 Feature transformation
The FEV1P, i.e. FEV1 predicted and FVCP i.e., FVC predicted are computed using the formulae published by the Association for Respiratory Technology and Physiology for males and female given by Eqns. (1)-(4). The formula is based on a regression model from a cohort study where “height” is in meters and "age” is in years. The formula for the predicted FVC and FEV1 is published by the Association for Respiratory Technology and Physiology which is based on a regression model from a cohort of subjects aged 18-60, and includes height, age and genders as the important parameters.
(i) Male:
fev1 = 4.30*height-0.029*age-2.49 (1)
fvc = 5.76*height-0.026*age-4.34 (2)
(ii) Female:
fev1 = 3.95*height-0.025*age-2.60 (3)
fvc = 4.43*height-0.026*age-2.89 (4)
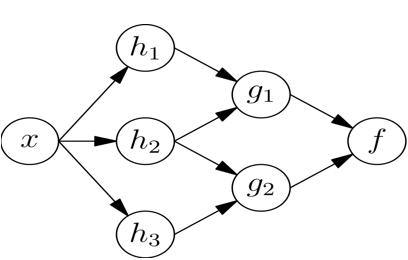
Neural nets, inspired by the learning process within human brains, permit computing systems to study and fine- tune analyzed new data. A neural network often called ANN, consists of a grid of functions, called parameters that achieve the task of learning. A simple neural network is depicted in Figure 2. The initial input, x is fed to the principal layer of the neurons, represented by “hn”, wherein all the functions reflect the accepted input and create the output, which is then accepted and streamed to the next layer represented as “gn”.
Figure 2. Architecture of neural network
3.2 Neural nets deployed
Though we used a wide range of neural networks including Feed forward back propagation, Cascade forward back propagation and Linear layer Design, Elman network, Layer recurrent, Radial basis function (RBF) and Radial basis with exact fit function, we discuss optimization with respect to Radial basis and its exact fit for our model as empirical estimations of the results were very significant.
3.2.1 Radial basis function
The RBF neural networks employ a radial basis function for its activation and relies largely on the amount of neurons in the hidden layer. The location of the functions also influences the performance of the neural network. A Gaussian function including a spread parameter of 1.0 was adopted to control the functioning of the neural network and its generalization. Radial basis functions in combination with spirometry are seen to yield considerably good results in the prediction of FEV1 [14, 15, 29].
3.2.2 Radial basis
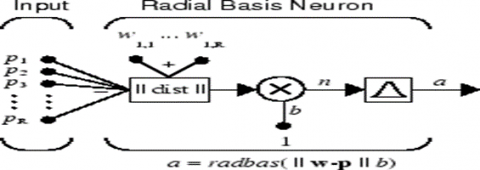
A radial basis exact fit function works on the basis of radial basis functions as an activation function. The RBF attains an extreme value of 1 when the input is 0. The distance between w and p decreases with an increase in the output. Thus, a radial basis neuron is a sensor that generates a 1 every time the input vector p and weight vector w is identical. Furthermore, whenever the weight vectors differ from the input vectors, the output is approximately zero and is seen to have a negligible impact on the linear output neurons. The radial basis exact fit NN is depicted in Figure 3.
Figure 3. Radial basis exact fit neural network
The net input in the case of an input neuron is quite dissimilar from the other neurons. The net input is the bias b, multiplied by the distance between its weight and the input. Both the input and weight are in the form of vectors. An element by element multiplication operation is implemented to combine the output of || dist || and the bias vector, b. The first layer has neurons which calculates the weighted inputs using net inputs to the model and the distance, while the second layer contains purlin neurons which calculate weighted inputs using dot product and net inputs, using net summation. Both layers include biases.
3.3 Training and Learning processes
3.3.1 Training function
The training function adopted, trainlm follows the Levenberg-Marquardt optimization to update both the weights and the bias. It is one of the fastest backpropagation algorithms and is recommended despite its requirements for more memory than the others. It uses validation vectors to stop training at an early stage in case the network's performance fails to improve or remains constant without any further improvement. Test vectors further validate that the network generally generalizes well, but has no effect on training.
The training process stops when any of the following conditions are met:
• Concentrated number of recurrences indicates epochs is reached.
• Concentrated time limit is exceeded.
• Performance gradient goes below min_grad.
• mu goes beyond mu_max.
• Validation performance goes beyond the maximum number of failure times after the last time it condensed.
The Levenberg-Marquardt algorithm approaches second order speed with respect to training without involving the task of the Hessian matrix. However, whenever the performance function is in the sum of squares form, as in feed-forward networks, the Hessian matrix and the gradient are computed as
H = JTJ and g = JTe
where J indicates the Jacobian matrix containing the first derivatives of the network errors computed with respect to weights and biases, and e is a vector with network errors. A standard backpropagation technique may be used to calculate the Jacobian matrix, which is computationally less complex when compared to hessian matrix.
3.3.2 Transfer learning and transfer functions
learngdm is seen as the gradient descent with momentum weight and bias learning function. It proceeds with a number of inputs and returns S-by-R weight (or bias) change matrix along with the fresh learning state.
In this section, the various transfer functions experimented with trainlm and learngdm functions are discussed. Hyperbolic tangent sigmoid transfer function accepts N, an S*Q matrix of net input vectors and yields A, the S-by-Q matrix of N’s elements compacted into [-1 1], which is mathematically comparable to tanh(N). However, it is different in that it executes faster than the general application of the function, but the results can vary slightly.
3.3.3 L-BFGS-B
Limited-memory BFGS is an optimization algorithm that customizes a limited amount of memory and fits the family of quasi-Newton methods that approximates the Broyden–Fletcher– Goldfarb–Shanno (BFGS). The problem to be optimized is the minimization of f(X) over unimpeded values of the real vector x, wherein f is a scalar function that is differentiable.
3.3.4 Adam — adaptive moment estimation
Adam optimization solver computes the learning rate individually for each parameter by looking into the estimates from the first and second gradient moments. As a combination of Adagrad and RMS prop, Adam works significantly well on sparse gradients and uses the moving average (exponential) of the gradients while scaling the learning rates, rather than using a simple average in Adagrad. Also, the Adam optimizer has very few memory requirements and is significantly computationally complex. Adam solver initially updates the moving average of the gradient and the squared gradient representing the estimates of the first and second moments. β1, β2 € [0, 1] which represent the Hyper parameters govern the exponential decay rates of the moving averages. Gradient descent, being one of the commonly used optimization methods in machine learning, finds the global minima by using the gradient of loss function by moving one step at a time towards the negative of the gradient. The gradient of the loss function, L is defined using the equations whenever Δw and Δb needs to be tracked. These represent the changes in the direction of w and b, respectively. The way gradient descent operates is to now frequently compute the gradient ΔL, and then move in the conflicting direction, “running down” the slope of the valley. Further, Stochastic Gradient Descent (SGD) is the most favored variation of gradient descent that estimates the gradient using a sample with a lesser size consisting of randomly chosen training inputs, characterizing mini-batches, at every iteration.
3.4 Optimization using activation functions
Activation functions, alternatively called transfer functions, are used to decide the output such as “yes” or “no” from the neural networks and ideally maps the resultant value in between 0 to 1 or - 1 to 1, subject to the type of underlying function used. It can be visualized as a step function that turns the output of the neuron on and off, subject to the satisfaction of a rule or threshold value.
The two types of activation functions, namely linear /identity and non-linear, are discussed in the following sections.
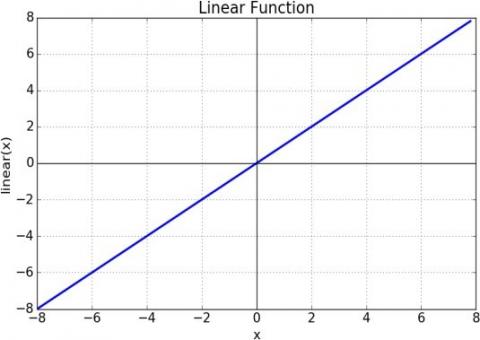
3.4.1 Linear /Identity activation function
The linear function is linear or just a line. As such, the output of the functions will not be narrowed between any specified ranges. It accepts the inputs, multiplies by the assigned neuron weights, and generates an output proportional to the input. In a way, a linear function attempts to be better than a step function, as it allows multiple outputs without just confining itself to a simple “yes” and “no”.
3.4.2 Non-linear activation functions
The class of non-linear activation functions permits the model to produce complex mappings amid the network's inputs and outputs, which are significant to learn and model complex data, such as data sets involving high dimensionality or non-linearity, e.g., images, audio, and video. We have experimented with three non-linear activation functions that are explained as follows.
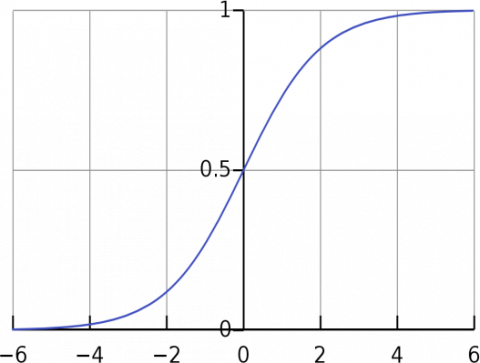
a. Sigmoid activation function
The sigmoid function is mostly used because it takes on values between (0 to 1), which essentially makes it useful for models where the prediction of probability is of utmost importance. The curve representing the function looks like “S” in shape. Subsequently, sigmoid is the right choice whenever the probability exists between the range of 0 and 1. In addition, the function is differentiable, which implies the slope of the sigmoid curve can be found out easily at any two points. However, the function, but not its derivative, is monotonic. Also, for multiclass classification, a softmax function which is a more generalized form of the activation function, can be used.
b. Tanh activation function
Tanh is very similar to sigmoid and even outperforms it in terms of performance. The tanh function has a range of -1 to 1, and it has the same shape as the sigmoid curve. This function is monotonic, but its derivative cannot be differentiated. Its most significant advantage is that in the graph for tanh, negative inputs are mapped powerfully negative and zero inputs are plotted to near zeroes. This activation function is commonly used for binary classification.
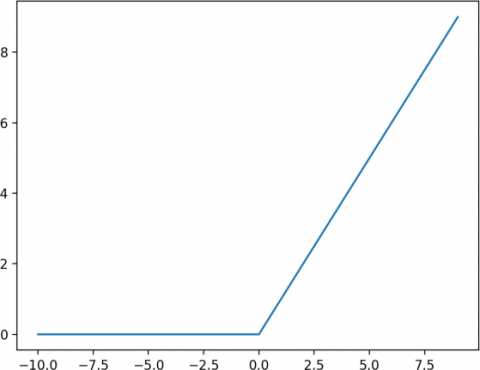
c. ReLU activation function
The Rectified Linear Unit (ReLU) function is half rectified (from the bottom). The function f(z) tends to zero when z assumes a value less than zero and it tends to z when z is greater than or equal to zero. The range of outputs varies from zero to infinity. With ReLU activation function, both the function and its derivative are monotonic. As a result, the graph is affected as the negative values are not mapped correctly. Figures 4, 5, 6 and 7 depict the graphs of both linear and non-linear activation functions.
Figure 4. Linear activation function
Figure 5. Sigmoid activation function
Figure 6. Tanh activation function
Figure 7. ReLU activation function
4.1 Implementation
The model was implemented using MATLAB R2022a on Windows 10 operating system with 8GB RAM.
4.2 NN training
The longitudinal data obtained from the SPIROLA database is initially trained using various neural network types with fevp and fvcp as the input data and fev1/fvc index as the output. This was achieved by computing the ratio of fev1 to fvc, both of which are obtained through spirometric tests. fev1p and fvcp represent the transformed input variables as they are derived from the input parameters indicative of age, gender, and height. The samples include females and males as well as healthy and asthmatic and subjects. Once the best performing neural network type was deduced, it was adopted for the prediction process on the test data set.
4.2.1 Training and learning steps
The input data consisting of 7,233 samples was trained on 5,000 samples and the rest was used for testing the model. We then obtain the transposed matrices of the order 2*5,000 and 1*5,000 respectively. The test was conducted on the longitudinal data pertaining to individual subjects. The model can be suitably deployed to predict the index, given age and gender at any point in time. This can further be used to evaluate the risk of contacting the disease with specified percentages of predicted fev1p and fvcp. The neural network types are trained using “learngdm” learning function and “trainlm” adaption function and a few network specific parameters [7].
4.3 Optimization
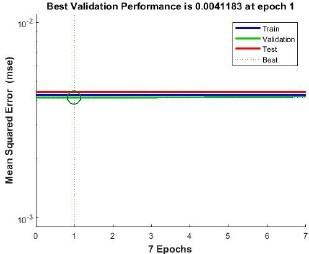
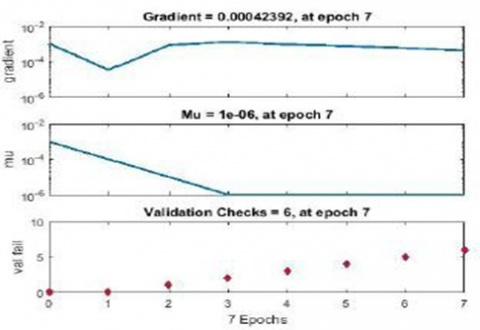
The performance of the network was measured using Mean Absolute Error (MAE) to assess the deviation between the actual and predicted vectors. The optimal performance of Mean Square Error (MSE) 0.0041 was obtained at epoch 1. It can be observed from Figure 8, which depicts the performance plot, that the curves representing training and validation along with that of testing converge is 0.0041183 at epoch 1. Figure 9 depicts the training state plot for the radial basis exact fit neural network, which was observed to outperform the others significantly. As shown by the estimation metrics, mean absolute error, the predicted values closely follow the actual values.
Figure 8. Performance plot
Figure 9. Training plot
It is clearly observed from Table 1, that a lower MAE as desired was obtained by RBF exact fit trained neural network, thus justifying the inference that RBF neural network is one of the most preferred approaches for prediction of the Tiffeneau-Pinelli index, the significant spirometer parameter under consideration. Tables 2 and 3 show the observed and predicted values for female and male subjects, with the Tiffeneau-Pinelli index indicated.
Table 1. Evaluation of the different neural network types on the training data
|
Network type |
MAE |
|
Feed-forward backprop |
0.0488 |
|
Elman backprop |
0.0487 |
|
Cascade forward backprop |
0.0488 |
|
Layer recurrent |
0.0489 |
|
Radial basis exact fit |
0.0477 |
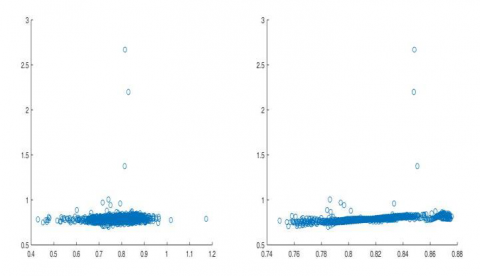
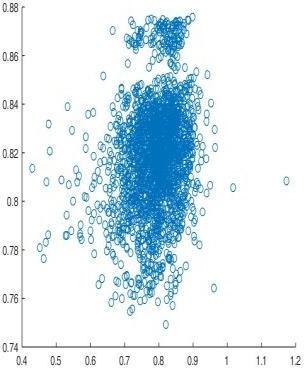
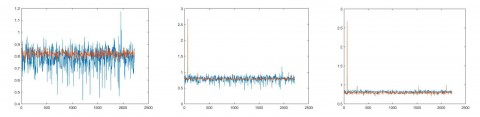
Figure 10 shows the two-dimensional Tiffeneau-Pinelli Index vector scatter plots for the test set representing the Actual vs. NN predictions, and ARTP vs. NN predictions, while Figure 11 depicts the Actual vs. ARTP predictions. Figure 12 shows the prediction plots of the variables mentioned in Figure 11. The NN predicted vector closely approximates the actual vector as compared to the ARTP prediction vector, especially in the normal population. As such, it can be used as a resourceful means to assess risk whenever the measured values show a larger variation as against those predicted.
Table 2. Evaluation of Tiffeneau-Pinelli Index for sampled female subjects
|
Patient 1 (F) |
Patient 2 (F) |
||
|
Actual |
Predicted |
Actual |
Predicted |
|
0.8809 |
0.8506 |
0.8515 |
0.8307 |
|
0.8447 |
0.8415 |
0.827 |
0.8329 |
|
0.8466 |
0.8354 |
0.8167 |
0.8318 |
|
0.8459 |
0.8205 |
0.814 |
0.8276 |
|
0.829 |
0.7893 |
0.8207 |
0.8237 |
|
0.8201 |
0.7842 |
0.8194 |
0.8476 |
|
0.848 |
0.7812 |
0.8022 |
0.8454 |
|
0.858 |
0.7808 |
0.741 |
0.8297 |
|
0.8406 |
0.7829 |
|
|
|
0.8333 |
0.7931 |
|
|
|
MAE |
0.0384 |
MAE |
0.0273 |
Table 3. Tiffeneau-Pinelli Index evaluated for sample Male subject
|
Patient 1 (M) |
Patient 2 (M) |
||
|
Actual |
Predicted |
Actual |
Predicted |
|
0.7903 |
0.7764 |
0.8875 |
0.866 |
|
0.7995 |
0.7767 |
0.89 |
0.8677 |
|
0.8018 |
0.7764 |
0.8954 |
0.8385 |
|
0.7921 |
0.7754 |
0.8624 |
0.8596 |
|
0.7523 |
0.7734 |
0.8801 |
0.8656 |
|
0.7716 |
0.7704 |
|
|
|
0.8085 |
0.7667 |
|
|
|
0.7738 |
0.7623 |
|
|
|
0.7918 |
0.7576 |
|
|
|
0.7536 |
0.753 |
|
|
|
MAE |
0.0408 |
MAE |
0.0236 |
Figure 10. Scatter plots actual vs NN and ARTP vs NN
Figure 11. Actual vs ARTP predicted
Figure 12. Prediction plots of actual vs. ARTPR predicted vector, actual vs. NN predicted vector and ARTP predicted vector vs. NN predicted vector
The proposed neural network model for the prediction of Tiffeneau-Pinelli index was able to reproduce a vector of indices that were very close to the actual observed values with a very low estimated error using the optimized radial basis fit neural net model. The error was observed to be low when evaluated on the test set for the prediction of index vector pertaining to both male and female. Different optimization methods with variable activation functions were used to deduce the best combination that yields optimal results in various scenarios. The classification models experimented yielded considerably good results with logistic activation function with l-bfgs-b-optimizer, as against a high expected performance via ReLU, a widely accepted high performance activation function. The presented model addressed the problem of prediction of an important index in spirometry, often used to evaluate different types of obstructive and restrictive diseases. It also addressed the problem of having a generalized solution for predictive index in spirometry indicative of asthma at early stages.
Early prediction of the asthma disease can minimize the number of asthma patients in the hospital. The presented model can be viewed as an important intervention to ensure the control of asthma, which usually leads to serious complications if not detected early. The spirometer readings such as Tiffeneau-Pinelli index is a very good indicator of the presence of obstructive lung disease such as asthma. The effectiveness of the model can further be improved by adopting spirometry data which cover various races of human population. The precision of the entire approach can further be strengthened if different sources of lung test data including images can be considered.
[1] Xiang, Y., Ji, H.Y., Zhou, Y.J., Li, F., Du, J.C., Rasmy, L., Wu, S., Zheng,WJ., Xu, H., Zhi, D.G., Zhang, Y.Y., Cui, T. (2020). Asthma exacerbation prediction and risk factor analysis based on a time-sensitive, attentive neural network: Retrospective cohort study. Journal of Medical Internet Research, 22(7): e16981. https://doi.org/10.2196/16981
[2] Delić, S., Cvjetković, T., Čajo, M., Čančar, I.F., Čolak, A., Ćenanović, N., Direk, E. (2021). Detection of asthma inflammatory phenotypes using artificial neural network. In: Badnjevic, A., Gurbeta Pokvić, L. (eds) CMBEBIH 2021. CMBEBIH 2021. IFMBE Proceedings, vol 84. Springer, Cham. https://doi.org/10.1007/978-3-030-73909-6_8
[3] Haque, R., Ho, S.B., Chai, I., Abdullah, A. (2021). Optimised deep neural network model to predict asthma exacerbation based on personalised weather triggers. F1000Research, 10: 911 https://doi.org/10.12688/f1000research.73026.1
[4] Badnjević, A., Gurbeta, L., Cifrek, M., Marjanovic, D. (2016). Classification of asthma using artificial neural network. 2016 39th International Convention on Information and Communication Technology, Electronics and Microelectronics (MIPRO), pp. 387-390. https://doi.org/10.1109/MIPRO.2016.7522173
[5] Gayathri, G.V., Satapathy, S.C. (2020). A Survey on techniques for prediction of asthma. Smart Intelligent Computing and Applications. Springer, Singapore, 159: 751-758. https://doi.org/10.1007/978-981-13-9282-5_72
[6] Chatzimichail, E., Paraskakis, E., Rigas, A. (2013). Predicting asthma outcome using partial least square regression and artificial neural networks. Adv Artificial Intelligence, 2013: 435321. https://doi.org/10.1155/2013/435321
[7] Loymans, R.J.B., Debray, T.P.A., Honkoop, P.J., et al. (2108). Exacerbations in adults with asthma: A systematic review and external validation of prediction models. J Allergy Clin Immunol Pract, 6(6): 1942-1952.e15. https://doi.org/10.1016/j.jaip.2018.02.004
[8] Deng, H., Urman, R., Gilliland, F.D., Eckel, S.P. (2019). Understanding the importance of key risk factors in predicting chronic bronchitic symptoms using a machine learning approach. BMC Medical Research Methodology, 19(1):70. https://doi.org/10.1186%2Fs12874-019-0708-x
[9] Dupuy, A.v., Amat, F., Pereira, B., Labbe, A., Just, J. (2011). A simple tool to identify infants at high risk of mild to severe childhood asthma: The persistent asthma predictive score. Journal of Asthma, 48(10): 1015-1021. https://doi.org/10.3109/02770903.2011.626481
[10] Anastasiou, A., Kocsis, O., Moustakas, K. (2018). Exploring machine learning for monitoring and predicting severe asthma exacerbations. In Proceedings of the 10th Hellenic Conference on Artificial Intelligence. https://doi.org/10.1145/3200947.3201036
[11] Amaral, J,L.M., Sancho, A.G., Faria, A.C.D., Lopes, A.J., Melo, P.L. (2020). Differential diagnosis of asthma and restrictive respiratory diseases by combining forced oscillation measurements, machine learning and neuro-fuzzy classifiers. Medical & Biological Engineering & Computing, 58(10): 2455-2473. https://doi.org/10.1007%2F978-3-030-05147-1_17
[12] Spathis, D., Vlamos, P. (2017). Diagnosing asthma and chronic obstructive pulmonary disease with machine learning. Health Informatics Journal, 25(3): 811-827. https://doi.org/10.1177/1460458217723169
[13] Sheshasaayee, A., Prathiba, L. (2018). An improvised technique for the diagnosis of asthma disease with the categorization of asthma disease level. In Information Systems Design and Intelligent Applications, pp. 985-994. Springer, Singapore. http://dx.doi.org/10.1007/978-981-10-7512-4_99
[14] Salau, A.O., Jain, S. (2021). Adaptive diagnostic machine learning technique for classification of cell decisions for AKT protein. Informatics in Medicine Unlocked, 23(1): 1-9. https://doi.org/10.1016/j.imu.2021.100511
[15] Salau, A.O., Jain, S. (2019). Feature extraction: A survey of the types, techniques, and applications. 5th IEEE International Conference on Signal Processing and Communication (ICSC), Noida, India, pp. 158-164. http://dx.doi.org/10.1109/ICSC45622.2019.8938371
[16] Pooja, M.R., Pushpalatha, M.P. (2018).A neural network approach for risk assessment of asthma disease. Journal of Health Informatics & Management, 2(1). Corpus ID: 201143916
[17] Pooja, M.R., Pushpalatha, M.P. (2015). A hybrid decision support system for the identification of asthmatic subjects in a cross-sectional study. 2015 International Conference on Emerging Research in Electronics, Computer Science and Technology (ICERECT), pp. 288-293. http://dx.doi.org/10.1109/ERECT.2015.7499028
[18] Pooja, M.R., Pushpalatha, M.P. (2019). Analysis of a panel of cytokines in bal fluids to differentiate controlled and uncontrolled asthmatics using machine learning model. Journal of Respiratory Research, 5(1): 142-145. https://doi.org/10.17554/j.issn.2412-2424.2019.05.44
[19] Pooja, M.R., Pushpalatha, M.P. (2019). A predictive framework for the assessment of asthma control level. Int J Eng Adv Technol, 8: 239-45.
[20] Tomita, K., Nagao, R., Touge, H., Ikeuchi, T., Sano, H., Yamasaki, A., Tohda, Y. (2019). Deep learning facilitates the diagnosis of adult asthma. Allergology International. https://doi.org/10.1016/j.alit.2019.04.010
[21] Tobore, I., Li, J.Z., Liu, Y.H., Al-Handarish, Y., Kandwal, A., Nie, Z., Wang, L. (2019). Deep learning intervention for health care challenges: Some biomedical domain considerations. JMIR mHealth and uHealth. 7(8): e11966. https://doi.org/10.2196/11966
[22] Wang, X., Wang, Z.J., Pengetnze, Y.M., Lachman, B.S., Chowdhry, V. (2019). Deep learning models to predict pediatric asthma emergency department visits. arXiv preprint arXiv:1907.11195. https://doi.org/10.48550/arXiv.1907.11195
[23] Manoharan, S.C,. Ramakrishnan, S. (2009). Prediction of forced expiratory volume in pulmonary function test using radial basis neural networks and k-means clustering. Journal of Medical Systems. 33(5): 347. https://doi.org/10.1007/s10916-008-9196-y
[24] Ma, X., Wu, Y.P., Zhang, L., Yuan, W.L., Yan, L., Fan, S., Lian, Y.Z., Zhu, X., Gao, J.H., Zhao, J.M., Zhang, P., Tang, H., Jia, W.H. (2020). Comparison and development of machine learning tools for the prediction of chronic obstructive pulmonary disease in the Chinese population. Journal of Translational Medicine, 18: 146. http://dx.doi.org/10.1186/s12967-020-02312-0
[25] Messinger, A.I., Bui, N., Wagner, B.D., Szefler, S.J., Vu, T., Deterding, R.R. (2019). Novel pediatric - automated respiratory score using physiologic data and machine learning in asthma. Pediatric Pulmonology. https://doi.org/10.1002%2Fppul.24342
[26] Ciancio, N., Pavone, M., Torrisi, S.E., Vancheri, A., Sambataro, D., Palmucci, S., Vancheri, C., Marco, F.D., Sambataro. (2019). Contribution of pulmonary function tests (PFTs) to the diagnosis and follow up of connective tissue diseases. Multidisciplinary Respiratory Medicine, 14(1): 1-11. https://doi.org/10.1186/s40248-019-0179-2
[27] Pooja, M.R. (2022). On effective use of feature engineering for improving the predictive capability of machine learning models. Computational Intelligence and Data Sciences: Paradigms in Biomedical Engineering. CRC Press, Taylor and Francis, pp. 53-62. https://doi.org/10.1201/9781003224068
[28] Pooja, M.R., Pushpalatha M.P. (2020). Cluster analysis to characterize the patterns of complementary and alternative medicines usage in asthma controls. The Open Public Health Journal, 13(1). http://dx.doi.org/10.2174/1874944502013010227
[29] Nafisi, V.R., Eghbal, M., Torbati, N. (2021). Conceptual design of a device for online calibration of spirometer based on neural network. Journal of Biomedical Physics and Engineering.