Abdul Hameed Sadeq Hameed* | Hayder A. Al Thamiry
© 2022 IIETA. This article is published by IIETA and is licensed under the CC BY 4.0 license (http://creativecommons.org/licenses/by/4.0/).
OPEN ACCESS
An evaluation the performance of the irrigation system for the Al-Ishaqi irrigation project for the Eastern Canal was conducted to identify management strategies that can be used to improve the operation and performance of the irrigation system. The study area is located in Salah al-Din G.0overnorate, Iraq. The field work included determining the moisture content of the soil before and after irrigation, measuring the inflow of the field to find the depth of the applied water, field monitoring, and measuring the depth of the root zone for each irrigation process. Field measurements showed that the average efficiency of water application for the two fields (A, and B) are 59.81% and 38.6%, respectively. The results of the efficiency of water application showed that farmers use water more than the actual demand, so it was possible to increase the efficiency of field water use by controlling the quantities of water that supplied and controlling the irrigation time and water distribution within the irrigated land. The results also showed that the storage efficiency of the two fields (A, and B) ranged between (39.1% to 68.28%), and (41.80% to 79.8%), respectively. As for the efficiency of water distribution, the average distribution efficiency for fields (A) and (B) was about (99.54%) and (99.33%), respectively. The irrigation efficiency evaluation done in the Al-Ishaqi Irrigation Project revealed that farmers utilize more water than is required, resulting in a substantial amount of water being lost in the fields observed in this research owing to inefficient use. If the current scenario continues, groundwater levels would undoubtedly rise, putting the irrigation system's long-term viability in jeopardy.
irrigation, application, efficiency, storage, distribution, moisture content
Water scarcity and global climate change are issues that most countries are dealing with today. The water scarcity that Iraq suffers from due to a decrease in water from river sources, a decrease in rain, and low irrigation efficiency in irrigation projects, therefore, it is necessary to evaluate the performance of the irrigation system for the Al-Ishaqi irrigation project to determine the water management strategies that can be used to improve the efficiency of the performance of the irrigation system. It is necessary to take good and fast steps to achieve a strategic vision for water management and to improve water use through the use of modern irrigation systems, technologies, methods, and agricultural processes [1]. The evaluation of water use efficiency has become very important to determine the amount of water lost and the actual need for water, especially in irrigation projects to determine its efficiency.As the world's population grows, the demand for more effective and efficient land and water resource management grows [2]. Many irrigation projects, particularly large-scale irrigation projects, are performing far below their potential performance [3, 4]. This is mostly due to inefficient resource management, a lack of anticipated advantages, and harmful health and environmental consequences [5]. the necessity of analyzing irrigation systems to determine their efficiency, consistency, and sufficiency to other performance metrics [6]. More emphasis is being placed on the efficient use of irrigation water for maximum economic return and ensuring the long-term sustainability of water supply. If we are to continuously expand and maintain agricultural productivity, optimal crop water management is required for greater sustainability [7]. The objective of evaluating irrigation system performance is to ensure that resources are used more efficiently and effectively by providing appropriate feedback to management at all levels [4]. performance indicators are measurable variables that represent the state of irrigation systems and their changes over time and space [8]. Water distribution standards and irrigation efficiency have recently become critical tools for modern agricultural activities. Irrigation systems with high efficiency are better when compared to those with lower efficiency. The ratio between the amount of water retained in the root zone of the plant and the amount of irrigation water supplied is the water use efficiency of any crop. Therefore, the necessity of optimal use of water is very important because it requires the largest share of water [9]. Evaluating the performance of irrigation illustrates a practical education to stakeholders on how things work and what the system can do effectively to improve the performance of irrigation systems. Thus, it should be an assessment of the performance of irrigation schemes to check the status of systems and the level of water use efficiency [10]. Improving water use efficiency for irrigation and increasing productivity through different systems is one of the economically feasible alternatives to overcoming water shortage. One of the priorities in agriculture today is to develop irrigation designs that are more efficient in the use of water and energy resources for a variety of crops and agricultural practices. Thus, evaluation of existing design rules and standards is essential to achieve effective designs. evaluating the effectiveness of an irrigation system is a critical step in improving long-term agriculture water management. The results of the study will help determine the efficiency of water application to the irrigation system (border and furrow) of the eastern canal of the Ishaqi irrigation project, determine the losses from applied water inside the fields, and make recommendations to increase the efficiency of irrigation in the system and its effective management. Since almost all of the transmission and distribution systems in the Al-Ishaqi Irrigation Project are lined and the main canals are wide, a large proportion of the water lost in the canals will be by evaporation. In light of this result, it is important to focus on how to improve on-farm water application for the Al-Ishaqi Irrigation Project. Figure 1 shows the structure of the paper.
Figure 1. The schematic diagram of the paper methodology
There are many studies and investigations that have been conducted to evaluate irrigation projects around the world. Where, Getnet [11] studied and evaluated the efficiency of irrigation application in the Koga scheme in Ethiopia, where he selected three farms within the study area, and the necessary field work was conducted to evaluate. Where the field results showed that the application efficiency in the three farms ranged between 52% and 61.8%. The reliability of the scheme evaluated from the irrigation interval shows that the schemes are watered more frequently than intended. Ucar et al. [12] studied the evaluation of the water use efficiency of surface irrigation methods in the Sarkikaragak Irrigation Scheme in Turkey. The study showed that the average efficiency of water application in the fields amounted to 39.8%, as the results showed that the irrigation efficiency is low in the study area as a result of the wrong use of water inside the farm. Al Mosawi and Al Thamiry [13] conducted a research study to evaluate the Elaj irrigation project in Babil Governorate, Iraq, to determine the efficiency of water application, the overall efficiency of the system, and the efficiency of water use, and the economic productivity of water. The field study was carried out on three fields in the project (B1, B2, and B3) located at the beginning, middle, and end of the project. Field measurements of moisture content, field discharges, and effective root zone depth measurement were performed. The results showed that the water application efficiency in fields B1, B2, and B3 was between 32%-38%, 32%-39%, and 32%-39%, respectively. The overall efficiency of the system was 32.3%. The study showed that the efficiency of water use was low at the beginning of the project and increased at the end, as it ranged between 1.22- and 1.33 (kg/m3). The economic productivity of fields B1, B2, and B3 680.3, 815.2, and 897.4 (ID/m3) were respectively. The study revealed that the increase in productivity is not by increasing the amount of water consumption, but by optimizing the use of water by taking into account the needs of the plant and the appropriate irrigation time. Abbasi et al. [14] studied irrigation efficiency in Iran from 1991 to 2015, and the results showed an increase in irrigation efficiency in recent decades due to improved knowledge of users about water and soil problems and the use of modern irrigation systems. Shaikh et al. [15] studied losses assessment of Irrigation Applications in the Jamrao irrigation Scheme, Sindh, Pakistan. Field measurements were carried out on 20 farms for moisture content before and after irrigation. The results revealed that soil types and irrigation methods have a significant impact on application losses whereas the type of crops does not have any effect on the efficiency of water application. The sprinkler, drip, and furrow irrigation methods showed better performance compared to the other methods (border, basin, and wild flooding) used in the study area. Total water application losses in the scheme were calculated to be around 23$\%$. The results of this study showed that irrigation survey studies are useful to clarify irrigation system losses and provide opportunities for improvement. The main reason for the low irrigation efficiency is the improper irrigation time, the wrong flow rate, the incorrect application of water and the lack of attention to the ability of the soil to retain water proposd by Hassam and Kiani [16].
3.1 Study area
Al-Ishaqi Irrigation project is situated within the central region of Iraq and within the administrative borders of the governorates of Salah al-Din and Baghdad. as shown in Figure 2. The study area is located within 34°04'50" and 33°29'38"N latitude and 44°27'13" and 43°58'28"E longitude. The total area of the project is 171,750 hectares and the irrigated area is about 94,764.5 hectares. The mean annual rainfall of the project is 161.8 mm with the maximum rainfall amount occurring in Jan. The mean daily minimum and maximum temperature vary between 4.1${ }^{\circ} \mathrm{C}$-15.6${ }^{\circ} \mathrm{C}$ and 24.7${ }^{\circ} \mathrm{C}$-43.5${ }^{\circ} \mathrm{C}$, respectively. The relative humidity of the study area varies between 70.1% and 78.5%. The windiest month is December (1.27 m/s) and highest in March (3.1 m/s). The sunshine hour shows a large variation (6-12.5 h/day). The soil of the agricultural land in the project is silt loam, loam, and sandy loam. The irrigation methods used in the project are surface, pump, drip, and sprinkler irrigation. The main irrigation network in the Al-Ishaqi irrigation project consists of the main canal and the eastern and western canals, from which secondary canals branch. This research will address the eastern canal of the project, which branches off at km 30 + 700 from the main canal of the project and which irrigates the 6243.5 hectares of land between the Tigris River and the eastern drainage. The design drainage of the eastern canal is 35 m3/sec, while its length is 80.07 km. 36 secondary channels branch off from the eastern canal, all of which are lined with concrete except for four of them dirt.
Figure 2. Location map of Al-Ishaqi irrigation project for the eastern canal
3.2 Data collection
3.2.1 Field selected
The evaluation of the Al-Ishaqi irrigation project needs to find the actual irrigation efficiency in many farms. Two farms were chosen to evaluate the irrigation performance inside them as accomplished by the farmer (that is, as he practices it in the current reality without guidance or change in the irrigation process). The selected fields that are named A and B are located within the lands irrigated by the eastern canal, At the beginning and mid of the canal. The coordinates of the farms are listed in Table 1.
Table 1. The coordinates of the farms selected study area
|
No. |
Canal name |
Fields selected |
Station Km |
UTM Coordinates(m) |
|
|
Easting |
Northing |
||||
|
1 |
Eastern canal |
A |
690+0 |
448735 |
3588471 |
|
2 |
B |
200+22 |
447854 |
3582928 |
|
3.2.2 Soil characteristics of fields
Soil samples were taken from the chosen fields with a depth of 0-50 cm and 50-100 cm to cover the predicted depth for the root area. The characteristics of the soil generated a variance in the soil layers from 0-50 and 50-100 cm as a consequence of the change of moisture in the soil in the soil layer from 0-100 cm. The test of water content at field capacity (F.C), permanent wilting point (PWP) (by volume), and Soil texture were conducted at the laboratory of Tikrit University, College of Agriculture. The bulk density test was in the field using the core. Table 2 shows Laboratory results for soil (soil texture, field capacity, permanent wilting point, bulk density).
Table 2. Soil characteristics of the selected fields within the study area
|
PWP (%) |
F.C (%) |
Bulk density (g/cm3) |
Soil texture |
Depth of soil (cm) |
Fields selected |
|
9.06 |
37.6 |
1.39 |
Sandy loam |
0-50 |
A |
|
9.02 |
38.2 |
1.4 |
Sandy loam |
100-50 |
|
|
12.36 |
47.08 |
1.36 |
Silt Loam |
0-50 |
B |
|
10.77 |
43.22 |
1.32 |
Silt Loam |
50-100 |
3.2.3 Sample collection
Soil samples were taken immediately before irrigation from three locations in the field, one in the first third, the second in the middle third, and the third in the last third. A hand auger and core were used to bore to varying depths; 0-25, 25-50, and 50-100 cm according to mentioned by FAO [2]. It was taken according to the depth of the root zone, removed moist soil samples were placed in a tray, covered and taken. The samples were weighed and dried in the oven The moisture content was determined before irrigation. And on the next day after irrigation, soil samples were taken from the same locations and previous depths to determine the moisture content after irrigation.
3.2.4 Measurement of a root zone
Because accurate measurement of the root zone is difficult due to a variety of variables, it is often assumed or inferred. The root depth for the selected crops (grapes and alfalfa) in the experimental field is measured by cutting randomly selected plants, taking into account the expected depth and radius, and measuring the root depth for each irrigation using a tape measure.
3.2.5 Inflow measurement
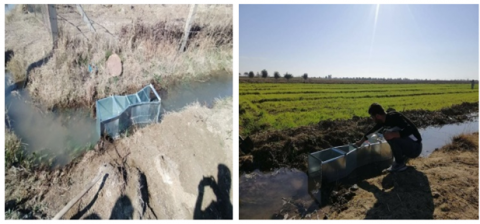
Due to the absence of gates and weirs at the outlets of the fields and the difficulty of knowing the pump discharge to know the volume of water entering the field, a Venturi Flume was placed at the entrance to the channel entering the field to know the discharge inside the field. A critical depth is created in a venturi flume, which is an open critical-flow flume with a constrained flow that lowers the hydraulic grade line. Discharge was measured using Venturi Flume by measuring the height of the water in the source and the other in the throat. The coefficient for the used Venturi Flume device was found by measuring the discharge in an experimental field by volume method and Venturi flume, and the coefficient was 0.98. Flow rates were measured in each irrigation, so the irrigation for flow rates for the two fields (A, and B) are 19-31.7 lps, respectively. Figure 3 shows the measurement of the inflow of the field. The discharge is calculated from the following equation according to mentioned by Cone [17]:
$Q=C B_2 \sqrt{\frac{2 g H}{1-\left(\frac{B_2 y_2}{B_1 y_1}\right)^2}}$ (1)
where, $Q$ is discharge (m3/sec), $C$ is coefficient of discharge, $B_1$ is Width upstream (m), $B_2$ is Width throut (m), $y_1$ is Depth upstream (m), $y_2$ is depth throut (m), $H$ is depth difference (y1-y2).
Figure 3. Measurement of the discharge using a Venturi Flume in the study area
4.1 Moisture content and depth of water stored
The moisture content was calculated using the following mathematical formula was according to mentioned by Musa et al. [18]:
$P_w=\frac{W_w}{W_s} \times 100$ (2)
where, $P_w$ is Moisture content (by weight), $W_t$ is the weight of moisture soil, $W_s$ is the weight of solid soil, $\left(W_t-W_s\right)=W_w$ is the weight of water.
The following is how the amount of moisture has been transformed from weight ratios to volume ratios $P v$:
$P_v=P_w A_s$ (3)
where, $A_s$ is the specific gravity of the soil (which varies based on the soil textural classification).
The calculated moisture was translated to a depth of water so that the numbers could be utilized in Eq. (2). By multiplying the volume percentage \left(P_v\right) by the depth of soil (D) extracted by the auger, the moisture content of the soil was calculated on a depth basis.
Thus,
$d=\frac{p_w}{100} \times A_s \times D$ (4)
where, $d$ is the depth of water stored before and after irrigation in the root zone, and $D$ is the depth of a root zone.
Similarly, the total depth of water held in the root zone was determined by adding the proportion of crop consumptive consumption until the time to take a soil sample after irrigation, as shown below:
$d_n=d+E_{t c}$ (5)
where, $d_n$ is the total depth of water stored in the root zone, $E_{t c}$ is consumptive use of the crop for the period between sample time before and after irrigation.
4.2 Depth of water applied
The following equation was carried out to calculate the average depth of applied water from the irrigation system which was used in the fields:
$Q * T=\boldsymbol{d} \boldsymbol{g} * \mathrm{~A}$ (6)
where, $Q$ is the flow rate $\left(\mathrm{m}^3 / \mathrm{min}\right), T$ is the time of irrigation $(\mathrm{min}), d_g$ is the average depth of applied water (mm), and $A$ is the area of the field $\left(\mathrm{m}^2\right)$.
4.3 Water application efficiency
The water application efficiency was calculated by using the following relation according to [2]:
$E_a=\frac{d_n}{d_g} \times 100$ (7)
where, $E_a$ is Water application efficiency ($\%$), $d_n$ is the Depth of water stored in the root zone $(\mathrm{mm})$, and $d_g$ is the Total depth of water applied in the field $(\mathrm{mm})$.
4.4 Water distribution efficiency
This shows how uniformly water is applied to the field along the irrigation run according to mentioned by FAO [2]:
$E_d=\left(1-\frac{Y}{d}\right)$ (8)
where, $E_d$ is water distribution efficiency, $d$ is the average depth of water penetration, and $y$ is the average deviation from $\mathrm{d}$.
4.5 Water storage efficiency
Storage efficiency refers to the efficiency of water storage in the root zone relative to the water that this area is needed, and it is expressed mathematically as according to mentioned by FAO [2]:
$E s=\left(\frac{d n}{d s}\right) \times 100$ (9)
where, $E s$ is the water storage efficiency (%), and $d s$ is the depth of water needed by the root zone during one irrigation (mm).
5.1 Moisture content
Moisture content is an important input for evaluating irrigation efficiency, where has calculated change in the moisture content of irrigations of the selected farms within the study area and during the period from Nov., 1-2021 to Apr., 20-2022, Figures 4, and 5 show the change in moisture content before and after irrigation of all irrigations for each farm and also shows the (FC) and (PWP) levels and the allowed depletion management (AD). The (AD) was chosen as a criterion for determining whether the applied water was sufficient or not based on [2] guidelines for each group. The farmers in the study area are not familiar with (AD) but rely on their experience and the availability of water in the project to determine the irrigation times. Demonstrates that when the moisture content is less than (PWP), the soil becomes dry and the crop is unable to draw water from the soil. This means that the difference between (FC) and (PWP) is the amount of water available to the crop.
Figure 4. Relationship in moisture content before and after irrigation (by volume) for the effective root zone in field A
Figure 5. Relationship in moisture content before and after irrigation (by volume) for the effective root zone in field B
The level of moisture content before irrigation for field A, as shown in Figure 3 was above the allowed depletion level (AD) during the monitoring period. This means that it is possible to delay the irrigation process to exhaust at least 50% of the moisture content, and this It is not possible in the conditions of the project, because the irrigation system in the project is alternately irrigated every week and because the field is near to the branching area and the water is available continuously, which prompted the farmer to irrigate every week. As for field B, as shown in Figure 4 the level of moisture content before irrigation was below the allowed depletion level (AD) and near to the permanent wilting point (PWP) during the observation period of 170 days. This means that the plant was under the pressure of moisture which is expected to negatively affect the yield. The reason for the low moisture content is the postponement of irrigation to harvest the alfalfa in the study area. Another reason is that the farmer in each irrigation applies water in approximately the same quantities, which indicates that the farmer is not aware of the water requirements of the cultivated plants.
5.2 Depth of applied water
The applied water results conducted in the selected farms show that the used water by farmers is higher than the needed water. The average depth of water applied in field A was 70.36 mm and the stock in the effective area was 43.05 mm, while 27.30 mm was deep percolation, which is about 38.6% of the amount of water lost in this field. As for field B, a large percentage of water was lost especially in the first irrigations of plant growth by about 61.3%. All of this can be attributed to the reasons for the excessive application and unwise use of the farmer’s insistence on filling the border and furrow to the upper edge and the expectation that more water means more productivity and the effect of soil texture, land slope, and type of border and furrow used by the farmer in the study area. Another reason is that the farmer in each irrigation applies water in approximately the same quantities, which indicates that the farmer is not aware of the water requirements of the cultivated plants. Figures 6 and 7 show the applied water depth, stored depth, and water losses for the selected fields A, and B within the study area.
Figure 6. Depth of applied water, depth stored, and water losses for all irrigation in field A
Figure 7. Depth of applied water, depth stored, and water losses for all irrigation in field B
5.3 Water storage and distribution efficiency
Calculation of the storage efficiency based on the field measurements showed that the amount of water added to the field is greater than the needed water, as the field water storage efficiency values for fields A and B are ranged between (39.1% to 68.28%), (41.80% to 79.8%), respectively. As for the efficiency of water distribution for all fields, it was above 90%, and it is classified as excellent according to mentioned by FAO [2]. Results indicative of the extent of the uniform water distribution along with the flow as a result of flooding the entire fields with water, and this helps the uniform irrigation. The average distribution efficiencies for fields A and B were about (99.54%), and (99.33%), respectively. Figures 8 and 9 shows the efficiency of water storage and distribution in the fields. The irrigation methods used in the selected fields in the study area (surface irrigation) help to increase the uniformity of irrigation as a result of adding large quantities of water, but at the expense of other irrigation efficiencies.
Figure 8. The efficiency of water storage and distribution for field A
Figure 9. The efficiency of water storage and distribution for field B
5.4 Water application efficiency
The water application efficiency in the selected farms for the Al-Ishaqi irrigation project for the eastern canal was calculated from the proportion between the depth of water applied to the field and the depth of water added to the root zone. where the field measurements showed the actual water application efficiency for field A is, which was irrigated with furrow, about 59.81%, this value is within the range of water use efficiency which is allowed for surface irrigation (furrow and borders irrigation systems), that is, 40%-60% as listed by FAO [2]. Additionally, the actual averaged application efficiency of water in field B, which is irrigated with the borders, is about 38.6%. The results of the efficiency of water application that was conducted in the study area show that farmers use water more than the actual demand for the plant's need, so it was possible to increase the efficiency of field water application by simply controlling the irrigation time and making it, for example, 3 hours instead of exceeding 5 hours. This process alone is enough to raise the irrigation efficiency from 37% to 60%, but the insistence of the farmer to fill the furrow and border to their upper edges led to a decrease in the irrigation efficiency as a result of the increase in the volume of water that used by them. Figure 10 shows the trend of the application efficiency curves for the selected fields and reveals the increase in application efficiency after the 1st irrigation due to the increase in the root zone and a decrease in the water infiltration rate in the soil.
Figure 10. The direction of the curves for the efficiency of application to the fields A and B
After measuring and analyzing all the field work and the results obtained in this study, the following most important conclusions can be listed:
(1) The actual water application efficiency was evaluated for the Al-Ishaqi irrigation project, and low value of irrigation efficiency was obtained due to ineffective use and the inappropriate timings for irrigation. Irrigation efficiency can be improved through proper field planning and proper water management within the field.
(2) The field work that is currently taking place on the reclaimed land is still primitive, as it did not rise to the level of proper handling of the reclaimed land. The farmer still practices inherited traditional agriculture, which requires great effort and leads to a lack of benefit from land reclamation processes, and low irrigation efficiency, in addition to significant damage. Which are attached to irrigation networks, field drainage, and grading works.
(3) The results of the irrigation efficiency assessment conducted in the Al-Ishaqi Irrigation Project show that farmers are using water more than the actual water demand, and this leads to the loss of a large amount of water in the farms that were detected in this study, due to the unwise use, where the percentage of losses in fields A, and B was 38.6%, and 62.53%, respectively. If the current scenario continues, it is Groundwater will likely rise and the sustainability of the irrigation system will be threatened.
(4) Currently, the monthly or annual water shares supplied to the project are not based on actual needs or according to the designed water charges. But, instead, the water is supplied in such a way that it depends on the capacity of the main canal, and on the experience of the worker at other times of the year.
The author would like to express their gratitude to the Ministry of Water Resources, Iraq. For their assistance in completing this project.
|
F.C |
Field capacity (% by volume) |
|
P.W.P |
Permanent wilting point (% by volume) |
|
BMC |
Moisture content before irrigation (%) |
|
AMC |
Moisture content after irrigation (%) |
[1] Hommadi, A.H., Abidalla, W.A., Naser, A.S. (2021). Increasing the productivity and efficiency of water use by reserving water. International Journal of Design & Nature and Ecodynamics, 16(2): 185-189. https://doi.org/10.18280/ijdne.160208
[2] FAO (Food and Agriculture Organization). (1989). Guidelines for Designing and EvaluatingSurface Irrigation Systems: Irrigation and Drainage Paper. No. 45. FAO, Rome.
[3] Alcon, F., García-Bastida, P.A., Soto-García, M., Martínez-Alvarez, V., Martin-Gorriz, B., Baille, A. (2017). Explaining the performance of irrigation communities in a water-scarce region. Irrigation Science, 35(3): 193-203. https://doi.org/10.1007/s00271-016-0531-7
[4] Bos, M.G., Burton, M.A., Molden, D.J. (2005). Irrigation and Drainage Performance Assessment: Practical guidelines. CABI Publishing.
[5] Biswa, A.K. (1990). Monitoring and evaluation of irrigation projects. Journal of Irrigation and Drainage Engineering, 116(2). https://doi.org/10.1061/(ASCE)0733-9437(1990)116:2(227)
[6] Latif, M., Ahmad, F. (2008). Operational analysis of water application of a sprinkler irrigation system installed in a golf course: Case study. Journal of Irrigation and Drainage Engineering, 134(4): 446-453. https://doi.org/10.1061/(ASCE)0733-9437(2008)134:4(446)
[7] Webster, T.P. (2014). Extension Engineer. Irrigation system types and typical applications, ACAE Pub No 32, AGDEX. No. 563.
[8] Dumanski, J., Pieri, C. (2000). Land quality indicators: Research plan. Agriculture, Ecosystems and Environment, 81(2): 93102. http://dx.doi.org/10.1016/S01678809(00)00183-3
[9] da Silva, A.J.P., Coelho, E.F., de Miranda, J.H. (2013). The efficiency of water application of irrigation systems based on micro sprinkling in banana plantations. Scientific Agriculture, 70(3): 139-146. http://dx.doi.org/10.1590/S0103-90162013000300001
[10] Clemmens, A.J., Molden, D.J. (2007). Water uses and productivity of irrigation systems. Irrigation Science, 25(3): 247-261. https://doi.org/10.1029/2007WR006095
[11] Getnet, A. (2020). Evaluation of irrigation efficiency of Koga irrigation scheme, tana basin, Ethiopia. Water Resources Management. https://www.researchgate.net/publication/344296938_Evaluation_of_Irrigation_Efficiency_of_Koga_Irrigation_Scheme_Tana_Basin_Ethiopia.
[12] Ucar, Y., Senyigit, U., Kadayifci, A., Tuylu, G.I. (2010). Evaluation of water use efficiency at parcel and scheme levels: A case study of Sarkikaraagac irrigation scheme in Turkey. Journal of Food Agriculture and Environment, 8: 1046-1053. https://doi.org/10.1234/4.2010.1898
[13] AL Mosawi, M., Al Thamiry, H. (2022). Evaluation of Elaj Irrigation Project in Babil Governorate. Journal of Engineering, 28(8): 21-33. http://dx.doi.org/10.31026/j.eng.2022.08.02
[14] Abbasi, F., Sohrab, F., Abbasi, N. (2017). Evaluation of irrigation efficiencies in Iran. Irrigation and Drainage Structures Engineering Research, 17(67): 113-120. http://dx.doi.org/10.22092/aridse.2017.109617
[15] Shaikh, I.A., Wayayok, A., Abdullah, A.F.B., Soomro, A.M., Mangrio, M. (2015). Assessment of water application losses through irrigation surveys: A case study of Mirpurkhas Subdivision, Jamrao Irrigation Scheme, Sindh, Pakistan. Indian Journal of Science and Technology, 8(11): 1-15. http://dx.doi.org/10.17485/ijst/2015/v8i11/54103
[16] Hesam, M., Kiani, A.R. (2014). Evaluation of irrigation efficiency on some farms in golestan province. Iranian Journal of Irrigation & Drainage, 8(2): 336-343.
[17] Cone, V.M. (1917). The venturi flume. Journal of Agricultural Research, 9(4): 115.
[18] Musa, J.J., Mustapha, H., Yerima, I.Y., Kuti, I.A., Abogunrin, M.E. (2016). Evaluation of irrigation application efficiency: Case study of Chanchaga irrigation scheme. Environmental Science, Arid Zone Journal of Engineering, Technology and Environment, 12: 58-64.