Imene Djelamda* | Ilhem Bouchareb
© 2022 IIETA. This article is published by IIETA and is licensed under the CC BY 4.0 license (http://creativecommons.org/licenses/by/4.0/).
OPEN ACCESS
The most problem in electric vehicles is the detection of faults in the battery; in this paper we discuss a systematic data process for detecting and diagnosing faults in the battery and the application of the method of neural networks for the classification of the various faults of the Li-Ion battery dedicated to the electric vehicle. ; and for that we tried to create a fault classification algorithm using the neural network commands that exist in the MATLAB, we used the MATLAB/Simscape for battery modeling, the latter prepared physical models for use in different fields; and based on this model, we identified the battery parameters and we will apply some faults to classify them with neural networks; creating an algorithm takes a long time but when we use these commands we have to do the classification and the MATLAB gives us the algorithm., These algorithms have shown the efficiency of the application of pattern recognition to the diagnosis.
diagnostic, electric vehicle, Li-Ion battery, artificial neural networks
Artificial intelligence (AI) is a discipline which is based on concepts relating to the human being, scientific techniques already established and technologies of computers, electronics, automation [1, 2]. To design so-called intelligent systems, capable of dealing with difficult-to-solve problems in a manner similar to that which human would adopt [3, 4].
Currently, artificial intelligence techniques such as expert systems, fuzzy logic, genetic algorithms and artificial neural networks (ARNs) are widely used in many fields, such as regulation of industrial processes, processing of imaging, diagnostics, medicine, space technology, and computer data management systems [5-7].
ANNs, depending on their type, have several applications in industry. We can cite static diagnosis, dynamic diagnosis, prognosis, control and monitoring of industrial systems. The application of ANNs in the diagnosis is a kind of pattern recognition [8], where we associate with each failure the most probable cause. From an input vector containing the parameters of the system to be diagnosed as well as the signals from the sensors, we can have an output which indicates the state of the system [9, 10].
The lithium battery management of electric vehicles is essential and mandatory, and this from its conception in order not only to ensure a safe system, but also to be able to predict the performance and faults of the battery or elements.
The number of techniques used to predict battery performance and faults have grown exponentially, and as RNA is widely used in diagnostics, it will be introduced to diagnose faults in lithium-ion batteries [11].
Simscape allows the user to create their own physical components from those already present in the Foundation Library.
For this, we use the language of Simscape with which we program the mathematical equations governing the input and output signals of the component. Likewise, the parameters of the existing components can be configured according to the user's needs [12].
Simscape aids in the development of control systems as well as the testing of system-level performance. The Simscape language, which is based on MATLAB® and allows text-based writing of physical modeling components, domains, and libraries, can be used to generate unique component models. You can use MATLAB variables and expressions to parameterize your models, and Simulink to construct control systems for your physical system. Simscape provides C-code creation for deploying your models to different simulation environments, such as hardware-in-the-loop (HIL) systems [2, 13].
We got the idea from the example of cancer detection and classification using mass spectrometry data on protein profiles. Serum proteomic profile diagnostics can be used to differentiate samples from patients with and without disease. Profile models are generated using Surface-Enhanced Laser Desorption Ionization Protein Mass Spectrometry (SELDI). This technology has the potential to improve clinical diagnostic tests for cancerous pathologies [14].
The example already exists in the MathWorks documentations (MATLAB); in this work have found samples of the faults most influencing the performance and the accelerated degradation of the Li-Ion battery that they are classified in Ref. [15]; and we have made the application to some flaws in this work.
Using the MATALB / Simscape we have produced a lithium-ion battery model (equivalent to Thevenin's first order model).
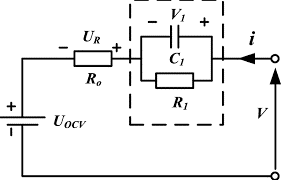
This equivalent model consists of a voltage source Uoc, a terminal resistance Ro, R0 in this case is equivalent to the sum of the series resistances of the solid and liquid phases, a dipole R1 // C1 (R1 the polarization resistance, C1 the polarization capacity-transient dynamics). Each of these circuit elements is a subsystem made up of custom electrical blocks and blocks to calculate the properties of the circuit element.
Figure 1 presents the equivalent model of the Li-Ion battery according to Thévenin's model.
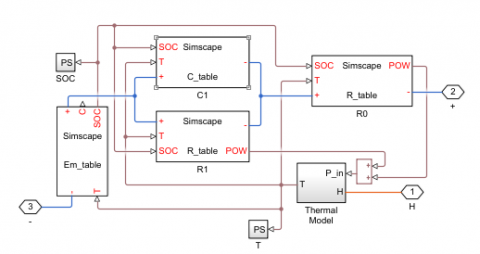
Building and parameterizing an equivalent circuit that depicts the battery's nonlinear behavior and dependence on temperature, SOC, SOH, and current is the first step in developing an accurate battery model. These dependencies are specific to each battery's chemistry and must be identified through measurements on battery cells of the same type as the controller is being designed for. MATLAB Central has example battery models accessible for download [16]; one of these models is the first-order Thevenin model presented in Figure 2.
Figure 1. Thevenin's first order Li-Ion battery model [17]
Figure 2. Li-Ion battery model in MATLAB/Simscape [18]
The voltages and currents of the model are regulated by the following equations:
$\dot{U}_{c 1}=\frac{U_{c 1}}{R_{1} C_{1}}+\frac{i}{C_{1}}$ (1)
$V_{t}=U_{o c}+V_{1}-R_{o} i$ (2)
where Vt is the voltage at the battery terminals, i is the Battery current, and $\dot{U}_{c 1}$ is the voltage drop at the R1C1 group terminals.
This example shows how to model a lithium cell using the Simscape™ language to implement the elements of an equivalent circuit model with one RC branch. For the validation of the defining equations.
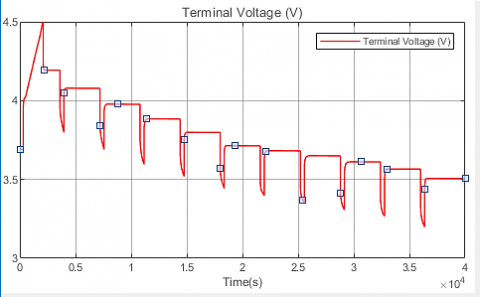
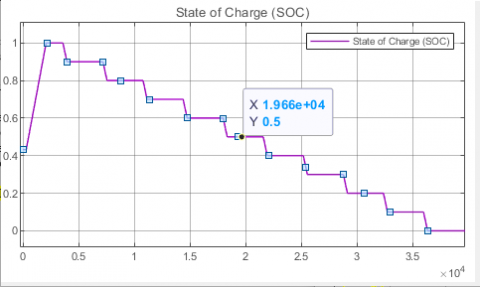
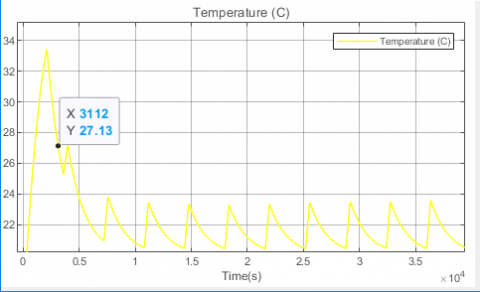
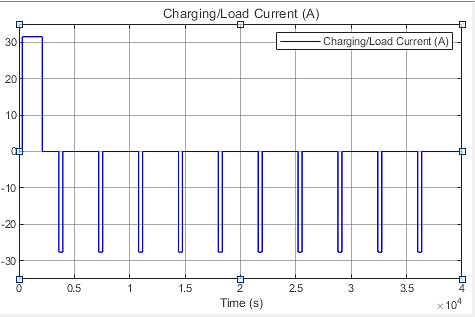
Figure 3. Li-Ion battery simulation results from MATLAB/Simscape [18]
The temperature of the battery is calculated using a basic thermal model. It is thought that convection is the primary mode of cooling, and internal resistance is the primary mode of heating. Multiple copies of the battery cell block can be connected in series to mimic a battery pack [12].
We used MATLAB/Simscape to model and visualize the performance of the lithium-ion battery, as previously stated.
Figure 3 gives us:
-the current imposed on the battery; which is in the form of pulses. When this pulse is applied to the battery, the latter begins to discharge, and when the current returns to zero, the battery enters the rest phase (relaxation).
- the voltage of the battery in open circuit, which is devised in two phases, the discharge phase and the relaxation phase. So, when a current pulse is applied to the battery, its voltage undergoes a drop which is due to the resistance Ro (internal resistance of the battery), and this is how the voltage decreases each time we apply a current pulse.
-the state of charge of the battery (SOC) which decreases each time a current pulse is applied, it decreases from 100% to 0%.
-the internal temperature of the battery in the healthy state, we see that with each pulse (discharge of the battery) the temperature increases, and during the relaxation phase the temperature decreases to 20℃, which is the temperature of the battery in healthy state [19].
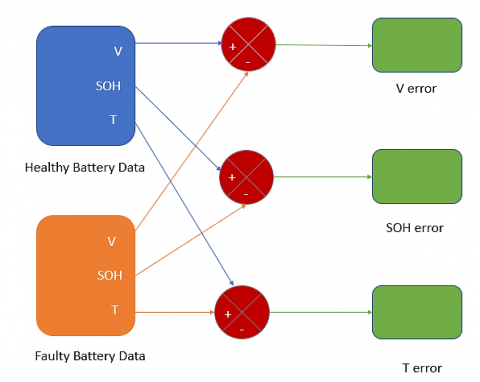
Figure 4. Block diagram intended for the generation of residues
Table 1. Parameters adjusted for each fault and their coding binary
|
Fault |
Adjusted parameter |
Binary coding |
|
Short circuit 30% |
R0 |
[1 0 0 0] |
|
Open circuit 30% |
R0 |
[0 0 0 1] |
|
Overload 30% |
Cp |
[0 0 1 0] |
|
High temperature 30% |
T |
[0 1 0 0] |
After identifying a few faults, we noted the errors between the output signals of the battery: the voltage (V), the state of charge (SOH) and the temperature (T) of the healthy system and that of the faulty system in order to use them in the classification of these faults by the method of neural networks. Figure 4 represents the generation of the residues; the error is the difference between the healthy case and the faulty case.
For the four faults that we have chosen, we will set the percentage of faults of the parameters adjusted to properly classify these faults as indicated in Table 1.
The network tune-up process has four steps, the first is the generation of residuals, but in this part, we will calculate the average values of current, voltage and power errors.
One hundred and twenty (120) samples were taken into consideration, such as 30 measurements for each defect (Table 2).
Table 2. The vectors of the mean values of the parameter errors
|
Parameter Fault |
Voltage (V) |
State of Charge (%) |
Temperature (C°) |
|
Short circuit 30% |
0 0 0 0.18379 0.18379 …. |
0 0 0 0 0 … |
0 0 0 0 9.94753e-14 …. |
|
Open circuit 30% |
0 0 0 0 0.612661 …. |
0 0 0 0 0.61266 ….. |
0 0 0 0 0.61266 …. |
|
Overload 30% |
0 0 0 0 -0.61266 …. |
0 0 0 0 0 0.61266 …. |
0 0 0 0 0 0.61266 ….. |
|
High temperature 30% |
0 -0.00112 -0.00220 - 0.00322 -0.00322 …. |
0 -4.0268e-5 -7.9304e-5 -0.0001159 -0.0001154 …. |
0 -2.75977 -5.43545 -7.94805 -7.94805 …. |
Figure 5. Defect detection and classification algorithm for a Li-Ion battery
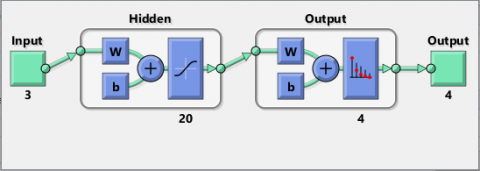
Figure 6. NN structure in MATLAB
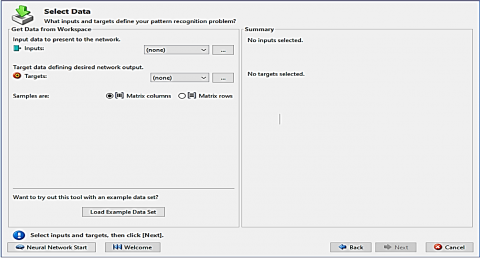
Figure 7. The nnstart command window
To make the correct classification of defects, we create a classification algorithm that presents the method of comparison between the different defects based on neural networks (Figure 5).
The second step is to create the database of our work with the collection of precedent measurements to classify the different defects, then we built the multilayer neural network (3-20-4), three (03) inputs in the input layer, twenty (20) neurons in the hidden layer and floor (04) neurons in the output layer (Figure 6).
The inputs are the mean values of the vectors of the voltage errors X1, the state of charge errors X2 and temperature errors X3. Of each type of fault (short circuit, open circuit, overload, high temperature).
The last step is learning the neural network.
Now that you have identified some important characteristics, you can use this information to classify the samples.
3.1 Implementation of the RNA structure under MATLAB
In this study we try to apply all the NN commands that exist in the MATLAB to classify the defects on one side and verify and ensure the results obtained.
We have t essential steps:
a- network creation with the command MATLAB nnstart (network learning with train) (Figure 7).
b- network test and validation (Figures 8-11).
c- hen we will test our model with the nntool command, which will allow us to create the network test for our model (Figure 12).
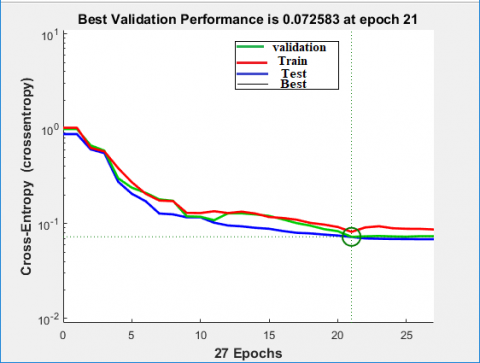
Figures 8 and 9 show the performance of the network during training; the performance is measured in terms of root mean square error and presented on a logarithmic scale; they are displayed for each of the training, validation and test sets.
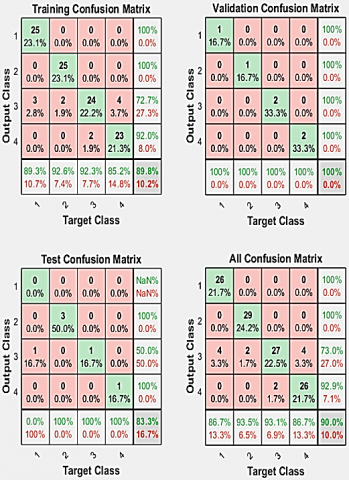
The confusion matrix in Figure 10 shows the percentages of correct and incorrect classifications.
Figure 8. Neural network training performance
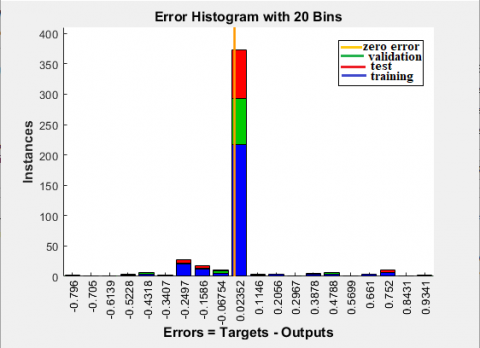
Figure 9. Neural network error histogram
Figure 10. Neural network training confusion
Short circuit "is 1 and open circuit is 2, overload is 3 and temperature high is 4. True classifications are indicated by green squares and false classifications are indicated by red squares. Gray squares indicate the overall rates (correction and error rate) of the classifications. White squares show conditional rates (correction and error rate) given a predetermined target (5th row) or given a predetermined output (5th column,). The percentages in the red squares are low, indicating few classification errors, so the network is precise.
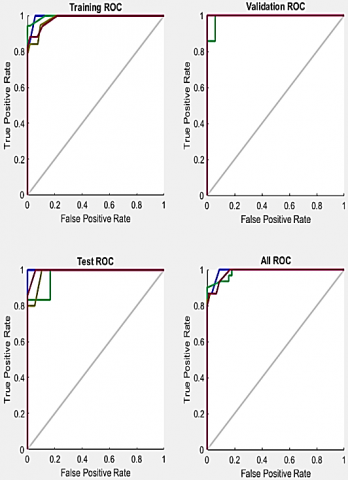
The Figure 11 present the plot of the operating characteristics of the receiver. This is another measure of the goodness of fit of neural network data is This graph shows how the false positive and true positive rates are related when the exit threshold varies from 0 to 1. in this plot we notice a line going from the lower left corner, to the upper left corner, to the upper right corner or nearby.
Figure 11. The receiver operating characteristic plot
Figure 12. Neural network data manager
You have to accept false positives to get a high true positive rate. Finally, and as long as we have checked our network; then it is ready to generate our algorithm or C ++ program to implement it in an electronic and Simulink model card based on the window below (Figure 12).
Artificial intelligence technology is helping to save human and material resources in the field of electrical automation control, but it also saves time. Artificial neural networks have a fundamental property which justifies the growing interest in them and which are capable of intervening in a wide variety of fields, and which distinguishes them from classical data processing techniques.
This example demonstrates how neural networks may be utilized as defect classifiers. To improve the performance of the classifier, you can also try using techniques such as principal component analysis to reduce the dimensionality of the data used for neural network training.
[1] Yang, L.B. (2020). Application of artificial intelligence in electrical automation control. Procedia Computer Science, 166: 292-295. https://doi.org/10.1016/j.procs.2020.02.097
[2] Simscape - MATLAB & Simulink – MathWorks. https://www.mathworks.com/products/simscape.html.
[3] Debbah, Y., Cherfia, A., Saadi, A. (2015). Application of the neural network method for the prediction of vibrations induced by combined faults (misalignment and unbalance). International Conference of Mechanics (ICM'15-2), Constantine, Algeria, pp. 320-327. https://www.asjp.cerist.dz/en/article/58414
[4] Zenati, A. (2012). High-level management and online monitoring of the state of health of lithium-ion batteries. thesis, University of Lorraine. https://hal.univ-lorraine.fr/tel-01750075/document.
[5] Djeriri, Y. (2017). Les Réseaux de Neurones Artificiels. Neural Network Applied to Power Quality Enhancement. https://www.researchgate.net/publication/319939107_Les_Reseaux_de_Neurones_Artificiels.
[6] Branštetter, P., Skotnica, M. (2000). Application of artificial neural network for speed control of asynchronous motor with vector control. In Proceedings of International Conference of Košice, EPE-PEMC, pp. 6-157.
[7] Promeo - Université de Picardie Jules Verne 2015-2016 LPro Automatisme et Robotique Phénomènes Dynamiques Engendrés par les Mouvements du Robot.
[8] Yan, L., Li, C.J. (1997). Robot learning control based on recurrent neural network inverse model. Journal of Robotic Systems, 14(3): 199-212. https://doi.org/10.1002/(SICI)1097-4563(199703)14:3%3C199::AID-ROB4%3E3.0.CO;2-M
[9] Msaaf, M., Belmajdoub, F. (2015). The application of feedforward neural networks in static diagnosis. Xth International Conference: Integrated Design and Production, Tangier, Morocco.
[10] Neural Networks-MathWorks. https://www.mathworks.com/discovery/neural-network.html, accessed on June. 17, 2020.
[11] Chen, C.T., Chang, W.D., Hwu, J. (1997). Direct control of nonlinear dynamical systems using an adaptive single neuron. IEEE Trans on Neural Networks, 2(10): 33-40.
[12] Thiria, S., Al, G.D. (2002). Réseaux de Neurones Méthodologie et Applications. Eyrolles, Paris.
[13] Wang, G.Q. (2014). Research on artificial intelligence technology of electrical automation control. In Applied Mechanics and Materials, 624: 469-472. https://doi.org/10.4028/www.scientific.net/AMM.624.469
[14] Kriegeskorte, N., Golan, T. (2019). Neural network models and deep learning. Current Biology, 29(7): R231-R236. https://doi.org/10.1016/j.cub.2019.02.034
[15] Hu, X., Zhang, K., Liu, K., Lin, X., Dey, S., Onori, S. (2020). Advanced fault diagnosis for lithium-ion battery systems: A review of fault mechanisms, fault features, and diagnosis procedures. IEEE Industrial Electronics Magazine, 14(3): 65-91. https://doi.org/10.1109/MIE.2020.2964814
[16] Power Eletronics Control Design with Simulink-MathWorks. https://www.mathworks.com/solutions/power-electronics-control/battery-models.html, accessed on May 8, 2021.
[17] Liu, K., Li, K., Zhang, C. (2017). Constrained generalized predictive control of battery charging process based on a coupled thermo electric model. Journal of Power Sources, 347: 145-158. https://doi.org/10.1016/J.JPOWSOUR.2017.02.039
[18] Huria, T., Ceraolo, M., Gazzarri, J., Jackey, R. (2012). High fidelity electrical model with thermal dependence for characterization and simulation of high power lithium battery cells. IEEE International Electric Vehicle Conference, pp. 1-8. https://doi.org/10.1109/IEVC.2012.6183271
[19] Bouchala, M., Tirichine, R. (2020). Diagnostic des défauts des batteries Lithium-ion à l’aide des réseaux de neurones. Projet Fin d’Études, ENPC.