Devianti* | Syahrul | Dian Kamisna | Agustami Sitorus | Dewi Sartika Thamren
© 2022 IIETA. This article is published by IIETA and is licensed under the CC BY 4.0 license (http://creativecommons.org/licenses/by/4.0/).
OPEN ACCESS
One of the most popular surface runoff estimation methods is the rational method. Unfortunately, this method has several concentration-time approaches that have been developed, as one of the parameters, which are specific to the environment to increase the accuracy of the runoff estimation. Therefore, this study aims to estimate surface runoff using a rational method with several concentration-time approaches in order to obtain the best accuracy in tropical palm dates plantations in Aceh Province, Indonesia. The concentration-time approaches studied were Kerby, Kirpich, Manning, Bransby Williams, Federal Aviation Agency (FAA), and Natural Resources Conservation Service (NRCS). This research was conducted by making a test plot in the plantation with the length, width, and slope of 22 m, 4 m, and 25%, respectively. Each side of the test plot is given a barrier plate with a height of 15 cm and embedded as deep as 30 cm. In addition, on the bottom side, there is a runoff collection tank with a capacity of 50 L. The physical properties of the soil on the test plots in the form of structure, texture, porosity, permeability, and organic C were granular, sandy loam, 0.43%, 1.84 cm/day, and 1.25%, respectively. The test was carried out from March to November 2020 with 37 days of rain. The results of this study indicate that there are significant differences between each concentration-time approach being tested. The best runoff estimation uses the Bransby William method in units of l/hr with the root mean square of 7.95.
Aceh, appropriate technology, palm dates, surface runoff
Palm dates plantation in the tropics is agricultural cultivation that tends to be new, especially in Aceh, Indonesia. Estimating runoff water discharge with precise accuracy from land, especially for new agricultural areas, is important to know to make the right land management decisions. The inaccuracy in the estimation can be a disaster from using the land for agricultural cultivation, especially in a tropical climate with high rainfall.
Methods for estimating surface runoff in agricultural land have been developed, including rational methods [1-3], conservation service soil-curve number (SCS-CN) [4-7], artificial neural network (ANN) [4], geographical information system (GIS) [8] and remote sensing (RS) [6, 8]. In this context, the ANN method is a black-box approach that prioritizes pattern recognition. This causes less traceability of the factors that affect the surface runoff numerically. In contrast, the rational method has the advantage that it is approached with an empirical equation in which the concentration-time can be optimized to produce higher accuracy. The concentration-time is obtained from the comparison between direct and estimated surface runoff measurements using empirical equations.
Estimation of concentration-time from rational methods that have been developed includes the Kerby approach [9], Kirpich [10], Manning’s [11], Bransby Williams [11], Federal Aviation Agency (FAA) [12], and Natural Resources Conservation Service (NRCS) [13]. To the best of our knowledge, investigations related to this concentration-time approach to the accuracy of runoff estimation by the rational method had not been carried out. Therefore, in this paper, we conduct a study related to the effect of these various concentration-time approaches on the accuracy of surface runoff estimates carried out on experimental plots in tropical palm dates plantations in Aceh Province, Indonesia. The level of accuracy of some of these methods uses the root mean square.
2.1 Site description
The experimental plot is located in the date palm plantation of PT. Lembah Barbatee, Blang Bintang District, Aceh Besar District, Aceh Province, Indonesia. The coordinates of the experimental plot are at 5.54°NL, 95.51°EL. Data collection was carried out from March to November 2020. The test was carried out on plots with length (L), width (W), and land slope (S) of 22 m, 4 m, and 25%, respectively. In the experimental plot, it is also known that the width of the channel bottom (b) and the depth of flow (y), which are designed, are 56.8 cm, 28.4 cm, respectively. Classification of soil types in the experimental plot area belongs to the order ultisol. The physical properties of the experimental plotted soil are presented in Table 1.
Table 1. Physical properties of the soil at the experimental site
|
Physical properties |
Value |
Unit |
Category |
|
Soil Porosity |
0.43 |
% |
Bad |
|
Soil Structure |
2 |
N/a |
Granular |
|
Soil Permeability |
1.84 |
cm/hr |
Slow |
|
Loam Sand Clay |
30 60 10 |
% |
N/a |
|
Texture |
- |
N/a |
Sandy loam |
|
C-organic |
1.35 |
% |
Low |
2.2 Analysis of surface runoff estimation data using the rational method
Estimation of surface runoff by the rational method can be calculated using Eq. (1) [11]. The influencing factors of this method are surface runoff coefficient (C), intensity of the rain during the concentration-time (I) (Eq. (2)), and catchment area of plot (A). Runoff coefficient (C), according to the rational method of this experimental plot, is the area of agriculture and plantations, which has a value of 0.4.
$Q=0.278\times C\times I\times A$ (1)
$I=\frac{{{R}_{24}}}{24}{{\left( \frac{24}{{{T}_{c}}} \right)}^{{2}/{3}\;}}$ (2)
The concentration-time (Tc) can be calculated using the Kerby (Eq. (3)), Kirpich (Eq. (4)), Manning (Eq. (5)), Bransby Williams (Eq. (6)), Federal Aviation Agency (FAA) (Eq. (7)) approaches, and Natural Resources Conservation Service (NRCS) (Eq. (8)). Each of these concentration-time approaches is generated through an empirical approach.
${{T}_{c}}=0.8275\times {{\left( L\times {{N}_{K}} \right)}^{0.467}}\times {{S}^{-0.233}}\,$ (3)
${{T}_{c}}=0.0078\times \left( \frac{{{L}^{0.77}}}{{{S}^{0.385}}} \right)\,$ (4)
${{T}_{c}}=\frac{L}{\left( 3600 \right)\times \left( {{S}^{{1}/{2}\;}} \right)\times \left( \frac{1.486}{{{N}_{M}}} \right)\times \left( {{\left( \frac{b\times y}{b+2y} \right)}^{{2}/{3}\;}} \right)}\,\,\,\,$ (5)
${{T}_{c}}=58.5\times L\times {{A}^{-0.1}}\times {{S}^{-0.2}}\,$ (6)
${{T}_{c}}=\frac{1.8\times \left( 1.1-C \right)\times {{L}^{0.5}}}{{{S}^{-0.333}}}\,$ (7)
${{T}_{c}}=0.0526\times {{L}^{0.8}}\times {{S}^{-0.5}}\times \left( \frac{1000}{{{C}_{N}}}-9 \right)\,$ (8)
where, Q-estimated runoff discharge (m3/s), C-runoff coefficient, I-average rainfall intensity (mm/hr), A-catchment area of plot (km2), R24-daily rainfall (mm), Tc-time concentration (hr), L-catchment area length of plot (m), NK-Kerby roughness coefficient, S-sloping land (%), NM- Manning roughness coefficient, b-channel bottom width (m), y-flow depth, CN-curve number.
Several parameters for determining the concentration-time (Tc) of this approach require the help of descriptive explanations of the experimental plots to obtain a coefficient. For example, the coefficient of surface roughness of the experimental plot according to the Kerby approach is presented in Table 2, and the value of the surface roughness coefficient of the experimental plot according to the Manning approach is shown in Table 3. Based on the table, the description that follows the Kerby approach's provisions is that the experimental plot is dominated by weeds, gardens, and a rough surface equal to (NK) 0.2. The description following the requirements of Manning's approach is soil, straight and uniform, and new clean that is equal to (NM) 0.018.
Table 2. Land surface roughness value based on Kerby
|
Area description |
Rough surface of Kerby (NK) |
|
Pavement |
0.02 |
|
Smooth, empty, compacted soil |
0.10 |
|
Weeds, gardens, rough surface |
0.20 |
|
Meadow |
0.40 |
|
Forest |
0.60 |
|
Thick grass, natural forest |
0.80 |
Table 3. Land surface roughness value based on Manning
|
Channel Type |
Rough surface of Manning (NM) |
|
Soil, straight and uniform, and new clean |
0.018 |
|
Clean has rotted |
0.022 |
|
Gravel |
0.025 |
|
Short grass, few nuisance plants |
0.027 |
The time of concentration (Tc) with the NRCS approach requires a parameter in the form of a curve number (CN) whose value depends on the soil texture and the type of land cultivation. The soil texture at the experimental plot location is sandy loam with poor land management, so that the curve number (CN) value is 68 [14].
2.3 Evaluation of models
Evaluation of surface runoff estimation model based on several concentration-time approaches is carried out by calculating the root mean square error (RMSE). Equation used to calculate the RMSE is presented in Eq. (9).
$RMSE=\sqrt{\frac{1}{n}{{\sum\limits_{i=1}^{n}{\left( x-y \right)}}^{2}}}$ (9)
3.1 Rainfall intensity and actual surface runoff
Rainfall and surface runoff during the study from March to November 2020 was 37 days (Figure 1). Total rainfall obtained during these nine months of observation was 681.18 mm. The average rainfall during this study was 18.41 mm per rainfall event. The highest rainfall occurred on November 26, 2020, at 60.0 mm and the lowest occurred on March 27, 2020, with a rainfall of 1.27 mm. In Figure 1, we observe that the trends of surface runoff and rainfall are consistent because rainfall is not the only thing that affects the occurrence of surface runoff. Other factors include soil physical properties, catchment area, sloping land, type and intensity of cover crops, and main vegetation.
The highest actual surface runoff occurred on November 26, 2020, at 2.36 mm and the lowest actual surface runoff occurred on May 9, 2020, at 0.11 mm. The highest and lowest actual surface runoff occurred in 60 mm and 3.18 mm rainfall conditions, respectively. The occurrence of surface runoff that occurs is closely related to rain on the day before and after in the experimental plot. The rain the previous day will cause the actual surface runoff to be greater the next day. This is due to the ability of the soil to infiltrate the amount of water that comes from the rain. This is in line with Pei et al. [15], which explains that the more frequently it rains, it will cause the ability of the soil to absorb water be lower in certain areas.
Figure 1. Rainfall and surface runoff during the study
3.2 Analysis concentration-time
Table 4. Concentration-time using six approaches
|
Concentration-time approach |
Concentration-time (Tc) (hr) |
|
Kerby |
2.2812 |
|
Kirpich |
0.1435 |
|
Manning |
0.0005427 |
|
Bransby Williams |
4317.4781 |
|
Federal Aviation Agency (FAA) |
3.7291 |
|
Natural Resources Conservation Service (NRCS) |
7.1038 |
The value of concentration-time (Tc) in the various approaches used to estimate surface runoff using the rational method is presented in Table 4. It can be seen that, from the six approaches to concentration-time, it can be seen that the concentration-time values differ significantly. The largest concentration-time was obtained on the Bransby Williams approach and the smallest on the Manning approach. This is due to the differences of each approach in formulating the empirical equation. Manning's equation produces a concise concentration-time because the empirical equation he builds is based on the water path length compared to the velocity of the water in overcoming. Meanwhile, the Bransby Williams concentration-time approach is based on an empirical equation that only includes the effect of track length, rain catchment area, and land slope.
3.3 Surface runoff estimation model
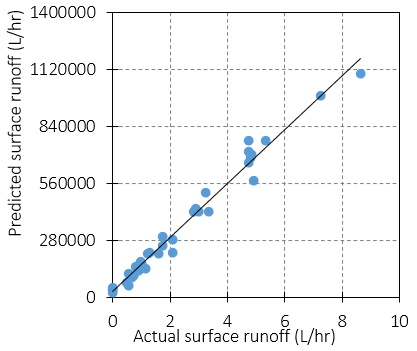
The surface runoff estimation model using the rational method with the Kerby concentration-time approach is presented in Figure 2. The relationship between the actual surface runoff and the estimated runoff with the Kerby concentration-time approach can be modeled into Eq. (10). The coefficient of determination (R2) of this model estimation is categorized as very strong to perform prediction equal to 0.98. However, root means square error (RMSE) in l/hr units of this model is 1694.01.
$S_{A}=\frac{S_{P}-98.70}{509.98}$ (10)
Figure 2. Prediction of surface runoff with Kerby concentration-time approach
Figure 3. Prediction of surface runoff with Kirpich concentration-time approach
The surface runoff estimation model using the rational method with the Kirpich concentration-time approach is presented in Figure 3. The relationship between the actual surface runoff and the estimated runoff with the Kirpich concentration-time approach can be modeled into Eq. (11). The coefficient of determination (R2) of this model estimation is categorized as very strong to perform prediction equal to 0.98. However, root means square error (RMSE) in l/hr units of this model is 10725.37.
$S_{A}=\frac{S_{P}-623.92}{3223.8}$ (11)
The surface runoff estimation model using the rational method with the Manning concentration-time approach is presented in Figure 4. The relationship between the actual surface runoff and the estimated runoff with the Manning concentration-time approach can be modeled into Eq. (12). The coefficient of determination (R2) of this model estimation is categorized as very strong to perform prediction equal to 0.98. However, root means square error (RMSE) in l/hr units of this model is 441669.33.
$S_{A}=\frac{S_{P}-25686}{132717}$ (12)
Figure 4. Prediction of surface runoff with Manning concentration-time approach
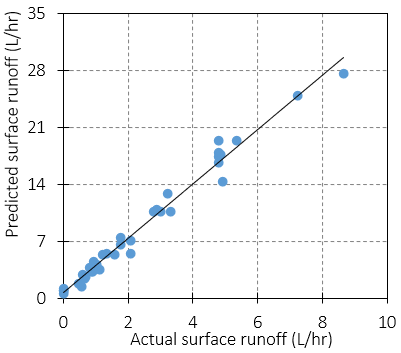
The surface runoff estimation model using the rational method with the Bransby Williams concentration-time approach is presented in Figure 5. The relationship between the actual surface runoff and the estimated runoff with the Bransby Williams concentration-time approach can be modeled into Eq. (13). The coefficient of determination (R2) of this model estimation is categorized as very strong to perform prediction equal to 0.98. However, root means square error (RMSE) in l/hr units of this model is 7.95.
$S_{A}=\frac{S_{P}-0.65}{3.33}$ (13)
The surface runoff estimation model using the rational method with the FAA concentration-time approach is presented in Figure 6. The relationship between the actual surface runoff and the estimated runoff with the FAA concentration-time approach can be modeled into Eq. (14). The coefficient of determination (R2) of this model estimation is categorized as very strong to perform prediction equal to 0.98. However, root means square error (RMSE) in l/hr units of this model is 1219.86.
$S_{A}=\frac{S_{P}-71.13}{367.5}$ (14)
Figure 5. Prediction of surface runoff with Bransby Williams concentration-time approach
Figure 6. Prediction of surface runoff with FAA concentration-time approach
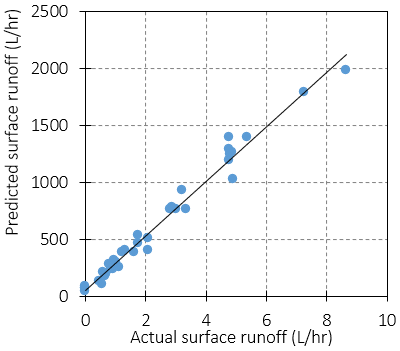
The surface runoff estimation model using the rational method with the NRCS concentration-time approach is presented in Figure 7. The relationship between the actual surface runoff and the estimated runoff with the NRCS concentration-time approach can be modeled into Eq. (15). The coefficient of determination (R2) of this model estimation is categorized as very strong to perform prediction equal to 0.98. However, root means square error (RMSE) in l/hr units of this model is 792.72.
$S_{A}=\frac{S_{P}-46.28}{239.15}$ (15)
Figure 7. Prediction of surface runoff with NRCS concentration-time approach
3.4 Discussion
From all runoff estimation models, which were analyzed using several concentration-time approaches, the coefficients of determination were not significantly different from one another. However, if we evaluate the RMSE value, we will find a significant difference between one model and another. The difference in the RMSE value is not to indicate that the model cannot predict according to the actual situation but rather to indicate a measure of accuracy that corresponds to the average between the actual runoff data and the predicted runoff. It can be seen that the Bransby Williams concentration-time approach produces a measure of accuracy that corresponds to the average between the actual runoff data and the smallest predicted runoff compared to the other approaches. This is in line with the results of research by Salimi et al. [12], who found a runoff prediction model similar to the results of this study.
The surface runoff prediction model using the rational method with the Bransby Williams concentration-time approach is more appropriate for the test area carried out. This test plot is located on a tropical date palm plantation in Blang Bintang District, Aceh Besar District, Aceh Province, Indonesia, at coordinates 5.54°NL, 95.51°EL. In general, the area of this plantation is 320 ha. If we recalculate using the model from the rational method with the time approach of the Bransby Williams concentration for maximum rainfall, the prediction of surface runoff in the area is about 18345.29 l/hr. This surface runoff value has been greater than the results of the study of Yang et al. [11], who suspected surface runoff in sugarcane farming areas. Therefore, anticipation with land management is important to pay attention to in cultivating palm dates in tropical areas.
The amount of surface runoff will impact the amount of erosion that will occur in the area. If proper land management is not carried out over a more extended period, this will lead to sedimentation around the river area close to the plantation. Land conservation efforts that can be carried out according to several research results for land conditions like this include providing terraces [16-18], use of cover crops [19-21] as well as an application of biopore holes on the land [22-24].
The analysis of the estimation of surface runoff using the rational method with several concentration-time approaches has been carried out. The observed concentration-time approaches are Kerby, Kirpich, Manning's, Bransby Williams, Federal Aviation Agency (FAA), and Natural Resources Conservation Service (NRCS). Estimation of runoff was carried out in the experimental plot of palm dates tropical plantations in Aceh Province, Indonesia, for nine months with 37 rainfall events. It is known that the Bransby William concentration approach with the rational runoff estimation method gives the smallest root mean square error compared to others for this area. In general, the estimation of surface runoff in this tropical palm date plantation area with this method and approach under conditions of maximum rainfall will produce runoff of 18345.29 l/hr. Land conservation efforts with large predictions of runoff that will occur are important, such as terrace applications, use of cover crops, and application of biopore holes. The future work of this research is to conduct regarding the best conservation methods that should be taken for the tropical date palm plantation area.
[1] Lei, T.W., Zhang, Q.W., Yan, L.J., Zhao, J., Pan, Y.H. (2008). A rational method for estimating erodibility and critical shear stress of an eroding rill. Geoderma, 144(3-4): 628-633. https://doi.org/10.1016/j.geoderma.2008.01.015
[2] Chen, N.S., Yue, Z.Q., Cui, P., Li, Z.L. (2007). A rational method for estimating maximum discharge of a landslide-induced debris flow: A case study from southwestern China. Geomorphology, 84(1-2): 44-58. https://doi.org/10.1016/j.geomorph.2006.07.007
[3] Hashemi, M.S.G.Z., Tajrishy, M., Jalilvand, E. (2020). The impact of pavement permeability on time of concentration in a small urban watershed with a semi-arid climate. Water Resources Management, 34(9): 2969-2988. https://doi.org/10.1007/s11269-020-02596-3
[4] Jayanti, D.S., Mulia, I., Sitorus, A. (2019). Model of surface runoff estimation on oil palm plantation with or without biopore infiltration hole using SCS-CN and ANN methods. IOP Conference Series: Earth and Environmental Science, 365(1): 012065. http://doi.org/10.1088/1755-1315/365/1/012065
[5] Satheeshkumar, S., Venkateswaran, S., Kannan, R. (2017). Rainfall–runoff estimation using SCS–CN and GIS approach in the Pappiredipatti watershed of the Vaniyar sub basin, South India. Modeling Earth Systems and Environment, 3(1): 24-32. https://doi.org/10.1007/s40808-017-0301-4
[6] Amutha, R., Porchelvan, P. (2009). Estimation of surface runoff in Malattar sub-watershed using SCS-CN method. Journal of the Indian Society of Remote Sensing, 37(2): 291-304. https://doi.org/10.1007/s12524-009-0017-7
[7] Dile, Y.T., Karlberg, L., Srinivasan, R., Rockström, J. (2016). Investigation of the curve number method for surface runoff estimation in tropical regions. JAWRA Journal of the American Water Resources Association, 52(5): 1155-1169. https://doi.org/10.1111/1752-1688.12446
[8] Gajbhiye, S. (2015). Estimation of surface runoff using remote sensing and geographical information system. International Journal of u-and e-Service, Science and Technology, 8(4): 113-122. http://dx.doi.org/10.14257/ijunesst.2015.8.4.12
[9] González-Álvarez, Á., Molina-Pérez, J., Meza-Zúñiga, B., Viloria-Marimón, O.M., Tesfagiorgis, K., Mouthón-Bello, J.A. (2020). Assessing the performance of different time of concentration equations in urban ungauged watersheds: Case study of Cartagena de Indias, Colombia. Hydrology, 7(3): 47. https://doi.org/10.3390/hydrology7030047
[10] Agunwamba, J.C., Mmonwuba, N.C. (2021). Comparative analysis of some existing models for estimating the time of concentration for watersheds in Anambra State, Nigeria. Journal of Engineering Research and Reports, pp. 64-75. https://doi.org/10.9734/jerr/2021/v20i517314
[11] Yang, X., Zhou, Q., Melville, M. (2000). An integrated drainage network analysis system for agricultural drainage management. Part 2: The application. Agricultural Water Management, 45(1): 87-100. https://doi.org/10.1016/S0378-3774(99)00068-2
[12] Salimi, E.T., Nohegar, A., Malekian, A., Hoseini, M., Holisaz, A. (2017). Estimating time of concentration in large watersheds. Paddy and Water Environment, 15(1): 123-132. https://doi.org/10.1007/s10333-016-0534-2
[13] Farran, M.M. Elfeki, A.M. (2020). Evaluation and validity of the antecedent moisture condition (AMC) of Natural Resources Conservation Service-Curve Number (NRCS-CN) procedure in undeveloped arid basins. Arabian Journal of Geosciences, 13(6): 1-17. https://doi.org/10.1007/s12517-020-5242-y
[14] Shaw, S.B., Walter, M.T. (2009). Improving runoff risk estimates: Formulating runoff as a bivariate process using the SCS curve number method. Water Resources Research, 45(3): 1-10. https://doi.org/10.1029/2008WR006900
[15] Pei, P., Zhao, Y., Ni, P., Mei, G. (2020). A protective measure for expansive soil slopes based on moisture content control. Engineering Geology, 269: 105527-105540. https://doi.org/10.1016/j.enggeo.2020.105527
[16] Murtilaksono, K., Ariyanti, M., Asbur, Y., Siregar, H.H., Sutarta, E.S., Yahya, S., Sudrajat, Suwarto, Suroso, Yusuf, M.A. (2018). Surface runoff and soil erosion in oil palm plantation of management unit of rejosari, PT Perkebunan Nusantara VII, Lampung. IOP Conference Series: Earth and Environmental Science, 196(1): 012002. https://doi.org/10.1088/1755-1315/196/1/012002
[17] Cerdà, A., Ackermann, O., Terol, E., Rodrigo-Comino, J. (2019). Impact of farmland abandonment on water resources and soil conservation in citrus plantations in eastern Spain. Water, 11(4): 824-839. https://doi.org/10.3390/w11040824
[18] Rodrigo-Comino, J., Seeger, M., Iserloh, T., González, J.M.S., Ruiz-Sinoga, J.D., Ries, J.B. (2019). Rainfall-simulated quantification of initial soil erosion processes in sloping and poorly maintained terraced vineyards-Key issues for sustainable management systems. Science of the Total Environment, 660: 1047-1057. https://doi.org/10.1016/j.scitotenv.2018.12.451
[19] Machado, A.C.Z., Zagatto, M.R.G., Neto, F.S., da Silva, S.A., Júnior, L.A.Z. (2022). Impact of crop management systems on soil nematode communities in south Brazil. Scientia Agricola, 79(1): 1-7. http://doi.org/10.1590/1678-992x-2020-0088
[20] López-Vicente, M., Calvo-Seas, E., Álvarez, S., Cerdà, A. (2020). Effectiveness of cover crops to reduce loss of soil organic matter in a rainfed vineyard. Land, 9(7): 230-246. https://doi.org/10.3390/land9070230
[21] Berihun, M.L., Tsunekawa, A., Haregeweyn, N., Meshesha, D.T., Adgo, E., Tsubo, M., Masunaga, T., Fenta, A.A., Sultan, D., Yibeltal, M. (2019). Exploring land use/land cover changes, drivers and their implications in contrasting agro-ecological environments of Ethiopia. Land Use Policy, 87: 104052. https://doi.org/10.1016/j.landusepol.2019.104052
[22] Devianti, Jayanti, D.S., Dewi Sartika, T. (2020). Analysis of surface runoff at oil palm plantation areas from the uses of bio-pore infiltration holes (BIH). International Journal of Scientific and Technology Research, 9(1): 3915-3918.
[23] Hanuf, A.A., Prijono, S., Soemarno, S. (2021). Improvement of soil available water capacity using biopore infiltration hole with compost in a coffee plantation. Journal of Degraded and Mining Lands Management, 8(3): 2791-2799. https://doi.org/10.15243/JDMLM.2021.083.2791
[24] Sindagamanik, F.D., Antaria, S., Karim, N.T., Hamdi, F., Asriany. (2021). The effect of pori hole distance variation on infiltration capacity in sandy clay soil sample drainage channels. Civil Engineering and Architecture, 9(3): 836-841. http://doi.org/10.13189/cea.2021.090325