Osama M. Al-Habahbeh
© 2022 IIETA. This article is published by IIETA and is licensed under the CC BY 4.0 license (http://creativecommons.org/licenses/by/4.0/).
OPEN ACCESS
Jordan is a dry country which badly needs water bodies. This work proposes a design of a sustainable artificial lake in Jafer basin (JB). The design involves excavating a tunnel to connect Gulf of Aqaba (GoA) and JB, and building a pumping station at the end of the tunnel. The tunnel will have a downslope gradient to allow gravity flow of seawater from GoA to JB. Once the water arrives underneath JB, a series of pumps along an inclined shaft uplift the water into the basin creating an artificial Lake, with total water volume of 2,000 Million Cubic Meters (MCM). The time required to fill up the basin is three years. The tunnel diameter is 3 meters and the depth of the tunnel and the shaft is 1000 m. 2% of the lake surface will be covered by Photovoltaic (PV) panels to produce electricity for pumping and to reduce evaporation rate. The total investment cost is 10.1 B$ (Billion Dollar) spent over three years, after that, all the pumping power needed to counteract evaporation is provided by PV panels. Once completed, the project is expected to pay back by encouraging human settlement, tourism, agriculture and industry.
artificial lake, downslope tunnel, gulf of Aqaba, Jafer basin, seawater transport, seawater tunnel, sustainable lake
Jafer Basin is an arid area with little population located in southeastern part of Jordan. It is a natural depression and seasonal rainwater reservoir. It is noted that the unique topography of the basin allows for the creation of a large lake, which can be beneficial in many ways; Holguin Pena et al. [1] reviewed the potential of growing saline crops in desert areas for food, fodder and biofuels production to meet human demand. AbuDalo et al. [2] assessed the characteristics of an artificial lake containing mixture of treated wastewater and rainwater to examine whether the nutrient loading is sufficient for fish culture. Due to the scarcity of fresh water in the country, the only option to create the lake is to draw seawater from the GoA, which can be done via an underground tunnel, so as not to disrupt the environment with a huge and long pipeline. One of the major obstacles to this idea is the high evaporation rate, which will require constant pumping of water into the lake. The evaporation problem can be solved by covering a small part of the lake with PV panels. These panels will produce the necessary power to pump enough seawater into the lake so as to compensate for evaporation, thus maintaining the water level. Moreover, the covering of part of the lake's surface results in reducing evaporation. Ikhennicheu et al. [3] presented three cases for floating solar PV farms, small, large and offshore. Steady magneto-hydrodynamic (MHD) flow of Seawater over a stretching sheet was investigated by Abourabia and Abdel Moneim [4]. Tunnels are not new in Jordan; more than 2,000 years ago, the Romans excavated large underground tunnel system extending from River Yarmouk to supply water to Decapolis cities [5]. Megdiche-Kharrat et al. [6] highlighted seven examples of historic hydraulic structures from different geographic contexts and connected their specifications to economic, social, political and environmental dimensions for good water governance. Al-Saqarat et al. [7] indicated that a network of freshwater sites such as Wadi Gharandal oasis in southern Jordan had been visited by humans during migration from Africa to the Levant.
Large-scale modification and manipulation of natural systems for the benefit of mankind were discussed by Schuiling et al. [8]. Important technical details for the design, construction and operation of seawater pumped storage systems (S-PSS) in conjunction with wind parks were presented by Katsaprakakis et al. [9]. Gomaa et al. [10] evaluated the degree to which pumping wells at Moghra aquifer will attract seawater to the aquifer system in the Egypt Western Desert region under different pumping conditions. The phenomenon of inter-basin water transfers was assessed by Gupta and Zaag [11] from a multi-disciplinary perspective. Badescu and Cathcart [12] described a comprehensive control strategy to partially recreate the Aral Sea. Jiang [13] used finite element analysis and field practice to study construction technology in coastal cities for TBM crossing strong rock formations and the emergency treatment for water inrush. Wang et al. [14] investigated water-swelling characteristics of two polymers used for shield tunnel sealing gaskets. Tokgoz [15] proposed the use of seawater and ultrasound wave energy as a ground conditioning agent in TBM operations instead of chemical foaming agent. Watson et al. [16] described the challenges that faced the construction of 2.9 km long 3.6 m dia water tunnel under New York Harbor. Zhang et al. [17] studied the wear behavior of TBM disc cutter under dry, water and seawater conditions. Al-Amoush and Rajab [18] conducted a geoelectrical survey to map lava tunnels in Al-Badia, Jordan.
A proposal to plumb freshwater from Amazon River to Africa via subsurface Transatlantic Aqueduct was offered by Badescu et al. [19]. An initial artificial Lake design was presented by Badescu et al. [20]; where they proposed a pipeline to bring seawater to Lake Eyre in Australia. In an effort to solve the sand dunes expansion problem in Africa, Badescu et al. [21] suggested bringing seawater from the ocean to the desert to fix the dunes by spraying them with seawater. Bonacci and Roje-Bonacci [22] studied the fluctuations in water levels at Baćina Lakes due to water evacuation through Krotuše tunnel to the Adriatic Sea. Goodwin et al. [23] investigated the formation of Lakes in Antarctica from Ocean flood events consisting from a mix of glacial meltwater and seawater. Lukman et al. [24] studied the pollution in Lake Toba in Indonesia, where water quality at the lake was classified according to pollution status. Abd Aziz et al. [25] identified water contamination in Cempaka Lake due to residential activities, clinics, restaurants and petrol stations.
The idea of transporting seawater from Aqaba was suggested in the Red Sea-Dead Sea canal project [26]. Mohsen [27] proposed pumping 2,130 MCM of seawater from Aqaba, to obtain an output desalted water of 530 MCM. Al-Taani et al. [28] investigated marine ecosystem and water quality at GoA. Al Hseinat et al. [29] evaluated the role of zero discharge policy at GoA in improving environmental conditions. Al-Absi et al. [30] investigated the levels of 16 trace and heavy elements in seawater for the first time in the northern GoA. Akash et al. [31] proposed conveying water "to Aqaba" instead of "from Aqaba". The idea is to generate hydropower from water flowing from Disi, at 840 m above sea level (ASL) to Aqaba at sea level, through a distance of 80 km. Greenbaum [32] explained how the growing demand for water in the south Levant region can be met by seawater desalination as well as water recycling for agriculture. Yazdandoost et al. [33] suggested lowering water consumption in arid regions as a more sustainable approach than seawater conveyance.
From the above discussion, it is noted that at the international level, much larger water transportation projects have been developed or proposed. While at the national level, water transport studies mainly focused on desalination as well as taking advantage of the difference in altitude to generate electricity. Despite the fact that the country badly needs water bodies and beaches; no studies have been proposed to develop artificial lakes in Jordan; Probably the reason is that most of the available depressions are either inhabited or cultivated, therefore, it is difficult to cover them with water. However, JB is the best candidate location to create an artificial lake; the main reason for that is that JB is a desert area empty of any life aspects, which makes the idea of covering it with water an appealing one. An extra benefit to the proposed tunnel is that seawater can be drawn from any point along the tunnel to be used for desalination plant to supply nearby towns and farms with fresh water.
This work presents a design of a sustainable artificial lake in JB. The proposed project comprises two major parts; a 140 km underground tunnel connecting GoA and JB and a series of pump stations positioned at the basin end of the tunnel. In order to avoid the deployment of pumping stations along the tunnel, which will be expensive to build and maintain, the tunnel is down sloped so as to induce gravity flow of water from Aqaba to Jafer. When seawater reaches JB, it will be deep underground, where a series of pumping stations is needed to lift the seawater up to the level of the basin. The pumped water will be discharged into the basin to create the artificial Lake. The total volume of water in the lake will be 2,000 MCM. It is assumed that the time needed to fill up the basin is three years. This work starts with a description of the tunnel-lake system, then the sustainable design of the lake is presented, followed by the cost estimation. Finally, the tunnel-shaft parameters are introduced, and conclusions are drawn.
The tunnel-lake system consists of the tunnel, lake and pumps, as well as specifications of the pumping power and the PV system. In this section the location and method of formation of the lake will be discussed, as well as the pumping requirements and water transportation using the tunnel. During the first three years of the project the pumping power is provided by PV panels and electric grid or by PV panels only, depending on the investment decision. Sustainability is verified by ensuring that the amount of power provided by the PV panels is enough to run the pumps after the lake is filled with water.
2.1 Location of the lake
The proposed tunnel-lake system is shown in Figure 1. Seawater intake is installed at GoA on the Red Sea (Point A). Points A and B are connected by a sloped-down underground tunnel to transport seawater. The tunnel extends in a straight line with a length of 140 km. The water discharge is installed at JB (Point B). However, due to the low depth of point B, equal to 1000 m below sea level (BSL), a series of pumping stations are needed at point B to uplift the water to the level of the lake. The artificial Lake created at JB (above Point B) has a total area of 250 km2. The alignment of the tunnel is shown in Figure 2. The tunnel starts at the Red Sea (Point-1) at sea level, and extends to Point-2 in JB, at -1000 m (BSL). An inclined shaft must be excavated at JB from point-3 to point-2 with a depth of 1,000 m BSL or 1,850 below ground level. A pipe is installed inside the shaft along with a series of pumps. In order to make the water lifting process from point-2 to point-3 easier, the shaft should be inclined. This way water can be pumped from the bottom to the top gradually using 10 pumping stations deployed along the shaft. Each pumping station will be equipped with a tank to facilitate pumping to the next station through the pipe.
Figure 1. Location of tunnel-lake system [34]
Figure 2. Tunnel and shaft alignment
The pumped seawater will be discharged into JB, which is located about 60 km from the city of Ma'an [35] and 6 km east of Jafer town. This flat white basin is a remote, quiet, uninhabited area, which accumulates rainwater from the surrounding mountains, while the floor of the basin is very hard and does not grow vegetation [36]. A plan of the basin is shown in Figure 3, where the proposed Lake is supposed to occupy the enclosed area. The lake area equals 250 km2, and the perimeter is 105 km. The lake takes this particular shape because it is enclosed by equal elevation perimeter of 858 m. The zone inside the enclosure is generally at an elevation of 850 m, whereas the zone outside the perimeter has an elevation higher than 858 m.
Figure 3. Plan of the proposed lake
2.2 Lake formation
In summer, the area is totally dry, whereas in winter, fresh waters flowing from the surrounding mountains accumulate in the basin. The annual direct rainfall (RB) on the basin is calculated as $R_{A} \times A_{B}$ where RA is the annual rate of rainfall in the area, equal to 32 mm/year [37] and AB is the area of the basin, equal to 250 km2. The resulting RB is 8 MCM/Year. The JB is located within a larger area called "Outer JB"; which has a circular shape with a diameter of 100 km and a total area of 7,366 km2. The mean elevation of the basin is 850 m ASL [38]. The basin is mostly bare land consisting of bare rock, gravel, basalt, boulder and hardpan areas. The area is characterized as hyper-arid zone [39]. The groundwater recharge in the basin takes place mainly in the outcrop area of the western highlands by infiltration of rainfall. Flood flow into the basin for wet year is 15 MCM/Year [40].
During the first three years of the project, which is the time required to fill up the lake, pumping power is provided using a mix of green PV power and traditional grid power. However, after the three years, pumping is only needed to compensate for evaporation, where the required power is provided using PV panels alone. This means there will be no further need for traditional power. This renders the lake sustainable. The area of PV panels needed to achieve this goal should be 2% of the lake's area. This amounts to 5 km2 of PV panels floating over the surface of the lake, and supplying the nearby pumping stations with power. The water body underneath the panels helps to cool down the PV panels, thus preserving their efficiency. When planning for pumping, it is not enough to consider the altitude of the floor of the basin, which is 850 m ASL. The proposed depth of the lake, which will be 8 m, must be added to the altitude of the basin, yielding a new altitude of 858 m ASL. The construction of the tunnel-lake system is divided into two phases; Phase-I; where tunnel, shaft and pumping stations are constructed, and Phase-II; where the basin is filled up with water.
2.3 Pumping requirements
The total water volume (Vw) needed to fill up the basin can be approximated by multiplying the basin area with the depth. The basin area (AB) equals 250 km2 [38], and the basin depth (DB) equals 8 m [41]. Therefore, the required water volume to create the lake is calculated as; Depth (8 m) × Area (250 km2) =2,000 MCM. The major part of the water used to fill up the basin will be the seawater pumped from Aqaba. Minor contributions come from flood and rain waters which add up to 23 MCM [37, 40]. It should be assured that after the Lake is created, the nearby Jafer town and the Airbase remain far from the water. Both places will be 3 m to 19 m above the Lake water level. In order to accurately calculate the volume of seawater that needs to be pumped into the basin, due attention should be paid to evaporation. The combination of high temperatures and low humidity in Jordan results in an extremely high evaporation rate. The long-term average rate is 80.2% of precipitation over the entire area of Jordan. Potential evaporation ranges between 1600 mm/y in the northern Highlands and more than 4000 mm/y in the southern and eastern desert [42]. Assaf and Kessler [43] suggested an annual evaporation rate of 280 W/m2 in GoA, which is equivalent to 1 cm/day of evaporation.
Using the above evaporation data, the average evaporation rate (ER) at the basin is taken as 3.83 m/y. Consequently, the volume of evaporated water is calculated by multiplying ER by the water surface area (AB =250 km2), which yields an annual evaporation amount from the surface of the Lake of 958 MCM. This amount is slightly reduced to 938 MCM due to the effect of the 2% PV cover. The contributions of the falling rain (=8 MCM/y) as well as incoming seasonal streams (=15 MCM/y) are accounted for as well. The required pumping flow rate into the lake is calculated as shown in Eq. (1). The calculated values are shown in Table 1; The annual pumping flow rate (QSW) during the first three years is 50 m3/s, whereas starting from the fourth year it will reduce to 29 m3/s. The latter quantity is necessary to compensate for the evaporated water. It is assumed that the time required to fill up the basin is three years. At the end of the three years, the seawater volume will be 2,000 MCM. Seawater pumping flow rate (QSW) in m3/s is calculated as:
$Q_{S W}=\frac{V_{S W}}{365 \times 24 \times 60 \times 60}$ (1)
where, Vsw is the required annual water volume in MCM. A summary of the basin filling plan and pumping requirements is shown in Table 1, where the data is specific for 2% PV cover.
Table 1. Basin filling plan and pumping requirements (2% PV cover)
|
Description |
Volumes in MCM |
Operation |
||||
|
1st Year |
2nd Year |
3rd Year |
4th Year |
Total |
||
|
Water volume of the Lake |
667 |
667 |
667 |
0 |
2,000 |
Add |
|
Evaporation from the Lake |
938 |
938 |
938 |
938 |
3,753 |
Add |
|
Flooding streams into Lake |
15 |
15 |
15 |
15 |
60 |
Subtract |
|
Direct rain into Lake |
8 |
8 |
8 |
8 |
32 |
Subtract |
|
Pumping needed into Lake |
1,582 |
1,582 |
1,582 |
915 |
5,661 |
--- |
|
Net water volume in the Lake |
667 |
1,333 |
2,000 |
2,000 |
--- |
--- |
|
Water depth in the Lake (m) |
2.7 |
5.3 |
8.0 |
8.0 |
--- |
--- |
|
Pumping rate into Lake (m3/s) |
50 |
50 |
50 |
29 |
--- |
--- |
2.4 Water transportation
Water transportation requirements are designated based on the basin capacity calculated in the previous section, which is 2,000 MCM. Pumping capacity should be large enough to fill up the volume of the basin within a reasonable time frame, which is assumed to be three years. During the three years, an annual capacity of 1,582 MCM must be pumped into the Lake, as shown in Table 1. However, for subsequent years, only 915 MCM must be pumped annually in order to make up for evaporation. In addition, fresh water enters the basin by direct rainfall as well as flooding from nearby mountains. The maximum required annual volume of 1,582 MCM/y must be used to design the pumping capacity.
The flow rate obtained by Equation 1 is used to specify the pumping capacity for the tunnel-lake system. The main parameters involved in the tunnel design are Length and Diameter. The length equals 140 km in a straight line, plus 1,850 m for the shaft. The most critical parameter which must be determined first is the tunnel diameter. Different diameters are investigated; from 1 m to 5 m. An important parameter derived from the flow rate in Eq. (1) is the speed of seawater in the tunnel. It is calculated as [20]:
$w_{S W}=\frac{4 Q_{S W}}{\pi D_{\text {tunnel }}^{2}}$ (2)
where, the water flow rate through the tunnel is QSW. The water transportation system includes gravity force inside the tunnel and a series of pumps inside the shaft where their main parameter is pumping power Ppump. Using the speed of seawater calculated in Eq. (2), the power needed to impel seawater within the pipe inside the shaft is given by Eq. (3):
$P_{\text {pump }}=g \rho_{S W} Q_{S W} H / \eta_{p}$ (3)
where, g is gravitational acceleration (=9.81 m/s2), ρSW is density of seawater (=1,030 kg/m3), H is hydraulic head and ηp is the efficiency of electric pump (=0.75). Hydraulic head consists of two parts; the tunnel and the shaft; the tunnel part runs from sea level to -1000 m, and the shaft part runs from -1000 m to 858 m. For the tunnel part, hydraulic head is calculated using Eq. (4) by subtracting the maximum depth of the tunnel BSL from the lost pressure height ΔH1 due to friction. For the shaft part, hydraulic head is calculated using Eq. (5) by summing the lost pressure height ΔH2 due to friction with the maximum elevation of the shaft ASL HShaft:
Hydraulic Head tunnel $=\Delta H_{1}-H_{\text {tunnel }}$ (4)
Hydraulic Head $_{\text {shaft }}=\Delta H_{2}+H_{\text {shaft }}$ (5)
The lost pressure height of the tunnel and the shaft is given by Eq. (6):
$\Delta H=\lambda \frac{\left(L_{\text {tunnel }}\quad+L_{\text {shaft }}\quad\right)\quad}{D_{\text {tunnel }}} \frac{w_{s w}^{2}}{2 g}$ (6)
where, Ltunnel is the tunnel length, Lshaft is the pipe length in the shaft, Dtunnel is the common diameter of the tunnel and the pipe in the shaft, and λ is coefficient of linear pressure loss, given by Eq. (7):
$\lambda=\left\{\begin{array}{c}\frac{1}{\sqrt[4]{100 R e}} \quad \text { for } R e<10^{5} \\ 0.0032+\frac{0.211}{R e^{0.237}} \text { for } R e>10^{5}\end{array}\right.$ (7)
Reynolds number is given by Eq. (8):
$R e=\frac{w_{s w} D_{t u n n e l}}{v_{s w}}$ (8)
where, vsw is kinematic viscosity of seawater (=1.26×10⁻⁶) m2/s. Using the power calculated in Eq. (3), the energy consumed with pumping Epump (kWh) is given by Eq. (9):
$E_{p u m p}=3 \times 365 \times 24 \times P_{p u m p}$ (9)
3.1 PV panels
Panels of PV cells are used to power the pumps. The average daily solar irradiance in Jordan is Gday =8 kWh/m2 [44]. The average yearly solar irradiance is given by Eq. (10):
$G_{\text {year }}=365 G_{\text {day }}$ (10)
The energy produced per unit surface area by PV cells during one year, EPV, year is given by Eq. (11):
$E_{P V, y e a r}=A_{P V} G_{y e a r} \eta_{P V}$ (11)
where, APV is the area of the PV panels and ηPV is PV cell yearly average efficiency, which is taken as 0.15 [45]. In sizing the area of the PV power plant, the Earth surface-level solar irradiance is used to calculate the collector surface area in order to match the power specifications of the pumping system. The area that should be covered by PV panels is given by Eq. (12):
Table 2. Characteristics of tunnel depths
|
Tunnel/Shaft depth (m) |
PV Coverage (%) |
PV coverage (km2) |
Flow rate in the first 3 years (m3/s) |
Flow rate after the 3 years (m3/s) |
Flow pressure in the 1st 3 years (atm) |
Flow pressure after the 3 years (atm) |
|
0 |
5 |
12.5 |
49 |
28 |
84 |
30 |
|
500 |
4 |
10 |
50 |
28 |
35 |
-20 |
|
1,000 |
2 |
5 |
50 |
29 |
-13 |
-69 |
|
1,500 |
1 |
2.5 |
50 |
29 |
-62 |
-118 |
|
2,000 |
1 |
2.5 |
50 |
29 |
-112 |
-168 |
$A_{P V}=E_{p u m p, y e a r} / G_{y e a r} \eta_{P V}$ (12)
where, Epump,year is the energy consumed per year with pumping. In the most feasible case, APV should cover 2% of the lake's area. This percentage provides partial green energy supply during the first three years and full power supply for subsequent years, where PPumping =PPV. During the first three years, the PV energy shortfall is supplemented by traditional power from the grid, denoted by ETraditional, and given by Eq. (13):
$E_{\text {Traditional }}=E_{P u m p}-E_{P V}$ (13)
where, EPV is the energy produced by PV panels over the same time period. The 15% efficiency of the PV panels provides 150 watts per square meter [45]. Sustainable pumping starting from the fourth year can be achieved for different tunnel/shaft depths using different PV coverage ratios, as shown in Table 2. It is also noted that the required pumping rate in the 5% case is less than the 1% case because more lake's area is covered and consequently there will be less evaporation. The choice of the tunnel depth is based on the data presented in Table 2; where a tunnel depth of 1000 m must be selected; because if a smaller depth is selected, e.g. 500 m, the flow pressure will be positive during the first three years. This means there will be a need for pumping stations to be deployed along the 140 km tunnel. On the other hand, if more depth is selected, e.g. 1500 m, there will be high negative flow pressures all the time, this pressure must be harvested for energy and this requires installing turbines which will add to the cost and complexity of the system.
3.2 Sustainability verification
Sustainability is verified by ensuring that the PV power is enough to maintain pumping after the three years, which is the time needed to fill up the basin. The verification was done for the five considered tunnel depths mentioned in Table 2. It is noted that all of them (except the case of zero depth) provide negative flow pressure, which means no pumping is needed in the tunnel, and the flow is driven by gravity. However, pumping is still needed in the shaft using a mix of traditional and PV power during the first three years, and using PV alone after that. The indicated PV covered areas ensure the sustainability of the lake for different tunnel depths.
The total development cost includes excavating the tunnel and the shaft, building the pumping stations, installing the PV panels and pumping the required water volumes. During the first three years, the pumped water is used to fill up the Lake to the desired level. Therefore, it is considered part of the development cost. However, starting from the fourth year, the required water pumping will be less as it will be used just to compensate for evaporation, and it will be completely powered by PV panels. The cost ctunnel of the conducting tunnel is calculated by Eq. (14):
$c_{\text {tunnel }}=c_{\text {tunnel, } 1} \times L_{\text {tunnel }}$ (14)
where, ctunnel,1 is the cost of unit length of the tunnel and Ltunnel is the total length of the tunnel. Likewise, the cost cshaft of the shaft is calculated using Eq. (15):
$C_{\text {shaft }}=C_{\text {shaft,1 }} \times L_{\text {shaft }}$ (15)
where, cshaft,1 is the cost of unit length of the shaft and Lshaft is the total length of the shaft. The unitary cost depends on multiple factors, such as tunnel diameter Dtunnel and lining. The cost of pumping installation, Cpumps, is calculated using Eq. (16):
$c_{\text {pumps }}=c_{\text {pumps, } 1} \times P_{\text {pump }}$ (16)
where, cpumps,1 is the cost of a pump unit power and Ppump is the required pumping power. The cost of a pump of unit power for a regular quality pump is 800 USD/kW. The water transportation system transmits seawater from point 1 to 3 as shown in Figure 2. The mean speed of seawater in a tunnel of diameter Dtunnel is defined by Eq. (17):
$w_{s w}=\frac{4 Q_{s w}}{\pi D_{t u n n e l}^{2}}$ (17)
where, Qsw is volumetric flow rate. The cost of pumping energy consumption is calculated by multiplying the energy cost (0.15 US$/kWh) [46] by the total required pumping energy. Therefore, the cost of energy for the 3 years, cpumping is given by Eq. (18):
$c_{\text {pumping }}=0.15 \times E_{\text {pump }}$ (18)
The cost of the PV panels cPV is obtained from Eq. (19) using the cost per Watt of the PV cells, cPV,W, and the total installed power PPV:
$c_{P V}=c_{P V, W} P_{P V}$ (19)
The current cost of PV panels is around 3.0 USD/W for thin film cells [47]. This means the cost of the PV plant will be 3,000 US$/kW. The cost of the traditional energy consumed during the three years, cTraditional is obtained using Eq. (20):
$c_{\text {Traditional }}=E_{\text {Traditional }}\quad c_{\text {Traditional }, 1}$ (20)
where, cTraditional,1 is the cost of unit energy, equal to 0.15 US$/kWh. Finally, the total investment cost cinvest for tunnel, shaft, pumping installations, PV panels and pumping energy is given by Eq. (21):
$c_{\text {invest }}=c_{\text {tunnel }}+c_{\text {shaft }}+c_{\text {pumps }}+c_{P V}$$+c_{\text {pumping }}$ (21)
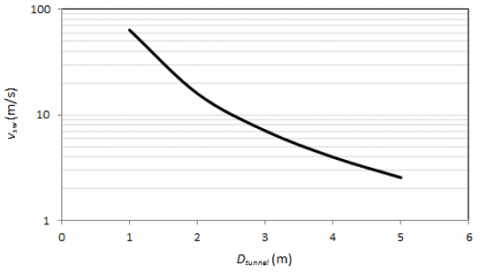
The preceding equations are used to investigate the flow characteristics for different tunnel diameters. Seawater velocity versus tunnel diameter for a tunnel depth of 1000 m BSL is shown in Figure 4. This chart can help to select diameters which provide acceptable values of flow speed. The pumping power as a function of tunnel diameter is shown in Figure 5; it is noted that the power starts to stabilize for diameters larger than 3 m, while small diameters require very high power. A similar behavior is noted in Figure 6, where the annual pumping energy is plotted as a function of tunnel diameter. There are two curves in Figure 6; The dotted one represents the total pumping energy, while the solid one represents the traditional portion of pumping energy. The difference between the two equals the PV energy. It is noted that the PV contribution increases as the diameter increases. This is because less total power is needed for larger diameters, while the PV portion is fixed. This means the traditional power must be reduced, which is desirable. However, larger diameters incur higher construction costs.
Figure 4. Seawater velocity vs. tunnel dia. (Depth=1000 m)
Some basic flow parameters for a tunnel depth of 1000 m BSL are shown in Table 3. A tunnel diameter of 3 m is selected for the tunnel-lake system. the corresponding flow velocity (wsw) for this diameter is 7 m/s. However, after the three years, the velocity will reduce to 4 m/s. This will limit the levels of noise and vibration. As shown in Table 3, the Hydraulic head (H) is positive for tunnel diameters smaller than 3 m. This means if such diameters are selected, pumping stations must be installed along the tunnel, which will require excavating many deep shafts to install them and later maintaining them in their remote locations. On the other hand, if tunnel diameters more than 3 m were selected, the hydraulic head will have a high negative value; In addition to the impact on the structure, this energy will be wasted unless turbines are installed, which will add to the cost and complexity of the system.
Figure 5. Pumping power for 1000 m depth
For practical reasons, it is recommended that the cross sectional area of the shaft should be square or rectangular. A pipeline with the same diameter as the tunnel should run inside the shaft. The purpose of this arrangement is to create enough room for the pumping stations and the tanks along the shaft. The required pumping power in the shaft is shown in Table 3.
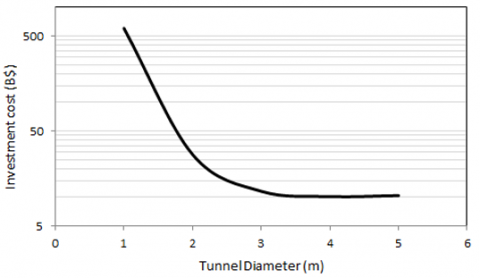
An estimate of the capital investment cost is given for multiple cases; The dependence of the total cost on tunnel diameter is shown in Figure 7; The cost decreases with larger diameters but stays almost constant for diameters greater than 3 m. All costs are incurred during the first three years of the project. After that, starting from the fourth year, pumping depends completely on PV cells, thus there is no incurred costs.
Figure 6. Pumping energy for 1000 m Depth
Table 3. Tunnel & shaft pipe parameters, Depth=1000 m BSL
|
Dtunnel (m) |
wsw (m/s) |
Tunnel Hydraulic Head (H) (m) |
Δp in Tunnel (atm) |
Tunnel Ppump (MW) |
Shaft Hydraulic Head (H) (m) |
Δp in Shaft (atm) |
Shaft Ppump (MW) |
|
1 |
63 |
181,770 |
18,389 |
122,106 |
4,284 |
43 |
2,878 |
|
2 |
16 |
5,218 |
529 |
3,505 |
1,941 |
19 |
1,304 |
|
3 |
7 |
-137 |
-13 |
-92 |
1,869 |
19 |
1,256 |
|
4 |
4 |
-787 |
-78 |
-529 |
1,861 |
19 |
1,250 |
|
5 |
3 |
-928 |
-93 |
-623 |
1,859 |
19 |
1,249 |
Table 4. Cost of tunnel-lake system, (Depth=1000 m BSL)
|
Dpipe (m) |
Traditional Pumping Power (MW) |
Cost of Pumping Energy (B$) |
Cost of tunnel & shaft (B$) |
Cost of Pumping stations (B$) |
Total cost (B$) |
|
1 |
297,673 |
260.8 |
2.1 |
100.0 |
440 |
|
2 |
10,821 |
9.5 |
2.8 |
3.8 |
19.8 |
|
3 |
2,132 |
1.9 |
3.5 |
0.9 |
7.7 |
|
4 |
1,078 |
0.9 |
4.3 |
0.6 |
6.9 |
|
5 |
850 |
0.7 |
5.0 |
0.5 |
7.2 |
Figure 7. Investment cost vs. tunnel dia. (Depth=1000 m)
Figure 8. Cost vs. tunnel diameter (Depth=1000 m)
Figure 9. Total cost vs. tunnel dia. for different depths
In Figure 8, the total cost is minimized for diameters greater than 3 m. In the same Figure, it is noted that both the pumping stations cost and the pumping energy cost decrease with increasing tunnel diameter. However, as expected, the cost of the tunnel and the shaft increases with tunnel diameter. On the other hand, the cost of PV panels remains constant and insensitive to tunnel diameter. The reason is that this cost is related to the percentage of PV cover on the lake's surface, which is designed to supply the required energy for sustainable pumping. Figure 9 shows the total cost versus tunnel diameter for different depths; It is noted that the cost is much higher for small diameters due to the high pressure loses. In addition, as the depth increases, the cost decrease. Figure 10 confirms the trend of decreasing cost with increasing depth for a tunnel diameter (Dtunnel) of 3 m. However, selecting depths more than 1000 m will produce high hydraulic energy which needs to be harvested and converted to electricity. This will add to the complexity, cost and risk at the discharge site. Moreover, as the shaft goes deeper, it would be more challenging to deploy the pumping stations. On the other hand, if less depth is selected the flow in the tunnel will not be natural (by gravity) and it will require pumping stations along the 140 km tunnel. Therefore, the selected depth is 1000 m.
The added traditional power and the cost of the tunnel-lake system are shown in Table 4 for a tunnel depth of 1000 m BSL. In order to maintain constant pressure inside the shaft, vertical separation between pumping stations is found by dividing the depth of the shaft below ground level (1,850 m) by the number of pumping stations inside the shaft (10), which results in 185 m. The contribution of PV power is constant at 750 MW.
Figure 10. Total cost vs. tunnel depth for Dtunnel =3 m
A preliminary design of a tunnel-lake system in southeastern Jordan is presented. The project entails transporting large quantities of seawater from GoA into JB using large tunnel, where the basin will become a seawater reservoir. A cost estimate is included in this work. The required seawater quantities include the volume needed to fill up the Lake as well as the quantities needed to compensate for evaporation. It is assumed that the time required to fill up the basin is three years; at the end of this period, the seawater volume in the Lake will be 2,000 MCM. The tunnel is downsloped so that water will flow by gravity from Aqaba to Jafer. Once the water reaches Jafer, it will be at a depth of 1000 m BSL. In order to bring the water up to the level of the lake, a shaft is used with 10 pumping stations equally distributed along the shaft in order to keep the pressure constant. The selected tunnel diameter is 3 meters. The investment cost includes the costs of tunnel, shaft, pumping stations, PV panels and pumping energy. The lead-time of the project depends largely on the productivity of the Tunnel Boring Machine (TBM), where employing two TBMs; one from each side, will reduce the lead-time by half. After the first three years, there is no cost to maintain water level because it is powered by PV panels. Further work is needed to investigate the possibility of reducing the cost of the project; For example, finding the optimum type of pumps for this application or reducing the cost of the tunnel using different materials for the lining. On the other hand, economic and environmental impacts of the project need detailed investigations. This work is limited to the engineering aspect of the project. However, there are other aspects which must be studied such as geological and environmental effects.
This work was conducted while on Sabbatical leave granted to the author by the University of Jordan.
|
AB |
Basin water surface area, km2 |
|
APV |
Area of PV panels, m2 |
|
B$ |
Billion Dollar |
|
cinvest |
Total investment cost, B$ |
|
cpumps,1 |
Cost of a pump unit power, $ |
|
cpumping |
Cost of pumping energy, $ |
|
cpumps |
Cost of pumping installation, $ |
|
cPV |
Cost of PV panels, $ |
|
cPV,W |
Cost per Watt of PV cells, $ |
|
cshaft |
Cost of the shaft, $ |
|
cshaft,1 |
Cost of unit length of the shaft, $ |
|
cTraditional |
Cost of traditional energy, $ |
|
cTraditional,1 |
Cost of unit energy, US$/kWh |
|
ctunnel |
Cost of the conducting tunnel, $ |
|
ctunnel,1 |
Cost of unit length of the tunnel, $ |
|
Dtunnel |
Tunnel diameter, m |
|
Epump |
Pumping Energy, kWh |
|
Epump,year |
Pumping energy per year, kWh/y |
|
EPV |
Energy produced by PV panels, kWh |
|
EPV, year |
PV Energy per unit surface area in one year, kWh/m2/y |
|
ER |
Average evaporation rate, m/y |
|
ETraditional |
Traditional power from the grid, kW |
|
g |
Gravitational acceleration, 9.81 m/s2 |
|
Gday |
Average daily solar irradiance, kWh/m2 |
|
Gyear |
Average yearly solar irradiance, kWh/m2 |
|
H |
Hydraulic head, m |
|
ΔH |
Lost pressure height due to friction, m |
|
HShaft |
Maximum elevation of the shaft, m |
|
Lshaft |
Total length of the shaft, m |
|
Ltunnel |
Total length of the tunnel, km |
|
MCM |
Million cubic meters, 106 m3 |
|
Ppump |
Pumping power, kW |
|
PPV |
Total installed power, US$/kW |
|
QSW |
Sea water volumetric flow rate, m3/s |
|
RA |
Annual rate of rainfall, mm |
|
RB |
Annual direct rainfall, mm |
|
Re |
Reynolds number |
|
RO |
Reverse osmosis |
|
Vsw |
Required annual water volume, MCM |
|
WSW |
Seawater flow velocity, m/s |
|
Greek symbols |
|
|
ηPV |
PV cell yearly average efficiency |
|
ρSW |
Density of seawater, 1,030 kg/m3 |
|
ηp |
Efficiency of electric pump, 0.75 |
|
λ |
Coefficient of linear pressure loss |
|
vsw |
Kinematic viscosity of seawater =1.26×10⁻⁶ m2/s |
|
Subscripts |
|
|
sw |
Seawater |
|
A |
Annual |
|
B |
Basin |
|
R |
Rate |
|
invest. |
Investment |
|
PV |
Photovoltaic |
|
W |
Watt |
|
p |
Pump |
[1] Holguin Pena, R.J., Medina Hernandez, D., Ghasemi, M., Rueda Puente, E.O. (2021). Salt tolerant plants as a valuable resource for sustainable food production in arid and saline coastal zones. Acta Biologica Colombiana, 26(1): 116-126. https://doi.org/10.15446/abc.v26n1.82412
[2] AbuDalo, M., El-khateeb, M., Ayadi, H., Al-Rahahleh, B., Jaradat, A., Guermazi, W. (2021). First assessment of water quality of an artificial lake for fish culture and irrigation: A case study of water reuse in water shortage area across the Middle East. Aquaculture Research, 52(3): 1267-1281. https://doi.org/10.1111/are.14985
[3] Ikhennicheu, M., Danglade, B., Pascal, R., Arramounet, V., Trebaol, Q., Gorintin, F. (2021). Analytical method for loads determination on floating solar farms in three typical environments. Solar Energy, 219: 34-41. https://doi.org/10.1016/j.solener.2020.11.078
[4] Abourabia, A.M., Abdel Moneim, S.A. (2019). Analytical solution of sea water steady magneto-hydrodynamic equations subjected to stretching sheet under induced magnetic field and heat transfer. Mathematical Modelling of Engineering Problems, 6(1): 141-151. https://doi.org/10.18280/mmep.060119
[5] Doering, M. (2009). Qanat Fir‘un– Documentation of the 100 Kilometers aqueduct tunnel in northern Jordan. Annual of the Department of Antiquities of Jordan, 53: 153-166.
[6] Megdiche-Kharrat, F., Zheng, X.Y., Moussa, M., Famin, Z., Angelakis, A.N. (2020). Historic hydraulic works: paradigms of traditional good water governance, integrity and sustainability. Water Science and Technology: Water Supply, 20(7): 2484-2498. https://doi.org/10.2166/ws.2020.146
[7] Al-Saqarat, B.S., Abbas, M., Lai, Z., Gong, S., Alkuisi, M. M., Abu Hamad, A.M.B., Carling, P.A., Jansen, J.D. (2021). A wetland oasis at Wadi Gharandal spanning 125-70 ka on the human migration trail in southern Jordan. Quaternary Research (United States), 100: 154-169. https://doi.org/10.1017/qua.2020.82
[8] Schuiling, R.D., Cathcart, R.B., Badescu, V. (2008). Aims, obstacles and potential stakeholders of macro-engineering projects. International Journal of Global Environmental Issues, 8(3): 207-223. https://doi.org/10.1504/IJGENVI.2008.018636
[9] Katsaprakakis, D.A., Christakis, D.G., Stefanakis, I., Spanos, P., Stefanakis, N. (2013). Technical details regarding the design, the construction and the operation of seawater pumped storage systems. Energy, 55(15): 619-630. https://doi.org/10.1016/j.energy.2013.01.031
[10] Gomaa, S.M., Hassan, T.M., Helal, E. (2021). Assessment of seawater intrusion under different pumping scenarios in Moghra aquifer. Egypt. Science of the Total Environment, 781: 146710. https://doi.org/10.1016/j.scitotenv.2021.146710
[11] Gupta, J., Zaag, P. (2008). Interbasin water transfers and integrated water resources management: Where engineering, science and politics interlock. Physics and Chemistry of the Earth. Parts A: Solid Earth and Geodesy, 33(2): 28-40. https://doi.org/10.1016/j.pce.2007.04.003
[12] Badescu, V., Cathcart, R.B. (2011). Aral Sea partial restoration. I. A Caspian water importation macroproject. International Journal of Environment and Waste Management, 7(1-2): 142-163. https://doi.org/10.1504/IJEWM.2011.037373
[13] Jiang, P. (2020). Research on the TBM tunnel passing through bad geological technology and water inrush emergency measures in reclamation area (Translated from Chinese). Journal of Railway Engineering Society, 37(12): 83-88.
[14] Wang, Z.N., Shen, S.L., Zhou, A., Lyu, H.M. (2020). Experimental investigation of water-swelling characteristics of polymer materials for tunnel sealing gasket. Construction and Building Materials, 256: 119473. https://doi.org/10.1016/j.conbuildmat.2020.119473
[15] Tokgoz, N. (2020). New technical combination of seawater and ultrasound wave energy for excavation of highly plastic sticky clays in urban EPB tunneling. Bulletin of Engineering Geology and the Environment, 79(6): 3195-32051. https://doi.org/10.1007/s10064-019-01720-x
[16] Watson, D., Lawrence, C., Essex, R., Shultz, M., Larsen, B. (2020). Design and construction of a water supply tunnel under New York Harbor, USA. Proceedings of the Institution of Civil Engineers: Civil Engineering, 173(4): 177-186. https://doi.org/10.1680/jcien.19.00041
[17] Zhang, X., Xia, Y., Zhang, Y., Tan, Q., Zhu, Z., Lin, L. (2017). Experimental study on wear behaviors of TBM disc cutter ring under drying, water and seawater conditions. Wear, 392: 109-117. http://dx.doi.org/10.1016/j.wear.2017.09.020
[18] Al-Amoush, H., Rajab, J.A. (2018). The use of electrical resistivity tomography to investigate Basaltic lava tunnel based on the case study of Al-Badia Cave in Jordan. Indonesian Journal on Geoscience, 5(2): 161-177. https://doi.org/10.17014/ijog.5.2.161-177
[19] Badescu, V., Isvoranu, D., Cathcart, R.B. (2010). Transatlantic freshwater aqueduct. Water Resources Management, 24(8): 1645-1675. https://doi.org/10.1007/s11269-009-9518-y
[20] Badescu, V., Cathcart, R.B., Paulescu, M., Gravila, P., Bolonkin, A.A. (2010). Chapter 89 Geo-Engineering South Australia: The Case of Lake Eyre, Macro-Engineering Lake Eyre with imported Seawater. In: Viorel Badescu, V., Cathcart R.B., eds. Macro-Engineering seawater in unique environments. Environmental science and Engineering (Environmental Engineering). Springer, Berlin, Heidelberg.
[21] Badescu, V., Cathcart, R.B., Bolonkin, A.A. (2008). Sand dune fixation: A solar‐powered Sahara seawater pipeline macroproject. Land Degradation & Development, 19(6): 676-691. https://doi.org/10.1002/ldr.864
[22] Bonacci, O., Roje-Bonacci, T. (2020). The impact of hydrotechnical interventions on the water regime of Baćina Lakes. Hrvatske vode, 28(114): 277-290.
[23] Goodwin, I.D., Roberts, J.L., Etheridge, D.M., Hellstrom, J., Moy, A.D., Ribo, M., Smith, A.M. (2018). Modern to Glacial age subglacial meltwater drainage at Law Dome, coastal East Antarctica from topography, sediments and jökulhlaup observations. Geological Society Special Publication, 461(1): 215-230. https://doi.org/10.1144/SP461.16
[24] Lukman, H., Subehi, L., Dina, R., Mayasari, N., Melati, I., Sudriani, Y. (2021). Loads of pollution to lake Toba and their impacts. International Journal on Advanced Science, Engineering and Information Technology, 11(3): 930-936. https://doi.org/10.18517/ijaseit.11.3.12733
[25] Abd Aziz, N.A., Toriman, M.E., Gasim, M.B., Muftah, S., Barggig, A., Kamarudin, M.K.A. (2017). Water quality deterioration in artificial lake: Their impact and sources. International Journal on Advanced Science, Engineering and Information Technology, 7(1): 49-56. https://doi.org/10.18517/ijaseit.7.1.1012
[26] Beyth, M. (2007). The Red Sea and the Mediterranean–Dead Sea canal project. Desalination, 214(1-3): 365-371. https://doi.org/10.1016/j.desal.2007.06.002
[27] Mohsen, M.S. (2007). Water strategies and potential of desalination in Jordan. Desalination, 203(1-3): 27-46. https://doi.org/10.1016/j.desal.2006.03.524
[28] Al-Taani, A.A., Rashdan, M., Nazzal, Y., Howari, F., Iqbal, J., Al-Rawabdeh, A., Khashashneh, S. (2020). Evaluation of the gulf of Aqaba coastal water, Jordan. Water, 12(8): 2125. https://doi.org/10.3390/w12082125
[29] Al Hseinat, M., Rasheed, M., Al-Rousan, S. (2020). Long-term quality record (1996–2018) of coastal sediments at the complex industrial site along the Jordanian coast of the Gulf of Aqaba. Environmental Monitoring and Assessment, 192: 443. https://doi.org/10.1007/s10661-020-08390-3
[30] Al-Absi, E., Manasrah, R., Abukashabeh, A., Wahsha, M. (2019). Assessment of heavy metal pollutants at various sites along the Jordanian coastline of the Gulf of Aqaba, Red Sea. International Journal of Environmental Analytical Chemistry, 99(8): 726-740. https://doi.org/10.1080/03067319.2019.1609459
[31] Akash, B.A., Al-Jayyousi, O.R., Mohsen, M.S. (1997). Multi-criteria analysis of non-conventional energy technologies for water desalination in Jordan. Desalination, 114: 1-12. https://doi.org/10.1016/S0011-9164(97)00148-3
[32] Greenbaum, N. (2020). Hydrology and water management in Israel and the southern Levant. Geographische Rundschau, 72(12): 24-29.
[33] Yazdandoost, F., Noruzi, M.M., Yazdani, S.A. (2020). Sustainability assessment approaches based on water-energy Nexus: Fictions and nonfictions about non-conventional water resources. Science of the Total Environment, 758. https://doi.org/10.1016/j.scitotenv.143703
[34] Royal Jordanian Geographic Center. (2020). Jordan Map. [online] Available at: http://rjgc.gov.jo/rjgc_site.
[35] Al Ra'i Newspaper. (2016). Article: Al-Jafer; Hidden South Magic. [online] Available at: http://alrai.com/article/1032053.
[36] Addustour Newspaper. (2014). Article: Wasted water in Al-Jafer Basin. [online] Available at: https://www.addustour.com/articles/143047.
[37] Kumar, A., Mozar, S. (2018). 500th Volume of LNEE. Proceedings of the International Conference on Communications and Cyber Physical Engineering. ICCCE, Springer. Hyderabad, India.
[38] Aljazy, A.D., Al-Nasrat, M.I. (2017). The history of Al-Jafer in Southern Jordan from the earliest times to the establishment of Bedouin Settlement Project (500,000 BC to 1962 AD). Jordan J History & Archaeology, 11(3): 103-129.
[39] Alzghoul, M., Al-Husban, Y. (2020). Topographic characteristics and estimation of the quantity of water harvesting in Al-Jafer Depression. JKAU/Arts and Humanities, 28: 455-473. https://doi.org/10.4197/Art.28-4.8
[40] Al Kuisi, M., El-Naqa, A. (2013). GIS based Spatial Groundwater Recharge estimation in the Jafr basin, Jordan – Application of WetSpass models for arid regions. Revista Mexicana de Ciencias Geológicas, 30(1): 96-109.
[41] Vivid Planet. (2020). Find Google maps coordinates. [Online] Available at: https://www.mapcoordinates.net/en.
[42] Gov. of Newfoundland & Labrador. (2010). Water Resources Management Division. Water Resources in Jordan: A Primer. [online] Available at: http://esystem.mutah.edu.jo/main/pubs/SfP984072_Primer.pdf.
[43] Assaf, G., Kessler, J. (1976). Climate and Energy Exchange in the Gulf of Aqaba (Eilat). Monthly Weather Review, 104(4): 381-385. https://doi.org/10.1175/1520-0493, 104<0381:CAEEIT>2.0.CO;2
[44] Alrwashdeh, S., Al-Saraireh, F., Saraireh, M.A. (2018). Solar radiation map of Jordan governorates. International Journal of Engineering & Technology, 7(3): 1664-1667. http://dx.doi.org/10.14419/ijet.v7i3.15557
[45] NREL. (2021). Solar Insolation Maps. [online] Available at: https://www.solar-electric.com/learning-center/solar-insolation-maps.html/.
[46] NEPCO. (2021). Electricity Tariff in Jordan. [online] Available at: https://www.nepco.com.jo/electricity_tariff_ar.aspx.
[47] Energysage. (2021). Smarter energy decisions. [online] Available at: https://news.energysage.com/how-much-does-the-average-solar-panel-installation-cost-in-the-u-s/.