Murtada S. Mohsin* | Nameer A. Alwash | Mohammed M. Kadhum
© 2022 IIETA. This article is published by IIETA and is licensed under the CC BY 4.0 license (http://creativecommons.org/licenses/by/4.0/).
OPEN ACCESS
The purpose of this study was to investigate and compare the structural behavior of the reinforced concrete beams contain out of plane parts with the straight beam by finite element analysis (FEA) using ABAQUS software package. The studied models were evaluated by comparing their results with previous experimental results of the research done by the same authors. The study focused on the effects of the number of the out of plane parts on the beams' mid span deflection, the cracking and ultimate loads, and failure mode. The obtained results showed that load bearing capacity of the beams with one, two, and three out of plane parts was lower than the capacity of the straight beam by about 35%, 33%, and 68%. In addition, the results of the beams with an even number of out of plane parts were generally better than the results of those with odd number, and the increasing number of out of plane parts changed the failure mode from flexure to combined flexure plus torsion. Finally, the FEM analysis was comparable with those obtained from the experimental procedures with an average difference ratio not exceeding 5% in the ultimate load and 7% in the deflection.
concrete beams, out of plane parts, normal strength concrete, experimental, FEM
Many of the recent architectural designs did not use straight structural members in buildings, especially in the facades of buildings such as balconies and ceilings, as well as inside buildings when it is necessary to obtain large spaces and reduce the number of columns and provide comfortable staircases. One of these applications is the zigzag beam (not straight) whose behavior has been studied in this research. This variation within the beam span led to a change the effect of loading state on the beam from bending plus shear to combined effect including torsion and change its structural behavior as compared with the straight member.
Owainati [1] investigated the effects of different loadings combinations of torsion, bending, and shear with the different torsion to shear ratio, and different ratios of transverse and longitudinal reinforcement on the structural behavior of reinforced concrete beams. The research concluded that cracks' shapes and failure mode were affected by the loading type and the increasing of the longitudinal and transverse reinforcement ratios were enhanced the cracking and failure loads, but the transverse reinforcement is more effective in increasing the cracking torsional moment. Ali and Anis [2] studied the effects of loading type on the structural behavior of the reinforced concrete floor to spandrel beam assembly.
Talaeitaba and Mostofinejad [3] investigated the behavior of fixed ends reinforced concrete beams under pure shear, pure torsion, and combined loading of shear plus torsion. The test results showed that the beam under pure shear has the highest ultimate load of all tested beams and the beam under combined shear plus torsion has the lowest bearing capacity. Kamiński and Pawlak [4] conducted experimental and numerical analyses to investigate the load capacity and stiffness of angular and straight beams. Qian and Li [5] adopted analytical and experimental work to study the behavior of reinforced concrete frames subjected to the loss of the ground corner column which represents corner panels. The study results showed that the loss of the corner column caused a progressive collapse of the frame and a plastic hinge developed at the beam end near the corner joint when using a moderate ratio of transverse reinforcement in the corner joint region.
Rafeeq [8] experimentally investigated the behavior of fixed ends reinforced concrete beams under the loading of bending plus shear and bending plus shear and torsion. The study explained that the torsional load is substantially reduced the beam load bearing capacity. Therefore, if the torsional loading is not considered in beam design or the beam has a deficiency in torsional reinforcement, it is necessary to strengthen the beam. Amulu and Ezeagu [9] was based on the standard design codes and experimental work to study the behavior of reinforced concrete beams under combined loadings of torsional moment, bending moment, and shear force. The study results concluded that the beam failure was due to the combined action of torsion, shear, and bending moment. Therefore, an increase in the capacity of the beams to resist the applied combined loads were as a result of the increased longitudinal and transverse reinforcements ratios. Prasad and Kumar [10] analyzed cantilever L-span rectangular reinforced concrete beams under torsional loading by experimental work and numerical analysis to study the effect of longitudinal and transverse reinforcement ratios on the behavior of the beams. The beams were reinforced to resist bending moment and did not reinforced to resist torsional moment.
Most of the current and previous researches focused on the structural behavior of the concrete beams under the effect of pure torsion or combined effect of shear force, bending moment, and torsion moment. Except those mensioned little researches delt with cantilever beam with bracket or angle beam no further studies are available about reinforced concrete beam with out of plane parts. As expected, this study is the first numerical investigation work on the structural behavior of beams with out of plane parts. The objective of this study is to investigate the differences in structural behavior between the straight beam and the beams containing out of plane parts, as well as the effect of the number of these out of plane parts. Therefore, a result was obtained proved that the classical method of design of straight beam needs to be modified including the torsional effect resulting from existing out of plane parts.
Nonlinear finite element analysis of reinforced concrete beam models of this study was performed using ABAQUS software packages (Version 2019), because of its ability to deal with the geometrical and material nonlinearities in FEM problems. The main items presented in this study are the functional units called modules analysis that consists of geometry and boundary conditions, element types, material properties, and nonlinear analysis solutions. The analyzed beams descriptions are explained in Table 1.
2.1 Geometry and boundary conditions
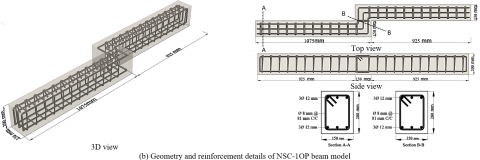
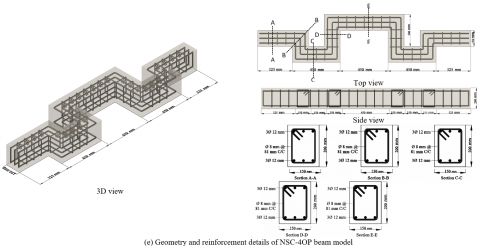
The beams geometry and their reinforcement that was applied in the numerical analysis and previous experimental work are shown in Figure 1.
Table 1. The beams label and their material hardened properties
|
Beam Symbols |
Refer to |
Material Hardened Properties |
||
|
Compressive strength, (MPa) |
Modolus of elasticity, EC (GPa) |
Poisons ratio |
||
|
NSC-S |
Normal Strength Concrete Straight Beam |
35 |
27.60 |
0.22 |
|
NSC-1OP |
Normal Strength Concrete Beam with One Out of Plane Part |
|||
|
NSC-2OP |
Normal Strength Concrete Beam with Two Out of Plane Parts |
|||
|
NSC-3OP |
Normal Strength Concrete Beam with Three Out of Plane Parts |
|||
|
NSC-4OP |
Normal Strength Concrete Beam with Four Out of Plane Parts |
|||
|
NSC-5OP |
Normal Strength Concrete Beam with Five Out of Plane Parts |
|||
Figure 1. Geometry and reinforcement details of beam models
In ABAQUS, the geometry of concrete beams, loading plate, and supports are defined as a 3D solid deformable extrusion type. The Longitudinal and transverse reinforcement is defined as a 3D deformable modeling space with a wire shape and planar type. The parts' geometry is shown in Figure 2.
The boundary conditions and loading were applied according to what was applied previously in the experimental work. The beams connection had a similar restrained boundary condition and loading procedure. The ends of the beams were connected by clamped steel members to restrained them against torsional moment, bending moment, and shear force. The beams were free in the axial direction but restrained vertically and laterally. The load was applied to the beams on the top faces by steel plates during the test. The models' parts assemble and their boundary conditions with loading are explained in Figure 3.
Figure 2. Models parts geometry
Figure 3. Loading and boundary conditions
2.2 Element types and interactions
Several attempts have been made to choose the element size for convergence requirements; an 8-nodes hexahedral element (C3D8R) with a uniform mesh size of 30 mm was chosen for the concrete elements, while the reinforcement bars were modeled using linear truss elements of 2-nodes (T3D2) with the same mesh size of concrete elements. The loading parts and supporting steel plates were also represented by (C3D8R) elements. The support parts were meshed with 10 mm and loading plate with 7.5 mm to avoid interaction problems at the contact regions between these parts and the concrete surface. An embedded perfect bond was assumed between the steel bars and concrete, while the interaction between the steel support and loading plate surfaces and the concrete surface was defined as a friction penalty type. The models' element meshes are shown in Figure 4.
Figure 4. Models element mesh
2.3 Material modeling
2.3.1 Concrete material
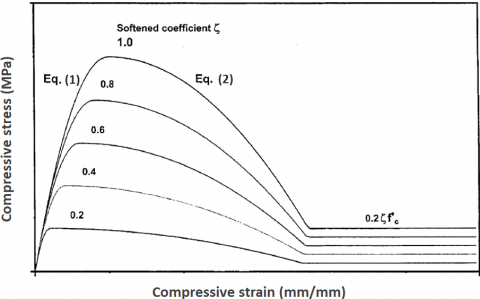
In contrast to steel reinforcement, concrete exhibits completely different behavior in compression and tension. To consider this phenomenon, ABAQUS supposes two failure mechanisms of the concrete material are tensile cracking and compressive crushing according to fundamental assumptions of damage plasticity (CDPM). The CDPM was introduced by Lubliner et al. [11], and was later developed by Lee and Fenves [12]. The behavior of concrete in compression was introduced in the CDPM according to the procedure of [13-16] is shown in Figure 5 and expressed as:
$\sigma_{c}=\zeta f_{\mathrm{c}}^{\prime}\left[2\left(\frac{\varepsilon_{c}}{\varepsilon_{c 0}}\right)-\left(\frac{\varepsilon_{c}}{\varepsilon_{c 0}}\right)^{2}\right] \frac{\varepsilon_{c}}{\zeta \varepsilon_{c 0}} \leq 1$ (1)
$\sigma_{c}=\zeta f_{\mathrm{c}}^{\prime}\left[1-\left(\frac{\varepsilon_{c / \zeta \varepsilon_{C 0}-1}}{\frac{4}{\zeta}-1}\right)^{2}\right] \quad \frac{\varepsilon_{c}}{\zeta \varepsilon_{c 0}}>1$ (2)
where, fc′ is the mean value of concrete cylinder compressive strength; εc0 is the concrete compressive strain at the maximum compressive stress (εc1=2fc′/Ec); ζ is the softened coefficient which can be taken as 0≤ζ≤1.
Figure 5. Compressive stress-strain curve of concrete
The compressive damage of concrete material required to be defined can be defined as a parameter dc. The concrete can behave as undamaged when this parameter value is zero and full-damaged material when its value is 1. Damage parameter can be defined in a tabular form by using Eq. (3) and if it is not specified, the model behaves as a plasticity model [17].
$d_{c}=1-\frac{\sigma_{c}}{f c^{\prime}}$ (3)
where, dc is the compression damage parameter, σc is the compression stress, and fc′ is the compressive strength of concrete.
The concrete stress–strain behavior in tension was defined according to [15, 18, 19] as explained in Eq. (4) and Eq. (5) and shown in Figure 6.
$\sigma_{t}=E_{c} \mathcal{\varepsilon}_{t} \quad \mathcal{\varepsilon}_{t} \leq \varepsilon_{c r}$ (4)
$\sigma_{t}=f_{\mathrm{cr}}\left(\frac{\varepsilon_{c r}}{\varepsilon_{t}}\right)^{0.4} \quad \varepsilon_{t}>\varepsilon_{c r}$ (5)
where, Ec is the modulus of elasticity of concrete; fcr is the cracking stress of concrete $\left(f_{c x}=0.31 \sqrt{f_{c}^{\prime}}\right)$, and εcr is the cracking strain of concrete $\left(\varepsilon_{c r}=\frac{f_{c r}}{E_{C}}\right)$.
Figure 6. Tensile stress-strain curve of concrete
The tensile damage of concrete material should be defined in CDPM, and it can be defined as a parameter dt. The tension damage defined according to ref. [19], and this could be expressed as follows:
$d_{c}=1-\frac{\sigma_{t}}{f_{t}}$ (6)
where, dt is the tension damage parameter, σt is the tension stress, and ft is the tensile strength of concrete.
2.3.2 Steel reinforcement material
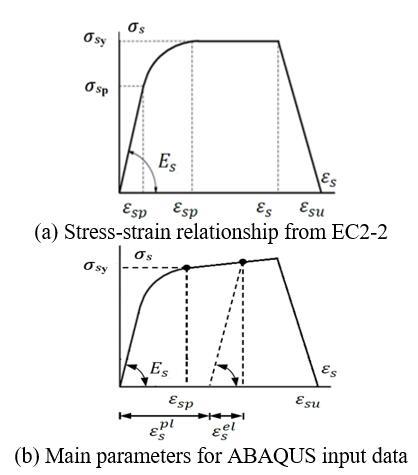
The reinforcement is defined as a steel material based on the experimental stress-strain results of the uniaxial tensile tests. The behavior was defined as an elastic linear strain hardening bilinear curve. The elastic behavior is defined by defining the longitudinal elasticity modulus of 200 GPa and Poisson’s ratio of 0.3. The plastic behavior is defined according to British Standards Institution [20] by true stress, σs, and true plastic strain, εspl, data pairs as follow:
$\sigma_{s}=\sigma_{n}\left(1+\varepsilon_{n}\right)$ (7)
$\varepsilon_{S}^{ p l}=\varepsilon_{S}-\varepsilon_{S}^{ e l}$ (8)
where, $\varepsilon_{s}=\ln \left(1+\varepsilon_{n}\right), \varepsilon_{S}^{e l}=\frac{\sigma_{S}}{E_{S}}, \sigma_{n}$ is the nominal stress, εn is the nominal strain, and Es is the steel modulus of elasticity.
Figure 7(a) and (b) show the true stress and true strain relationships and steel plastic behavior according to the code and according to ABAQUS input data.
Figure 7. Stress-strain behavior of steel reinforcement
2.3.3 Steel support and loading plate materials
Steel supports and loading plate parts were defined just in elastic behavior because it required only for loading and support, so there is no need to define plastic behavior. Elastic behavior defined by values of Poisson ratio (v) is 0.3 and the modulus of elasticity (Es) has 200 GPa.
2.4 Model calibration
The FEA required to do calibration for the CDPM model parameters like the viscosity (μ) and the dilation angle (c) in addition to mesh size selection for the convergence requirements. In implicit analysis programs. The constitutive model leads to severe convergence difficulties due to the materials softening behavior and its stiffness degradation. The use of a viscoplastic regularization of the constitutive equations is one of common technique to overcome some of these convergence difficulties (“ABAQUS online documentation server”). When modeling the CDP material in ABAQUS software, viscoplastic regularization can be considered by defining a viscosity parameter in material definitions. The default value of μ is zero in ABAQUS that corresponds to omission of viscoplastic regularization. If μ differs from zero, output results of the stiffness degradation and plastic strain refer to the viscoplastic values, viscous stiffness degradation variable and the viscoplastic strain rate tensor respectively. The viscosity parameter μ was found to have an effect on the yield load, as it is increase cause increase of the yield load. From the many attempts in this study, it was concluded that the μ of 0.009 was gave an excellent agreement with the experimental results.
Concrete is a brittle material and it experiences a great change in volume when it is in the inelastic strains. This criterion known as dilatancy is captured in CDPM by the dilation angle, ψ. The dilation angle in ABAQUS ranges between 0° to 56.3°. In this study, four values of the ψ were inspected (30, 31, 35 and 42). It was observed that the ψ of 35° was gave acceptance results as compared with the experimental results.
The mesh convergence was done by do inspection on using four different element sizes were nominated (15, 20, 30 and 40 mm). These values were selected such that it is larger than the aggregate size used (12 mm) and small enough to prevent complexities of hourglassing and distortion in C3D8R elements [21]. However, the element size of 30 mm was found to be more acceptable for saving the analysis time and post processing, and also the number of elements-central deflection response has no significant difference in the each other at this mesh size.
2.5 FEA results
The results obtained from the numerical analysis by ABAQUS for all tested beams include extensive data that describes the beams behavior during all loading stages up to failure. Results include crack pattern, first crack load, failure load, failure deflection, and load-deflection curve. The following table summarizes the results obtained from the numerical analysis of the four beams.
2.5.1 General behavior and crack patterns
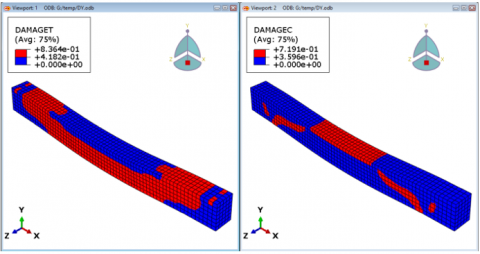
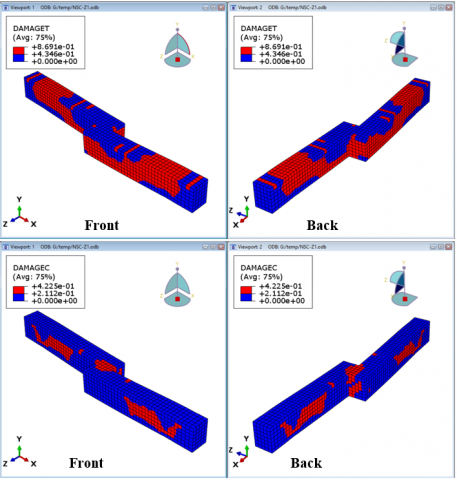
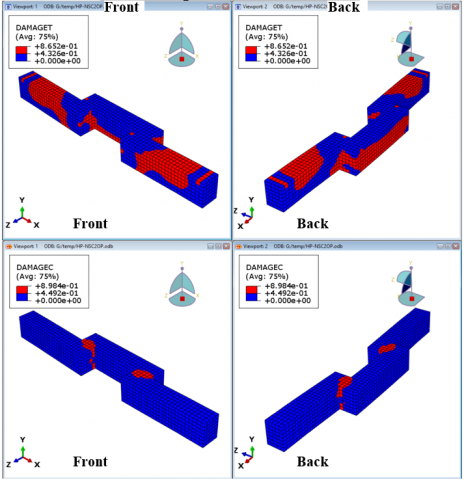
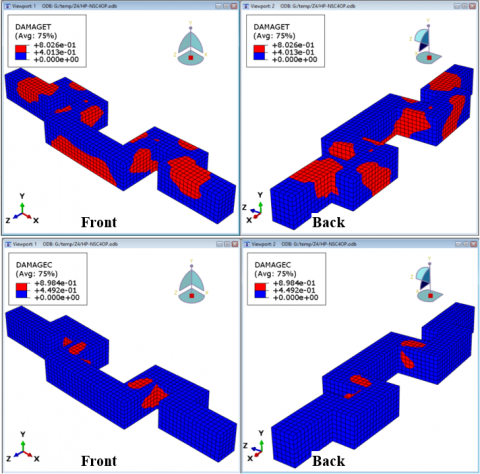
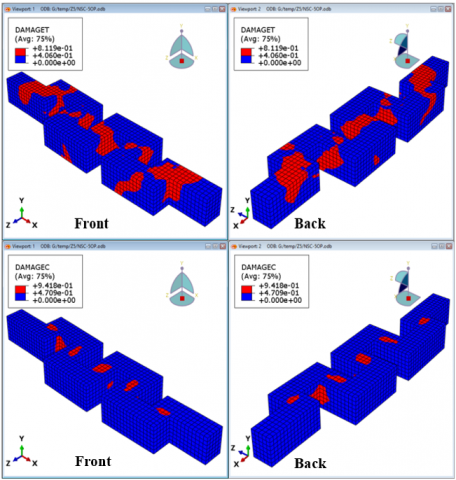
The crack patterns of the analyzed beams at the ultimate load are shown in Figure 8. The cracks in the FEA classified into two types, first one is the tension stress cracks that represented by DAMAGET, and the second one is the compression stress cracks that represented by DAMAGEC. The beam color is blue and cracking signs are observable with a red color.
(a) Crack patterns of NSC-S
(b) Crack patterns of NSC-1OP
(c) Crack patterns of NSC-2OP
(d) Crack patterns of NSC-3OP
(e) Crack patterns of NSC-4OP
(f) Crack patterns of NSC-5OP
Figure 8. FEM cracks patterns at failure for the analyzed beam models
In NSC-1OP the torsional cracks became visible at the interior corners of the out of plane part then followed by vertical flexural and inclined torsional cracks below the point load and inclined torsional cracks at the shear span, then finally flexural cracks at the support. In NSC-2OP the first cracks appear at the interior corner of out of plane parts then flowed be vertical flexural cracks at mid span and at last, the negative moment cracks started at the supports. In NSC-3OP the torsional cracks were started at the out of plane parts and below the point load, and then followed by the combined torsional and flexural cracks at the supports. The cracking and ultimate load of the FEA and experimental and comparison between them are listed in Table 2.
Table 2. Comparing numerical to experimental results
|
Beam |
NSC-S |
NSC-1OP |
NSC-2OP |
NSC-3OP |
|
First Crack Load (KN) |
||||
|
Numerical |
27.40 |
19.07 |
28.05 |
24.16 |
|
Experimental |
38.00 |
26.00 |
26.00 |
14.00 |
|
PFEA/PEXP % |
72.11 |
73.35 |
107.88 |
172.57 |
|
Failure Load (KN) |
||||
|
Numerical |
592.80 |
388.25 |
399.74 |
192.61 |
|
Experimental |
576.76 |
369.36 |
391.92 |
176.14 |
|
PFEA/PEXP % |
102.78 |
105.11 |
101.99 |
109.35 |
|
Mid Span Deflection (mm) |
||||
|
Numerical |
30.43 |
51.67 |
41.65 |
26.88 |
|
Experimental |
26.78 |
61.21 |
47.58 |
31.09 |
|
∆FEA/∆EXP % |
113.62 |
84.41 |
87.53 |
86.45 |
|
Point Load Deflection (mm) |
||||
|
Numerical |
24.70 |
36.16 |
37.48 |
18.36 |
|
Experimental |
22.14 |
31.26 |
35.63 |
25.99 |
|
∆FEA/∆EXP % |
111.56 |
115.67 |
105.19 |
70.64 |
2.5.2 Load-deflection curves
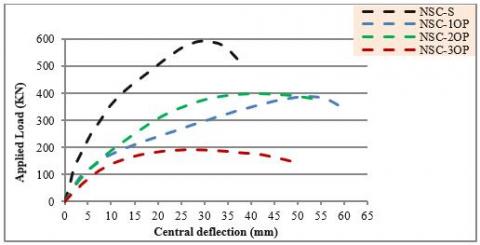
The mid span load-deflection curves of all the analyzed beams are shown in Figure 9. As the same behavior of experimental results, it can be seen that the FEA showed that the NSC-S beam has a highest ultimate load as compare with the beams with out of plane parts and less central deflection, and the NSC-2OP beam has ultimate load higher than the NSC-1OP and less deflection.
The NSC-S beam has an ultimate load higher than NSC-1OP, NSC-2OP, and NSC-3OP beam by 34.50%, 32.56% and 67.50% respectively. The mid span deflection of NSC-S beam was lower than NSC-1OP, and NSC-2OP beam by 41.10% and 26.93% respectively, and higher than NSC-3OP beam by 11.66%.
Figure 9. FEM Load and mid span deflection response of beam models
2.5.3 Deflected shapes
The deflected shapes of the FEA models are shown in Figure 10.
The mid span deflection of NSC-1OP and NSC- 2OP beams was higher than the NSC-S beam by about 41.10% and 29.93%, respectively, but the deflection of NSC-3OP was smaller by 11.66%. While these ratios at the point load were 31.69%, 34.09%, and 25.66%. The beams deflection at mid span is higher than the deflection at the point load by 18.83%, 30.01%, 10.01%, and 31.69% for NSC-S, NSC-1OP, NSC-2OP, and NSC-3OP beam respectively. This shape showed that the increasing number of the out of plane parts caused decreasing in the mid span deflection and made the deflected shape of the beams is close to the deflected shape of the straight beam.
Figure 10. FEM deflected shape of the beams
In general, the results of the numerical solution by ABAQUS compares very well with the experimental results that obtained by Mohsin et al. [22] for the same beams in regards to the load carrying capacity and failure mode. Minor differences in results between numerical and experimental models can be attributed to the boundary conditions, loading conditions, shortcomings in numerical material description, constitutive models, and numerical instability in modeling the cracks.
The load-deflection curves obtained from ABAQUS for all beams were plotted together with those of the experimental result as shown in Figure 11 to Figure 14.
Figure 11. Experimental and FEM Load-mid span deflection response of NSC-S beam
Figure 12. Experimental and FEM Load-mid span deflection response of NSC-1OP beam
Figure 13. Experimental and FEM Load-mid span deflection response of NSC-2OP beam
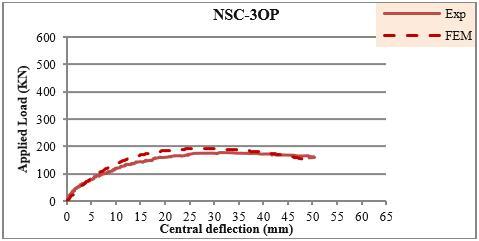
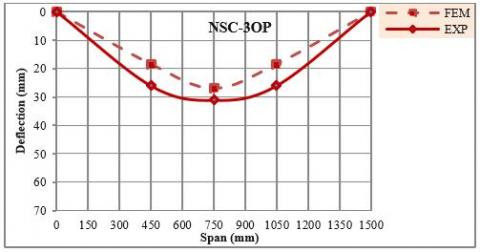
Figure 14. Experimental and FEM Load-mid span deflection response of NSC-3OP beam
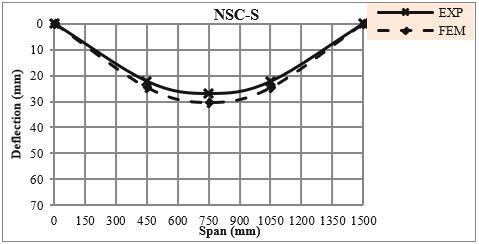
The deflected shapes that obtained from ABAQUS beam models were plotted against those of the experimental result as shown in Figure 15 to Figure 18.
Figure 15. Experimental and FEM analysis deflected shapes response of NSC-S beam
Figure 16. Experimental and FEM analysis deflected shapes response of NSC-1OP beam
Figure 17. Experimental and FEM analysis deflected shapes response of NSC-2OP beam
Figure 18. Experimental and FEM analysis deflected shapes response of NSC-3OP beam
Based on the results in Table 2 and the Figure 11 to Figure 18 for the analyzed beams, it can be seen that the FEA could foresee the experimental behavior of the beams fairly well. It captured the softening phenomena at first crack, major crack propagation, yield point, and just before complete failure, which was not very evident in the experimental results.
In this research, the nonlinear behavior of the beams with out of plane parts was investigated as compared with the straight beam and validated the FEA with the experimental results, furthermore the effects of number and locations of these out of plane parts and the direction of mid span part on the structural behavior.
A parametric study was carried on the beam NSC-4OP as compared NSC-2OP, and NSC-5OP as compared with NSC-3OP to study the influence of increasing the number of the out of plane parts in conjunction with the direction of mid span part to the beam axis on the overall behavior of the beams. Figure 19 showed the beams behavior.
Figure 19. FEM load and mid span deflection response of beam models
From Figure 18 it can be seen that the ultimate load and deflection of NSC-4OP is lower than NSC-2OP by 9.91% and 4.32% respectively, and ultimate load and deflection of NSC-5OP is lower than NSC-3OP by 6.13% and 14.50% respectively. The ultimate load and deflection of NSC-4OP is higher than NSC-3OP by 43.91% and 19.64% respectively. These results proved that the increasing number of the out of plane parts for the beams that classified according to the odd and even number of the out of plane parts led to decreasing load bearing capacity and deflection for each class, whether the direction of mid span part is perpendicular or parallel to the longitudinal beam axis.
Furthermore, the cracks propagation and failure mode were also affected by the increasing number of the out of plane parts, increasing number of the out of plane part led to decreasing tensile stress damage and increasing compressive stress damage.
The finite element analysis focused on the effect of the out of plane parts on the structural behavior of the beams with out of plane parts as compared with the straight beam that tested under static loads. The following are the most important notices for observed and recorded results:
(1) The results of the numerical analysis were comparable with the previous experimental results with an average differences ratio not exceeding 5% in the ultimate load and about 7% in the deflection, which help the researchers in studying beams with different configurations.
(2) The presence of out of plane part reduced the ultimate load of all the beams with out of plane part beam as compared with the straight beam by more than 30%.
(3) The beams with even number of the out of plane parts gave load bearing capacity higher than the beams with odd number of the out of plane parts.
(4) The flexural stiffness of the beams with out of plane parts decreased when the increased number of out of plane parts.
(5) The failure mode of beams with out of plane parts is combined flexural- torsional failure.
(6) The load bearing capacity and the structural behavior of the beams with out of plane parts was affected by the number and locations of the out of plane parts.
(7) Further studies can conduct on this problem in the future, such as continuous beams with out of plane parts, structural behavior of such beams as a part of reinforced concrete frames, and structural behavior of these beams under fire.
[1] Owainati, S.A.R. (1973). Behaviour of reinforced concrete beams under torsion, bending and shear. https://spiral.imperial.ac.uk/handle/10044/1/20540.
[2] Ali, M., Anis, A. (1983). Strength and behaviour of reinforced concrete spandrel beams. KB thesis scanning project 2015. http://hdl.handle.net/1842/12664.
[3] Talaeitaba, S.B., Mostofinejad, D. (2011). Fixed supports in assessment of RC beams’ behavior under combined shear and torsion. International Journal of Applied, 1(5): 119-126. http://www.ijastnet.com/journals/Vol_1_No_5_September_2011/15.pdf.
[4] Kamiński, M., Pawlak, W. (2011). Load capacity and stiffness of angular cross section reinforced concrete beams under torsion. Archives of Civil and Mechanical Engineering, 11(4): 885-903. https://doi.org/10.1016/S1644-9665(12)60085-5
[5] Qian, K., Li, B. (2013). Performance of three-dimensional reinforced concrete beam-column substructures under loss of a corner column scenario. Journal of Structural Engineering, 139(4): 584-594. https://doi.org/10.1061/(ASCE)ST.1943-541X.0000630
[6] ACI-ASCE Committee 445. (2013). Report on Torsion in Structural Concrete. American Concrete Institute of the Advancing concrete knowledge, no IR12. https://www.amazon.com/ACI-445-1R-12-Torsion-Structural-Concrete-ebook/dp/B00E4VDIV4.
[7] Elsayed, A.A., Noaman, M., Abdallah, M.A.M., Abdelrahim, M.A.A.(2015) . Behavior of R.C. beams with inclined cantilever. IOSR Journal of Mechanical and Civil Engineering, 12(4): 74-96. https://doi.org/10.9790/1684-12427496
[8] Rafeeq, R. (2016). Torsional strengthening of reinforced concrete beams using CFRP composites. Doctoral dissertation, Portland State University. https://doi.org/10.15760/etd.3121
[9] Amulu, C.P., Ezeagu, C.A. (2017). Experimental and analytical comparison of torsion, bending moment and shear forces in reinforced concrete beams using BS 8110, euro code 2 and ACI 318 provisions. Nigerian Journal of Technology, 36(3): 705-711. http://dx.doi.org/10.4314/njt.v36i3.7
[10] Prasad, N.N., Kumar, Y.N. (2017). Torsional behaviour of reinforced concrete ‘L’ beam. International Journal of Advanced Research in Basic Engineering Sciences and Technology (IJARBEST), 3(35): 159-164.
[11] Lubliner, J., Oliver, J., Oller, S., Onate, E. (1989). A plastic-damage model for concrete. International Journal of Solids and Structures, 25(3): 299-326. https://doi.org/10.1016/0020-7683(89)90050-4
[12] Lee, J., Fenves, G.L. (1998). Plastic-damage model for cyclic loading of concrete structures. Journal of Engineering Mechanics, 124(8): 892-900. https://doi.org/10.1061/(ASCE)0733-9399(1998)124:8(892)
[13] Zhu, R.R., Hsu, T.T., Lee, J.Y. (2001). Rational shear modulus for smeared-crack analysis of reinforced concrete. Structural Journal, 98(4): 443-450. https://www.concrete.org/publications/internationalconcreteabstractsportal/m/details/id/10287.
[14] Hsu, T.T.C. (1993). Unified Theory of Reinforced Concrete: Boca Raton: CRC Press. https://www.routledge.com/Unified-Theory-of Reinforced-Concrete/Hsu/p/book/9780367450137.
[15] Pang, X.B.D., Hsu, T.T. (1995). Behavior of reinforced concrete membrane elements in shear. Structural Journal, 92(6): 665-679. https://www.concrete.org/publications/internationalconcreteabstractsportal/m/details/id/9661.
[16] Zhang, L.X.B., Hsu, T.T. (1998). Behavior and analysis of 100 MPa concrete membrane elements. Journal of Structural Engineering, 124(1): 24-34. https://doi.org/10.1061/(ASCE)0733-9445(1998)124:1(24)
[17] Hafezolghorani, M., Hejazi, F., Vaghei, R., Jaafar, M.S.B., Karimzade, K. (2017). Simplified damage plasticity model for concrete. Structural Engineering International, 27(1): 68-78. https://www.tandfonline.com/doi/abs/10.2749/101686616X1081.
[18] Belarbi, A., Hsu, T.T. (1994). Constitutive laws of concrete in tension and reinforcing bars stiffened by concrete. Structural Journal, 91(4): 465-474. https://www.concrete.org/publications/internationalconcreteabstractsportal/m/details/id/4154.
[19] Hsu, T.T., Zhang, L.X. (1996). Tension stiffening in reinforced concrete membrane elements. Structural Journal, 93(1): 108-115. https://www.concrete.org/publications/internationalconcreteabstractsportal/m/details/id/9681.
[20] British Standards Institution. (2005). BS EN 1992-1-2. Eurocode 2: Design of concrete structures. Part 1-2: General rules — Structural fire design. BSI.
[21] Genikomsou, A.S., Polak, M.A. (2015). Finite element analysis of punching shear of concrete slabs using damaged plasticity model in ABAQUS. Engineering Structures, 98: 38-48. http://dx.doi.org/10.1016/j.engstruct.2015.04.016
[22] Mohsin, M.S., Alwash, N.A., Kadhum, M.M. (2021). Comparative study on structural behavior of reinforced concrete straight beam and beams with out of plane parts. International Journal of Engineering, Transactions A: Basics, 34(10): 2280-2293. http://dx.doi.org/10.5829/ije.2021.34.10a.09