Viviana Valsecchi* | Giuseppe Gibertini | Andrea Morelli
© 2022 IIETA. This article is published by IIETA and is licensed under the CC BY 4.0 license (http://creativecommons.org/licenses/by/4.0/).
OPEN ACCESS
The aim of this study is to investigate and quantify the aerodynamics advantage, the physiological and performance advantage produced by pacemaker drafting in the case of long endurance running. The experimental tests have been carried out in a wind tunnel, at submaximal effort two runners done a treadmill run test of five minutes at 4.72 m/s with the same air velocity. By comparison of physiological parameters with and without drafting, the decreasing due to the pacemaker effect was obtained. A CFD simulation is used to analyze aerodynamic effects in terms of drag and drag coefficient with and without drafting at a wind speed of 4.72 m/s. Results indicates that compared to the baseline (running alone), the drafting position show a decrease in drag (-9.73%) and drag coefficient (-9.73%). This reduction in aerodynamic drag also leads to the reduction of the following physiological parameters, as detected by the experimental tests: oxygen consumption (-5.46%), metabolic power (-5.48%), energy cost (-7.31%), produced carbon dioxide (-7.40%), minute ventilation (-5.44%), HR (-0.60%), blood lactate concentration (-16.66%), RPE (-13.89%). Results demonstrate that drafting has a significant effect on aerodynamics parameters, but also on physiological and performance variables in highly and medium trained athletes.
aerodynamics, CFD, drafting, energy cost, marathon, metabolic power, running
The main purpose of this study is to investigate the link between aerodynamics advantage and physiological responses with drafting at the velocity of endurance run. It is well known that a pacemaker or just another competitor running ahead in an attempt to minimize work required to overcome drag. In terms of physiology, the effect of drafting can reduce the oxygen consumption, energy cost and perceived exertion. Aerodynamic effects have been usually taken into account only for "fast" sports, as downhill skiing [1, 2], cross-country skiing [3, 4], cycling [5, 6]. Aerodynamic effects can be non-negligible also at relatively low speed, when looking for maximum possible performance. This is the case of marathon where the runners are rather slow (around 5.8 m/s for male top-level runners) but the race is so long that also a very small advantage can eventually produce a noticeable effect: in a long distance running it’s very important the conservation of the energy, especially toward the end of the competition. Long distance runners generally run at a constant speed throughout most of the race: race velocity range from 4.5 m/s to 6.5 m/s [7, 8].
The transition region between laminar and turbulent flow has been estimated to occur at speeds of about 4 m/s to 6 m/s for a cyclist [9] and considering the similarities in geometry and drag coefficients also runners [10].
A small percentage reduction in oxygen consumption could lead to an improvement in performance time [11-13]. Cavanagh [11] suggest that 2% improvement translate into a 2’30" gain in elite marathon race performance. Although the beneficial effect of pacemaker is known since time, there are few published studies regarding the effects of drafting during running. The first study about the pacemaker effects, including the contribution of air resistance, is a work done by Pugh [14]. Pugh carried out some tests in a climatic chamber, where an athlete ran at a constant speed of 4.5 m/s on a treadmill against winds of different speed. The effects of shielding have been studied by comparison of oxygen consumption of shielded running ("about 1 m behind his companion") and non-shielded running: a reduction in oxygen consumption was found for drafting running. Considering a wind speed of 6 m/s, a reduction in oxygen consumption of about 8% was found. The author obtains confirmation of these results through the measurement of the dynamic air pressure by positioning a Pitot tube at a height of 1.25 m in various positions - posterior and latero-posterior - compared to an athlete running on a moving belt with an air speed of 6 m / s.
The effect of the drafting is less if there is a lateral movement between the leader and the following athletes. Lateral displacements of 0.4 - 0.7 m lead an air resistance reduction of 4-80%, compared to 89-98% for runners directly behind the leading runner. Air pressure behind the runner was negative from 0.6 m and continues to decrease till 1 m, maximum tested distance.
The work of Pugh constituted an important starting point but, nevertheless, some important sources of uncertainty were present in this study, as the low flow quality and the non-accurate measurement of athletes’ distance.
Kyle and Davies [15, 16] observed the wind effects on running at various wind speeds, finding that in a calm day of air the energy cost necessary to overcome air resistance in the marathon at 5 m/s affects only 2%.
A further comparison available in the literature is found in a study conducted on cyclists [17]. Starting from the hypothesis that the vertical position on a bicycle approximate the body position of a runner, data were collected on a group of cyclists (one, two, three or four cyclists) while they travelled on an indoor track in upright position. By subtracting out the effects of rolling resistance and wind resistance on the bicycle, the air resistance of runner was estimated. Results shown that following an athlete running at 6 m/s, would improve running economy by 4.9% if positioned 1 m away.
Zouhal et al. [18] have shown that drafting can improve time of athletes running 3000 m. Time performance was significantly reduced according to RPE, while lactate concentration was significantly higher, oxygen consumption and HR were slightly increased. The tests consisted in a non-drafting 3000 m running and in a 3000 m running with drafting for the first 2000 m. The trials were performed at the anaerobic run velocity. Two pacers were positioned next each other and were asked to run as close to the tested runner as possible as during competition (around 2 m). All participants performed running session during a period of two months on the same outdoor track, with weather conditions quite constant and with no wind (< 1 m/s).
More recently Inoue et al. [19] presented the results obtained by wind tunnel tests with two small static runner models (height h = 0.29 m) suspended over a moving-belt. They found a drag reduction in the order of 50% for a back to back spacing of 0.69 h corresponding (for athletes 1.78 m tall) to 1.2 m. The tests were carried out at 10 m/s so that the model Reynolds number was just one third if compared with the case of a real marathon runner.
A very recent article by Beaumont et al. [20] presented a study on a group of three aligned runners. The study was carried out by means of numerical simulations and track running experiments. The simulations were executed by a runner alone and in a group of three, finding a 33% drag reduction on the trailing runner. The runners have been modeled as rigid bodies thus legs, and arms motion was not reproduced. The distance between each runner (chest to back) was 1 m. In the indoor track tests the effect of drafting was evaluated comparing the oxygen consumption of an athlete running alone and behind two other ones. These two tests have been performed by only one subject in two different days, while running at submaximal 1000 m effort on a 200 m indoor track.
The run velocity varied less than 2% between each lap. The distance chest to back between the second and the third (trailing) runner was 1 m. An oxygen consumption reduction of about 6%, HR reduction of 1% and of the energy cost of 33% was found for the trailing runner at an average velocity of 5.88 m/s.
Despite the unquestionable importance of these results the test conditions could not be kept so constant and monitored so closely as in a modern wind tunnel test. For this reason, we decided to set-up an experiment in the wind tunnel of Politecnico di Milano.
2.1 Numerical method
Computational fluid dynamics - CFD - simulations purpose is to reproduce aerodynamic response related to the drafting running. Numerical method replicates experimental conditions of the wind tunnel tests described in the following part of the study. To evaluate the possible advantage during shielded run, results were compared, in terms of pressure, air velocity, aerodynamic resistance and drag coefficient, between the simulation with a single runner and with an athlete shielded by a pacemaker.
2.1.1 Geometry and computational grid
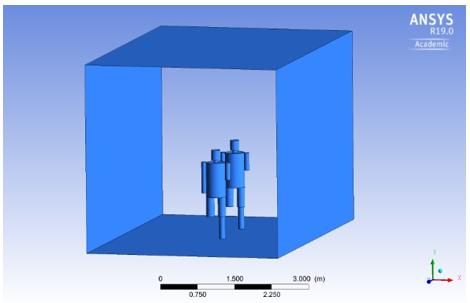
As far as geometry is concerned, a model of the fluid volume of the wind tunnel test chamber of the Politecnico di Milano was built. The setup includes the two athletes in their respective positions running on two independent treadmills positioned in the test chamber.
Runner’s bodies were modeled taking inspiration from Shanebrook and Jaszczak’s [21] studies, with a model composed of a series of cylinders and a sphere joined together.
Some adaptation to this scheme has been made and models have been realized with athletes anthropometric data who took part in the experiment, as seen in Figure 1. Runners were considered as static bodies, so the running arms and legs movements were not modelled. The athletes were positioned at a back to back distance of 1.50 m; this parameter is similar to that reported in other experimental analysis presented in this study.
A formula reported in literature initially proposed by Hill [22] and subsequently confirmed by Davies [16] was used for the evaluation of athletes projected area.
This formula, for a standing subject in running position at constant speed, to neglect body weight effect on acceleration and deceleration, defines projected area as a function of the athlete’s height alone:
$A_{r}=0.146 * h^{2}$ (1)
where, h represents the height expressed in meter.
The grid was generated using the ANSYS Workbench Meshing® and consists of a curvature mesh composed of 31131 knots and 168805 tetrahedron elements for single runner simulation and of 59539 knots and 324102 tetrahedron elements for two runners simulation.
Figure 1. Test chamber set up with runners models
2.1.2 Boundary conditions
The following air features have been established: temperature 299 K, density 1.16 kg/m3, kinematic viscosity 1.7894 e-5 kg/ms.
These properties were actually measured in the test chamber during the experiment.
A uniform constant horizontal air speed of 4.72 m/s was imposed at the fluid domain inlet, corresponding to the runner’s speed during the experimental test. The atmospheric pressure of 101325 Pa was imposed at the outlet. Finally, no-slip wall boundary layer condition was applied on runner’s model surface.
2.1.3 CFD simulations
Simulations were performed using ANSYS Fluent© CFD software. To solve the three-dimensional RANS equations, the k-ω model was chosen. During computation convergences was supposedly reached when residual values were below 10-5. The k–ω turbulence model is a two-equation turbulence model, that is used as an approximation for the Reynolds-averaged Navier–Stokes equations. The model attempts to predict turbulence by two partial differential equations with two variables, k the turbulence kinetic energy and ω the specific rate of dissipation. The standard k−ω model is best used for near-wall treatment, include a superior performance for complex boundary layer flows under adverse pressure gradients and separations, with relatively similar computational costs compared to the k-ε model. This turbulence model is commonly used in the field of sports science such as swimming and cycling studies.
2.2 Experimental overview
The experiment consisted in a series of tests with two athletes running on treadmills positioned into the wind tunnel. The two treadmills were aligned one behind the other in the middle of the wind tunnel test chamber. Power spent to run at the set velocity was quantified by measuring the oxygen consumption. Produced carbon dioxide, minute ventilation, heart rate (HR), lactate concentration (BLa) and rate of perceived exertion (RPE) were measured. By comparison of energy cost and power required with and without drafting the decreasing in power consumption due to the pacemaker effect was obtained. The actual gap between the two runners have been monitored by means of a motion capture system.
2.2.1 Methodology
The Large Wind Tunnel of Politecnico di Milano has a test chamber section of 4 m x 3.84 m and a maximum speed of 55 m/s. For the purposes of the present activity the test chamber hosted a lot of devices, basically the treadmills and the cameras with tripods (as can be seen in Figure 2), so that a non-negligible variation of the actual velocity in the athlete region was expectable. Thus, a preliminary calibration has been carried out.
The commercial model that has been chosen for the treadmills allowed for the required speed and the motor was located below the running belt so that, removing the struts of the cockpit, each treadmill resulted to have a reasonable flat upper surface. The treadmills are positioned higher than the floor level of the wind tunnel chamber. Since the athlete’s feet represent a very small part of the projected area, moreover during the run were in motion and raised from the ground, and above all the tested subject was on the rear treadmill, we have assumed that the possible air flow near the moving belt didn’t affect the tests results.
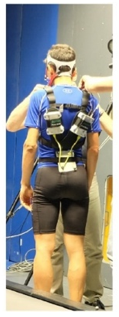
To determine the reciprocal position between the two athletes a ViconMotion 3D Capture Analysis System mod.460 (ViconMotion Systems Ltd, Oxford, UK) equipped with 5 Vicon M series cameras was used. A four passive markers cluster positioned, on the pelvis at the level of L5-S1 vertebra, as shown in Figure 3, was adopted to track the center of mass displacement. Furthermore 8 additional markers have also been placed, located on the four corners of each treadmill, to create a fixed reference. The cameras, was covering the entire acquisition volume to capture subjects’ movements, and were positioned on the sides of the test chamber, in a lateral and posterior position with respect to the athletes (Figure 2). Any aerodynamic problems concerning the operation of the tunnel and the quality of the flow in it have been neglected.
After positioning the equipment, we proceeded with the calibration. Once the system installation and verification phase were completed, data could have been acquired.
In order to be able to detect the possible advantage present during the shielded run, physiological parameters of the athletes were collected using an Oxycon Mobile device (Carefusion Germany 234 GmbH, Hoechberg, Germany). This mobile device allowed to determine the metabolic response, breath by breath, during exercise. Basic collected parameters were expired gas concentrations, ventilation and heart rate. Before carrying out the tests, following manufacturer’s instructions, calibration operations were performed.
Figure 2. Test chamber set up
Figure 3. Placement of markers on the athlete
2.2.2 Subjects
The two male athletes who took part in the experiment are currently running at agonistic level. The subject named “subject 1” is a 36-year-old medium-long distance athlete with good level amateur training. Instead, the “subject 2” is a professional 23 years old athlete, middle distance runner, with good placings at national level and had taken part in international youth events. In addition to the different training level, races distance participation and age of the two subjects, it was also considered the difference in running techniques by means of step length and frequency.
Table 1 shows the anthropometric characteristics of the two athletes.
For the assessment of the projected area of the athletes, the formula described by Davies [16] was used.
Table 1. Anthropometric characteristic of the athletes
|
Subject |
Age [years] |
Weight [Kg] |
Height [m] |
Projected area [m2] |
|
1 |
36 |
60 |
1.76 |
0.452 |
|
2 |
23 |
61 |
1.71 |
0.427 |
2.2.3 Procedures
Before the test sessions, the subjects done a warm-up consisting of 15-minute continuous run at low speed, a mobility drills followed by stretching. After, the harness and mask were placed on the tested subject and the Oxycon Mobile system was attached to the back of the athlete. Tests were subsequently conducted after calibration procedures were implemented. Before to start with the measurements, the athletes have run 5 minutes at low speed with the Oxycon Mobile instrumentation on, to familiarize with the equipment, environmental test conditions and drafting configuration. Each athlete has been tested running at 4.72 m/s both when run alone and with the other one ahead of him. The air speed was set at 4.72 m/s, as well as running speed. Each test began with the athlete at rest on the treadmill for about one minute, to collect basal oxygen consumption and produced carbon dioxide values. Then the 5’ run (treadmill and the wind tunnel) started and, after a transient phase of about 3’ to reach equilibrium, last 2’ with in steady state condition were acquired (in this phase also motion capture data were collected).
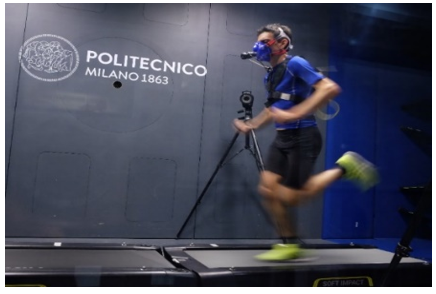
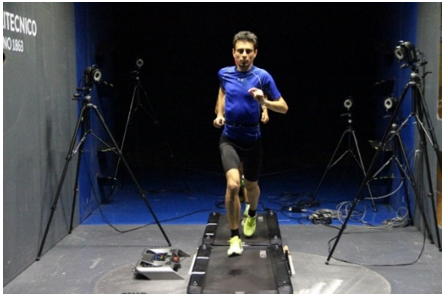
Finally, the wind tunnel was switched off and the athlete could progressively return to rest. At the end of each test, blood for lactate measurements was taken from a fingertip and analyzed. Also, runner’s perceived exertion was collected: athlete was asked to rate their RPE using the Borg scale (0-10). Each type of test has been repeated twice so that, considering the two configurations (alone and in tandem, as shown in Figure 4, Figure 5, Figure 6) and the two athletes, 8 test have been carried out. Between each test there was a sufficient time to ensure total recovery of the athletes.
Processing of the data obtained from the Vicon system consists in reprocessing markers coordinates. Being interested in the relative position between the two subjects, mean distance in the wind direction between the two aligned athletes during the tests was calculated. During the first test, with the subject 1 shielded by subject 2, the two athletes ran at a distance of 1.49 ± 0.2 m; for the second test, a distance of 1.43 ± 0.1 m of subject 2 was obtained with respect to subject 1. These average values had a slightly different standard deviation, but both were of the order of 0.02 m.
Data collected, through the Oxycon Mobile system, related to the trend of oxygen uptake, produced carbon dioxide, heart rate and respiratory quotient, were analyzed in order to obtain all the variables of interest. Instead of calculating the average time value of all the data collected during the measurement time interval, we proceeded by using the integral average value. Having detected carbon dioxide production and the values that the respiratory quotient assumes during the exercise, it was possible to obtain the caloric equivalent for each single exercise in order to convert oxygen net cost into kCal/min [23]. After appropriate conversions from kCal to J, metabolic power expressed in Watt was calculated. From oxygen consumption measurements was possible also to estimate the energy cost of the activity [24].
Figure 4. Athlete alone running during test
Figure 5. Athletes running during the test: tandem configuration
Figure 6. Athletes running during the test: tandem configuration front view
3.1 Numerical results
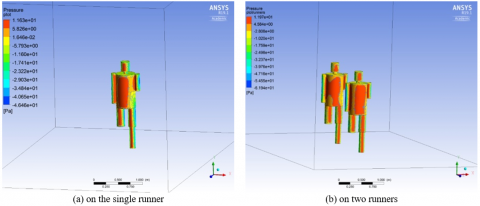
Figure 7 shows the total pressure distribution acting on the bodies of the two runners: through these images is possible to notice that the pressure exerted by the air on the body of the second athlete is lower, when he runs shielded.
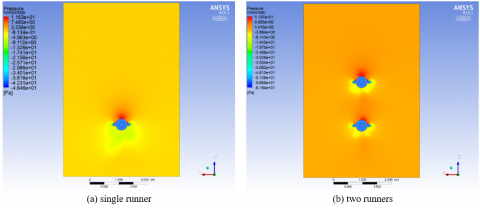
To better visualize this phenomenon, the pressure distribution was studied in the control volume on a horizontal plane placed at a height of 1.20 m. The result obtained is visible in Figure 8: it can be seen that in front of the athletes there is an area of air with higher pressure, while behind the athletes the pressure is lower. This pressure difference, as known, generates the pressure component of the aerodynamic drag. In front of the second subject the pressure is lower than the pressure encountered by the first subject, just as it is lower than that which hitting him in the case of a solo-run, as shown in Figure 8(a).
Figure 7. Total pressure distribution
Figure 8. Pressure distribution in the horizontal plane at height of 1.20 m
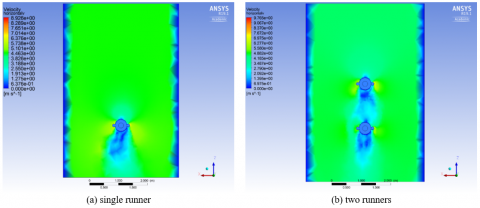
Figure 9. Velocity distribution in the horizontal plane at height of 1.20 m
This smaller pressure difference between the front and back of the second athlete during shielded run will lead to a greater recovery of pressure downstream of his body, with a consequent reduction of the aerodynamic drag the pressure component.
Figure 9 and Figure 10 shows the flow velocity is lower in the wake of the front runner.
The shielded runner is inside the wake of the subject that precedes him; thus, a lower air flow speed and negative pressure coefficient area strikes him. So, the second athlete will encounter a lower drag pressure component and less aerodynamic resistance.
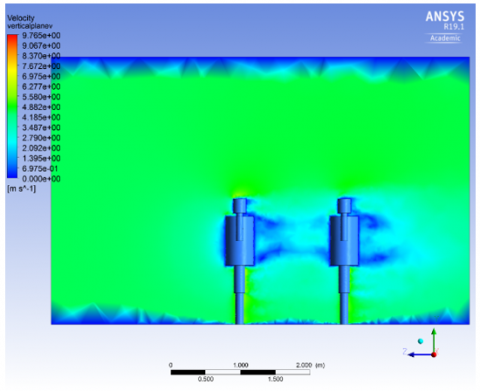
Finally, in Figure 10 it is possible to view air velocity values on a vertical plane passing through the center line of the test chamber and the athletes. In this image you can see the recirculation areas that are created behind the head, arms, legs and torso, due to the separation of the flow induced by bluff shape of the human body.
The numerical results of the aerodynamic forces, and relative coefficients, acting on the body of the second athlete, obtained for the simulation with a single model and with two models present in the test chamber, are showed in Table 2.
From the data resulting from the simulations, it is possible to infer a lower aerodynamic resistance exerted by the air on the shielded runner. There is a decrease in drag and drag coefficient of 9.73%. This confirms the aerodynamic power advantage in watts of 9.73% running shielded.
Figure 10. Velocity distribution in the vertical center plane
Table 2. CFD simulation resistance and resistance coefficient
|
Subject |
D [N] |
Cd |
|
Unshielded runner |
5.43 |
0.99 |
|
Shielded runner |
4.90 |
0.90 |
3.2 Experimental results
Table 3 shows the results obtained for both athletes. Most variables in the case of a shielded run decrease and athlete physiological parameters trend were the same. There was a significant reduction in oxygen consumption, produced carbon dioxide, minute ventilation, associated energy cost, energy spent and metabolic power. There was also a reduction in lactate concentration and RPE while the HR has remained almost constant.
During the aerobic effort the relationship between HR and oxygen consumption should be linear but many other variables can have influenced it (i.e. body posture, athletes psychological status and increase in body temperature) [25, 26].
Table 3. Physiological parameters and related advantages for both athletes during running the alone and shielded condition.
|
Parameters |
Subject 1 |
Subject 2 |
|
VO2alone |
3405.20 ± 227.57 mL/min |
2403.60 ± 452.90 mL/min |
|
VO2shielded |
3287.20 ± 233.31 mL/min |
2224.10 ± 241.39 mL/min |
|
%ΔVO2 |
- 3.46% |
- 7.46% |
|
espent alone |
13.74 kCal = 57.55 kJ |
6.42 kCal = 26.86 kJ |
|
espent shielded |
13.27 kCal = 55.55 kJ |
5.93 kCal = 24.85 kJ |
|
%Δespent |
- 3.46% |
- 7.50% |
|
Walone |
1198.90 W |
839.52 W |
|
Wshielded |
1157.30 W |
776.54 W |
|
%ΔW |
- 3.46% |
- 7.50% |
|
Eralone |
4.40 kJ / (kg * km) |
2.82 kJ / (kg * km) |
|
Ershielded |
4.09 kJ / (kg * km) |
2.60 kJ / (kg * km) |
|
%ΔEr |
- 6.95% |
- 7.67% |
|
VCO2alone |
3717.00 ± 220.23 mL/min |
2407.60 ± 407.28 mL/min |
|
VCO2shielded |
3437.30 ± 229.44 mL/min |
2232.90 ± 218.98 mL/min |
|
%ΔVCO2 |
- 7.53% |
-7.26% |
|
VEalone |
148.35 ± 7.27 L/min |
97.83 ± 10.07 L/min |
|
VEshielded |
139.62 ± 8.54 L/min |
92.95 ± 6.46 L/min |
|
%ΔVE |
- 5.88% |
- 4.99% |
|
HRalone |
180 ± 2 beats/min |
180 ± 1 beats/min |
|
HRshielded |
181 ± 3 beats/min |
176 beats/min |
|
HRshielded |
+ 0.74% |
-1.93% |
|
BLaalone |
6.6 mmol/L |
1.1 mmol/L |
|
BLashielded |
5.6 mmol/L |
0.9 mmol/L |
|
%ΔBLa |
- 15.15% |
- 18.18% |
|
RPEalone |
9 |
5 |
|
RPEshielded |
8 |
4 |
|
%ΔRPE |
-11.11% |
-16.67% |
Notes: 1. Data are presented as means ± SD
While the strong association between oxygen consumption and RPE has been verified.
Projecting these results to a whole marathon a time improvement of 535 s, that corresponding a decrease of 6% is obtained.
In this study two different methods have been implemented to evaluate the aerodynamic and physiological advantages due to the shielded run at endurance run velocity.
A preliminary numerical study was carried out in order to evaluate the flow field around the runners and understand the aerodynamic response of two aligned runners.
The CFD method consist in two numerical simulations: the first one modelled the airflow around the runner alone, while the second study the airflow around two aligned runners positioned at a distance of 1.50 m from each other (back-to-back distance) at a wind velocity of 4.72 m/s.
The simulations carried out in ANSYS Fluent modelled the air flow in a control volume representing the wind tunnel test chamber of the Politecnico di Milano, which invests models of the human body schematized in a racing position. The following results have been reached: reduction of aerodynamic drag and of drag coefficient on the shielded runner of 9.73%.
In his study Pugh [14] found a 93% reduction in dynamic pressure at the maximum tested distance of 1 m from the athlete, in a perfectly aligned position.
Kyle [15] showed that running behind one another at a distance of 0.9 m leads to a decrease of 64% in drag. Beaumont et al. [20] suggests a drag reduction of 33% on the trailing runner shielded by other two runners, with respect to the runner alone.
As concern the wind tunnel tests, quite different values emerge between the two subjects, although they run at about the same distance from one another. This could be due to projected area of subject 2 smaller than subject 1, to different running mechanics, but also the different level of training, prepared competitions and age of the two subjects who took part in the experiment must also be considered. In addition, subject 1 showed a higher involvement of the anaerobic metabolism during the experiment. This phenomenon has influenced the physiological values measured, and makes it difficult to compare with the data collected on subject 2, which performed a purely aerobic effort. It could then be assumed that during an aerobic submaximal work the advantage due to the reduced air resistance brings more benefits on the athletes physiological parameters, since being in a steady state, they are doing a less demanding work. Athletes confirmed an easier psychological feeling during the shielded run. This could be due, not only to the shielding of the air due to the athlete preceding him, and therefore to the lesser aerodynamic resistance encountered, but also to a psychological safety component. To better highlight the presence of any energy savings due to the psychological component, it would have been interesting to carry out the same tests in the absence of wind.
These tests were not carried out as there were time limitations due to the cost of the equipment used and the possibility of late fatigue in the athletes that would have distorted the measured physiological parameters. We have thus limited ourselves to the most realistic and important situations in the presence of wind.
It should be remembered that subject treadmill running mechanics varies respect to the run mechanics on normal road race, and even this variable has influenced the values of the parameters measured during the experiment. In the evaluation of the collected data it should also be mentioned that errors may be present due to the possible variability of the physiological parameters measured by the Oxycon Mobile system. For this instrumentation a variability of the measured values of 2% has been certified [27].
With regard to what has been found in the literature, the results obtained from this study assume values close to the few studies previously carried out. In particular, as Pugh states in his study [14], the advantage due to the shielded run was an 8% running against a wind of 6 m/s on treadmill. From the tests we performed on subject 1 a reduction in oxygen consumption of 3.46% was detected, while for subject 2 a decrease of 7.46%. As previously illustrated, subject 1 performed a physical exercise taxing more the anaerobic mechanism, therefore considering the values obtained by subject 2 more reliable, it can be said that our results are similar to the estimates previously made by Pugh. It should be remembered that the study carried out by Pugh was conducted on a professional marathon runner in a climatic chamber, where the air flow was simply generated by a fan positioned in front of treadmill with speed fluctuations of up to 1 m/s. In the 1970s the instrumentation used to detect oxygen consumption was also far less accurate and precise than the equipment available today and used by us during the experiments.
In the study of Beaumont et al. [20] an oxygen intake reduction of about 6% was found for the trailing runner at a mean velocity of 5.88 m/s.
The experiments of this study were performed in a low-turbulence (0.1%) wind tunnel, so the turbulence of the air flow in the test chamber didn’t influence the results obtained. Compared to a test executed on the track or on the road, the wind can be considered a perfect parameter.
Projecting these results to a whole and real marathon can implies some approximations such as aerobic requirements of track running and treadmill, environmental conditions changes and the running energy cost variation with the distance covered.
In literature there are differing opinions about aerobic demand of track and treadmill running. At relatively moderate running speeds, up to about 4.4 m/s, the aerobic demand is considered equal. At higher running velocity, several studies have shown significant differences between aerobic demand of the two running conditions [28, 29].
Many studies [30, 31] have demonstrated that net energy cost of running increase with the distance covered due to a decrease in running economy for physiological and biomechanical factors variations, neglecting these variations due to environmental conditions and distance covered, projecting these results to a whole marathon with zero wind, a lower estimated finish time of 535 s or 6% was calculated. Cavanagh [11] suggests a 2% improvement translates into a 2’30" reduction in finish time in an elite marathon race performance.
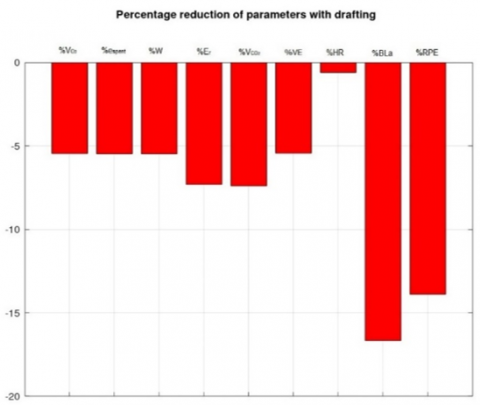
Figure 11. Percentage reduction of physiological parameters with drafting
The purpose of this study was to assess the reduction of air resistance, which can be achieved through the drafting, can bring physiological benefits in a run. In endurance races, as in many sports, a part of the power produced by athletes is used to overcome air resistance. Comparing the data obtained during the run individually, and during the shielded run, it was possible to appreciate the advantage achieved in terms of physiological variables.
The CFD simulations are used to analyze aerodynamic effects in terms of drag and drag coefficient with and without drafting: from the comparison of single athlete and two aligned runners, an aerodynamic drag and of drag coefficient reduction on the shielded runner of 9.73% was found.
As concern the wind tunnel tests, considering the athlete who performing a purely aerobic work effort, a percentage reduction in net oxygen consumption and energy consumption of 7.50% was obtained, while running at a distance of 1.43 m from the athlete who precedes him. For the athlete that was showing a higher involvement of the anaerobic mechanism, a percentage reduction of physiological parameters of 3.46% was obtained, while running at a distance of 1.49 m from the other athlete.
These distances between the two subjects can be considered as the most truthful distance and easily maintained during a race.
Although projecting these results to a whole and real marathon implies some approximations, must be remember that also small advantages give to athletes the capacity to increase their sustainable velocity, especially in the race final part, and improve their performance times. More longer the distance of a race, the more important conservation of energy becomes.
As can been seen in Figure 11, from the significative reduction in oxygen consumption (-5.46%), metabolic power (-5.48%), energy cost (-7.31%), produced carbon dioxide (-7.40%), minute ventilation (-5.44%), HR (-0.60%), lactate concentration (-16.66%), RPE (-13.89%), drafting appears to improve running economy.
With drafting, an athlete could conserve energy and improve his performance, specially toward the end of the competition. This study was performed at a running speed of 4.72 m/s, considering a velocity of modern elite marathon runner of 5.8 m/s, the advantage due to drafting is more significantly since air resistance is proportional to the square of velocity.
Drafting may result in an important physiological parameter benefit for athletes during endurance running. This has implications for the training programs and especially for race strategy. As in other sports, also in running the benefits drafting may vary with the size of the group and the position compared to other runners. Testing different positions within the group, or inter-subject distance considering both wind tunnel and indoor tests can shed light and give practical suggestion. Other experiments could be carried out also at different running speeds or with athletes of various specializations e training level, to better appreciate the differences between professional runners and not, and between marathon runners and middle distance runners. Further research is therefore needed to quantify the real benefits that can be found in running, especially for long distance races.
This work is supported by the DAER and Design Department of Politecnico di Milano and MAPEI Sport Research Center with their internal resources. To acknowledge the two athletes who took part in the experiment.
|
Ar |
projected area, m2 |
|
BLa |
Blood Lactate concentration, mmol/L |
|
Cd |
drag coefficient |
|
D |
drag, N |
|
Er |
energy cost, kJ. Kg-1. km-1 |
|
espent |
spent energy, kCal |
|
h |
height, m |
|
H |
Heart Rate, beats. min-1 |
|
RPE |
Rate of Perceived Exertion |
|
VCO2 |
produced carbon dioxide, mL. min-1 |
|
VO2 |
oxygen consumption, mL. min-1 |
|
VE |
minute ventilation |
|
W |
metabolic power, W |
|
% BLa |
Blood Lactate concentration percentage variation |
|
% espent |
spent energy percentage variation |
|
% Er |
energy cost percentage variation |
|
% HR |
Heart Rate percentage variation |
|
% RPE |
Rate of Perceived Exertion percentage variation |
|
% VCO2 |
produced carbon dioxide percentage variation |
|
% VO2 |
oxygen consumption percentage variation |
|
% VE |
minute ventilation percentage variation percentage variation |
|
% W |
metabolic power percentage variation |
[1] Gibertini, G., Andreoni, G., Fusca, M.C., Mazzola, M., Grassi, D., Scarpellini, N., Trovato, D. (2013). Aerodynamics of jump in downhill ski racing. IRIS Politecnico di Milano, pp. 302-313. http://hdl.handle.net/11311/760705.
[2] Nørstrud, H. (2008). Alpine downhill and speed-skiing. In Sport Aerodynamics, 131-138. http://doi.org/10.1007/978-3-211-89297-8
[3] Bilodeau, B., Roy, B. (1994). Effect of drafting on heart rate in cross-country skiing. Medicine & Science in Sports & Exercise, 26(5): 637-641. http://doi.org/10.1249/00005768-199405000-00018
[4] Bilodeau, B., Roy, B., Boulay, M.R. (1995). Effect of drafting on work intensity in classical cross-country skiing. International Journal of Sports Medicine, 16(03): 190-195. http://doi.org/10.1055/s-2007-972990
[5] Gibertini, G., Campanardi, G., Grassi, D., Guercilena, L. (2011). The study of details effects in cycling aerodynamics: Comparison between two different experimental approaches. In Wind Tunnels and Experimental Fluid Dynamics Research, pp. 481-492. http://dx.doi.org/10.5772/21593
[6] Gibertini, G., Grassi, D. (2008). Cycling aerodynamics. In Sport Aerodynamics, 23-47. http://doi.org/10.1007/978-3-211-89297-8_3
[7] Foster, C., Schrager, M., Snyder, A.C., Thompson, N.N. (1994). Pacing strategy and athletic performance. Sports Medicine, 17(2): 77-85. http://doi.org/10.2165/00007256-199417020-00001
[8] Madeleine, P., Samani, A., de Zee, M., Kersting, U. (1989). Biomechanics of Human Movement. Benchmark Press, Inc., Indianapolis, 439-466.
[9] Tripler, P.A. (1990). Physics for Scientists and Engineers. Third edition, Worth Publishers: 1: 346-360.
[10] Pugh, L.G.C.E. (1976). Air resistance in sport. In Advances in Exercise Physiology, 9: 149-164. http://doi.org/10.1159/000398958
[11] Cavanagh, P.R. (1990). Biomechanics of Distance Running. Human Kinetics Books, Box 5076, Champaign, IL 61825-5076.
[12] Dixon, S. (1994). Current issues in biomechanics. Br J Sports Med. 28(2): 138. http://doi.org/10.1136/bjsm.28.2.138
[13] Williams, K.R. (1985). The relationship between mechanical and physiological energy estimates. Medicine and Science in Sports and Exercise, 17(3): 317-325. http://doi.org/10.1249/00005768-198506000-00004
[14] Pugh, L.G.E. (1971). The influence of wind resistance in running and walking and the mechanical efficiency of work against horizontal or vertical forces. The Journal of Physiology, 213(2): 255-276. http://doi.org/10.1113/jphysiol.1971.sp009381
[15] Kyle, C.R. (1979). Reduction of wind resistance and power output of racing cyclists and runners travelling in groups. Ergonomics, 22(4): 387-397. http://doi.org/10.1080/00140137908924623
[16] Davies, C.T. (1980). Effects of wind assistance and resistance on the forward motion of a runner. Journal of Applied Physiology, 48(4): 702-709. http://dx.doi.org/10.1152/jappl.1980.48.4.702
[17] Davies, C.T.M. (1981). Wind resistance and assistance in running. In Physiological Chemistry of Exercise and Training, 13: 199-212. http://doi.org/10.1159/000397206
[18] Zouhal, H., Abderrahman, A.B., Prioux, J., Knechtle, B., Bouguerra, L., Kebsi, W., Noakes, T.D. (2015). Drafting’s improvement of 3000-m running performance in elite athletes: Is it a placebo effect? International Journal of Sports Physiology and Performance, 10(2): 147-152. http://doi.org/10.1123/ijspp.2013-0498
[19] Inoue, T., Okayama, T., Teraoka, T., Maeno, S., Hirata, K. (2016). Wind-tunnel experiment on aerodynamic characteristics of a runner using a moving-belt system. Cogent Engineering, 3(1): 1231389. https://doi.org/10.1080/23311916.2016.1231389
[20] Beaumont, F., Bogard, F., Murer, S., Polidori, G., Madaci, F., Taiar, R. (2019). How does aerodynamics influence physiological responses in middle-distance running drafting. Mathematical Modelling of Engineering Problems, 6(1): 129-135. http://doi.org/10.18280/mmep.060117
[21] Shanebrook, J.R., Jaszczak, R.D. (1976). Aerodynamic drag analysis of runners. Medicine and science in sports, 8(1): 43-45.
[22] Hill, A.V. (1928). The air-resistance to a runner. Proceedings of the Royal Society of London. Series B, Containing Papers of a Biological Character, 102(718): 380-385. https://doi.org/10.1098/rspb.1928.0012
[23] Fox, E.L., Bowers, R.W., Foss, M.L., Cerquiglini, S. (1995). Le basi fisiologiche dell'educazione fisica e dello sport. Il pensiero scientifico.
[24] Margaria, R., Cerretelli, P., Aghemo, P., Sassi, G. (1963). Energy cost of running. Journal of Applied Physiology, 18(2): 367-370. http://dx.doi.org/10.1152/jappl.1963.18.2.367
[25] Dotson, C.O., Humphrey J.H. (eds.) (1988). Exercise Physiology: Current Selected Research, 3. AMS Press, Inc., N.Y.: 121-131.
[26] McGinnes, C., Stoudemire, N., Pass, K., Wideman, L., Weltman, A., Gaesser, G.A. (1995). Oxygen uptake (VO2), velocity (V), blood lactate ([HLa]), and rating of perceived exertion (RPE) during running at constant heart rate (HR): 272. Medicine & Science in Sports & Exercise, 27(5): S47. http://doi.org/10.1249/00005768-199505001-00272
[27] Rosdahl, H., Gullstrand, L., Salier-Eriksson, J., Johansson, P., Schantz, P. (2010). Evaluation of the oxycon mobile metabolic system against the Douglas bag method. European Journal of Applied Physiology, 109(2): 159-171. http://doi.org/10.1007/s00421-009-1326-9
[28] Daniels, J., Bradley, P., Scardina, N., Van Handel, P., Troup, J. (1985). Aerobic responses to submax and max treadmill and track running at sea level and altitude. Medicine & Science in Sports & Exercise, 17(2): 187. http://doi.org/10.1249/00005768-198504000-00028
[29] McMIKEN, D.F., Daniels, J.T. (1976). Aerobic requirements and maximum aerobic power in treadmill and track running. Medicine and Science in Sports, 8(1): 14-17. http://dx.doi.org/10.1249/00005768-197621000-00015
[30] Brueckner, J.C., Atchou, G., Capelli, C., Duvallet, A., Barrault, D., Jousselin, E., Di Prampero, P.E. (1991). The energy cost of running increases with the distance covered. European Journal of Applied Physiology and Occupational Physiology, 62(6): 385-389. http://doi.org/10.1007/BF00626607
[31] Cavanagh, P.R., Williams, K.R. (1982). The effect of stride length variation on oxygen uptake during distance running. Medicine and Science in Sports and Exercise, 14(1): 30-35. http://doi.org/10.1249/00005768-198201000-00006