Camilla Lops* | Nicola Germano | Alessandro Ricciutelli | Valerio D’Alessandro | Sergio Montelpare
© 2021 IIETA. This article is published by IIETA and is licensed under the CC BY 4.0 license (http://creativecommons.org/licenses/by/4.0/).
OPEN ACCESS
Double Skin Façades (DSFs) have become widespread solutions commonly employed in new and existing buildings in the last decades. Since its introduction, the multi-layered façade has improved profoundly, assuming more articulate and complex shapes for better energy performances and combining advanced technologies as innovative materials or systems. However, the effectiveness and the thermal behaviour of DSFs should be carefully evaluated since the design phase by selecting proper methodologies, thus avoiding inaccurate results. In fact, the correct estimation of the airflows inside DSF channels is heavily influenced by the simulation settings. Furthermore, the lack of measurements or empirical validations in the field is the primary source of concern for researchers. Considering the available numerical methods for investigating DSFs, Computational Fluid Dynamics (CFD) simulations have proven to be the most appropriate option. The present work compares multiple Double Skin Façade configurations by performing CFD analyses and adopting different turbulence models in bi- and three-dimensional domains. The results underline the capability of 2D models in predicting the fluxes inside the DSF channel and in the domain. Furthermore, comparisons among the velocity profiles estimated by adopting different turbulence formulations highlight only slight variations, especially in proximity to the perturbated areas of the cavity.
CFD modelling, Double Skin Façade, naturally ventilated façade, turbulence model
The essential concept of Double Skin Façade appeared, for the first time, in the early 20th century in the northern European countries [1]. However, little progress was made until the 1990s when it started to be employed increasingly in high profile buildings [2]. The system consists of a multi-layered façade composed of external and internal glass skin, separated by the presence of an air corridor, the cavity, ranging in width from 20 centimetres to various meters [3]. In the preliminary version, the multi-layered façade is conceived and designed for reducing the heating consumption thanks to the air buffer enclosed in the cavity, which acts as a barrier for the heat losses and as a filter for the exchanges through the external envelope. Moreover, the intermediate space works against temperature extremes and helps on the sound protection side. From its introduction, DSF has been profoundly improved, assuming more innovative and complex shapes to ensure better energy performances.
Besides the popularity of DSFs, commonly used for new and restored buildings, the major concern of researchers is referred to the well-known difficulties in modelling and predicting their thermal and energy performance [4-6]. Several investigations started to be carried out in the late 1970s to measure and predict this technology's effectiveness [7]. The principal barrier to tackle is the absence of various experimental measurements or empirical validations adopted for the analysis of DSF systems.
In fact, predicting the global performance of multi-layered façades is very challenging considering the involved multiple coupled physical phenomena, such as air movement, heat convection or conduction, and short- and long-wave radiation [8].
Several methods can be identified and adopted to analyse the air fluxes and temperature distributions in DSF channels. Some of them adopt analytical models [9-11], field measurements [12-14] or finite element approaches for running fluid dynamics simulations [15, 16].
Papakonstantinou et al. [17] underline the capability of computer analyses in describing the natural ventilation of occupied spaces, estimating values comparable with measured data of air velocity, pressure and temperature. Furthermore, according to Liddament [18], the predictions calculated through numerical approaches have allowed enabling the concepts of ventilation efficiency to be used since the design phase. In contrast, the importance of experimental campaigns has been limited to the study of existing buildings.
Considering the available approaches, Computational Fluid Dynamics analyses ensure accurate predictions in evaluating DSF performances, inserted and not inside urban areas [19]. The literature review puts in evidence the capability of CFD simulations in estimating outputs that are physically plausible and in good agreement with available experimental campaigns. According to Dama et al. [20], in fact, the CFD method is able to qualitatively describe the realistic flows generated inside the cavity of a DSF system with good approximation. In contrast, CFD predictions can lead to inaccurate values by assuming inappropriate turbulence formulations or boundary conditions. Chen and Srebric [21] suggest that a crucial stage in modelling double façades is validating and verifying the adopted hypotheses, thus avoiding wrong results. The reliability of CFD simulations is also confirmed by Xu and Ojima [12] that experimented 2.5% and 12%, respectively, as a minimal and maximal error by comparing measured and estimated values.
Finally, other studies are mainly focused on evaluating and defining the best settings and assumptions to adopt in the case of CFD analyses of DSF systems as the research carried out by Pasut and De Carli [22]. In detail, the work aims to define a strategy, scientifically validated, for performing CFD analyses of naturally ventilated DSF buildings. In addition, the research aims to distinguish the parameters crucial for the simulation process from those unnecessary that only increase the complexity of the model without incrementing the accuracy of the predictions.
Besides the benefits related to the use of the CFD in the design phase, a complete understanding of the main principles that control the fluid dynamic matter (conservation equations, turbulence formulations, etc.) is necessary for performing realistic simulations, overcoming the common downfalls and limitations.
The present work intends to verify various physical hypotheses commonly used to study DSF models and compare the predicted ventilation ratios associated with different cavity configurations. Thus, various Computational Fluid Dynamics analyses, both bi- and three-dimensional, are reported, and different turbulence formulations are evaluated. After a brief introduction, the paper is structured as follows: Section 2 describes the case study chosen for the analysis. Then, bi- and three-dimensional CFD simulations are detailly presented in Section 3. Finally, Section 4 reports the main findings and conclusions.
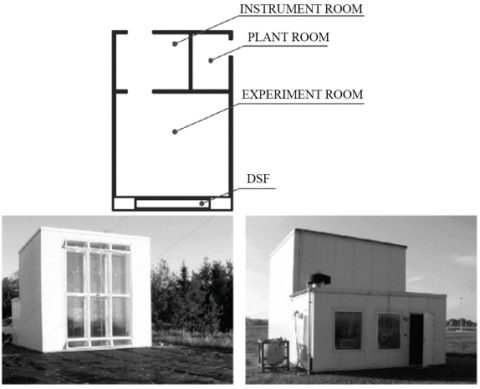
The performed CFD simulations assume a simple DSF building with the same characteristics of the full-scale test facility realised by the Department of Civil Engineering of the Aalborg University in collaboration with the Department of Sciences and Methods for Engineering of the University of Modena and Reggio Emilia [23-25]. The configuration of the adopted test cell is depicted in Figure 1. In detail, a representation of the internal zones is reported in the upper part of the figure, whereas two photos of the south and north elevation are shown, respectively, on the left and the right. The mock-up has a prismatic shape with main dimensions equal to 6 m x 6 m x 6 m. The DSF is placed on the south elevation and is composed of an inner double-glazed layer and single-pane windows for the outer perimeter. The cavity is characterised by natural ventilation, and the air movements are only due to the generated convective forces.
Several DSF configurations and models are elaborated and evaluated in order to compare the obtained results. The cavity ventilation is the main investigated output. The first step of CFD simulations is focused on the generation of a bi-dimensional model for testing the global performance and comparing the predicted values with those collected from the literature review and the experimental campaign.
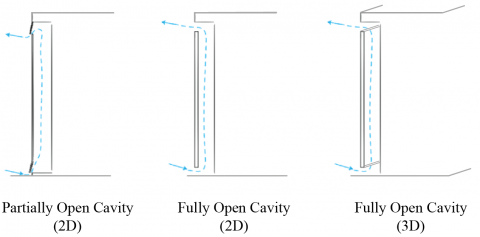
Subsequently, a different DSF configuration is investigated. In detail, the inlet and outlet sections of the cavity are fully open and not only partial as in the previous case, thus preventing pressure drops and ensuring more intense velocities inside the air channel. Ultimately, comparisons are made among the bi- and three-dimensional model of the improved DSF version for estimating the impact that the presence of lateral openings has on the airflows inside the channel. The above-mentioned configurations are schematised in Figure 2.
Figure 1. Representation of the plan and pictures of the south and north elevation [20]
Figure 2. Schematisation of the analysed DSF typologies and domains
The main principles related to the CFD analysis as the conservation equations of mass, energy, momentum and turbulence quantities are detailed described by Versteeg and Malalasekera [26].
The carried-on simulations are the Unsteady Reynolds-Averaged Navier Stokes (U-RANS), and various turbulence models are implemented. Preliminary analyses are performed by adopting the SST k-ω turbulence model. This stage aims to check the correctness of the hypotheses and assumptions adopted for the generation of the numerical model by comparing the natural ventilation predicted inside the DSF cavity. Then, two additional turbulence models, the V2F k-ε and the Realisable k-ε, are selected and implemented for performing various analyses and comparing the results associated with the chosen formulations. The selection of the turbulence models to be implemented is based on the validations underlined in multiple works centred on airflows inside DSF cavities and layers [22, 27, 28].
The correlation of the first cell centre to the wall is taken into consideration by assuming the all y+ hybrid approach, thus avoiding the mesh resolution insufficiency in proximity to the surfaces. Moreover, the model is discretised by selecting polyhedral and prism layer meshes with variable dimensions. Finally, the accuracy of the model is increased by inserting meshes with a smaller size near the most interesting areas, like inside the DSF channel, to improve the accuracy of the model without a too high computational effort. In detail, the settings adopted for the meshing phase are:
Base Size = 0.4 m
Number of Prism Layer = 5
Prism Layer Stretching = 1.2
Prism Layer Thickness = 0.1 m
Regarding the boundary conditions, uniform temperature values are set for all surfaces, both transparent as the glazed layers and opaque like the ground and ceiling. The imposed conditions are defined on the basis of the experimental campaign carried on by the study assumed as a reference and, specifically, by considering the case in which the buoyancy is encouraged by a moderate upward wind differential pressure [20]. In detail, the adopted temperatures are 14.6℃ for the air, 29.5℃ above the DSF inner layer and 28.6℃ for the inner surface of the building. Moreover, the DSF channel localised on the south façade is modelled by assuming a zero-pressure value on the domain borders and fixing the density of the fluid in the physics continuum based on the specific gas, pressure and temperature levels predicted for the computational domain.
The commercial software Star-CCM+ (version 13) [29] is used for performing CFD analyses and estimating the obtained velocities inside and outside the DSF cavity. With respect to the preliminary results presented in Lops et al. [30], the ventilation of the channel is evaluated at different heights, identified for being representative of the system's behaviour, and additional probe lines are inserted for more accurate evaluations. The maximum physical time is fixed at 20 min for every simulation.
3.1 DSF bi-dimensional modelling for preliminary comparisons
Preliminary simulations are performed for evaluating the capability of the created model in predicting the DSF performance. For this porpoise, the mock-up assumed as a test case is perfectly replicated by generating a bi-dimensional model. Figure 3 depicts the components introduced for subdividing the building and the domain. The whole surfaces are discretised into 7,493 mesh elements, and the simulation time step is set at 0.05 s.
Figure 3. Schematisation of the components of the domain (left) and the partially open cavity DSF (right)
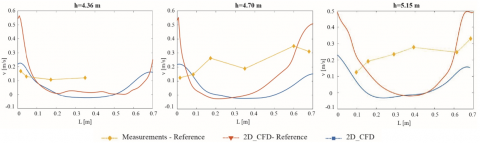
Figure 4. Velocity profiles referred to the investigated probe lines
Intercomparisons, expressed in cavity ventilation and referred to the investigated probe lines, are shown in Figure 4. In detail, the outputs obtained by the performed CFD simulations (solid blue lines) are compared with the estimated (sold orange lines) and measured (dotted yellow lines) data extrapolated from the literature review. The charts underline the good accordance among the results predicted from the numerical modelling. In contrast, significant variations can be seen if the estimations are compared with the recorded values.
These differences are influenced by the sensitivity of the velocity measurements inside the perturbated area, which could cause higher uncertainties of the measured data [20]. Nevertheless, based on the findings mentioned above, the model is considered validated and able to predict the fluid dynamic performance of the selected Double Skin Façade correctly.
3.2 Bi-dimensional modelling of the fully open DSF cavity
After the model validation, the second phase of the CFD simulation is evaluating a different version of DSF. The suggested configuration presents the inlet and outlet sections completely open and not only partially as in the previous case. The settings and hypotheses used in the already shown simulations are also confirmed here. The subdivision of the building and domain into different surfaces and components is schematised in Figure 5. Finally, the total model is discretised into 71,376 mesh elements, and the analysis time step is fixed at 0.1 s.
Figure 5. Schematisation of the components of the domain (left) and the fully open cavity DSF (right)
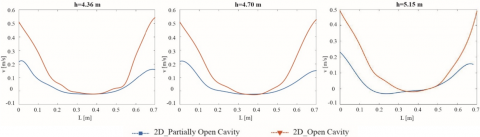
Figure 6 depicts the comparisons reported in terms of velocity magnitude predicted inside the DSF channel and referred to the bi-dimensional models. The insertion of more aerodynamic profiles encourages air movements in the cavity, avoiding velocity losses. In fact, the most intense ventilation is estimated for all the investigated probe lines in the case of the DSF improved version.
Figure 6. Velocity profiles referred to the investigated probe lines for the 2D partially and fully open cavity
3.3 Three-dimensional modelling of the fully open DSF cavity
Once the performance of the DSF building has been evaluated by performing bi-dimensional CFD simulations, a 3D model is generated in order to estimate the impact that the lateral openings have on the air flows inside the channel. The model presents, also in this case, fully open inlet and outlet sections, considering their better performance in the cavity ventilation. The hypotheses and formulations adopted for the previous analyses are confirmed also for the 3D model and the scale factor among the domain and the building is fixed at 10%. The whole system is composed of 657,736 mesh elements, whereas the time step is set to 0.01 s, thus solving convergence problems. The schematisation of the building and domain surfaces is depicted in Figure 7.
Figure 7. Schematisation of the components of the domain (left) and the fully open cavity DSF (right)
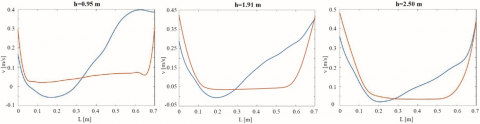
The results, expressed in velocity magnitude obtained for the selected probe lines, are shown in Figure 8. Comparisons are made between the bi- and three-dimensional model represented, respectively, by the solid blue and orange lines. The estimated velocities profiles underline good accordance between the two models, especially in the upper area of the DSF cavity. In contrast, significant variations are expected in proximity to the inlet section and, in particular, at the lower probe lines where the capability of the bi-dimensional model decreases its accuracy in the predictions. In general, looking at the whole behaviour of the system, the 2D model can describe with good approximation the ventilation of the cavity, requiring a lower computational effort and complexity than the 3D model.
Figure 8. Velocity profiles referred to the investigated probe lines for the 2D and 3D fully open cavity
3.4 Comparisons among different turbulence models
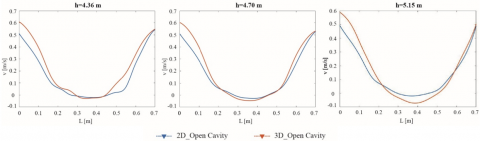
After analysing the behaviour of various Double Skin Façade typologies and computational domains, different turbulence models are implemented. The outputs, already presented in the previous subsections and estimated by employing the SST k-ω formulation, are compared with the predictions obtained by using the Realisable and V2F k-ε turbulence models. The velocity profiles referred to each DSF configuration and domain, both inside and outside the air channel, are shown from Figures 9-14. In detail, the convective plume created because of the naturally ventilated DSF is depicted in Figure 9 to Figure 11. In contrast, the velocity magnitudes expected inside the cavity of the system is reported in Figures 12-14.
Regarding the convective movements generated out of the case study, a similar trend of velocities is expected by all the suggested formulations. The two k-ε models exhibit better accordance with each other, whereas more significant variations are obtained by employing the k-ω formulation. The underlined differences and similarities are confirmed for all the investigated models. Similar considerations can be done for the velocity profiles inside the DSF channels.
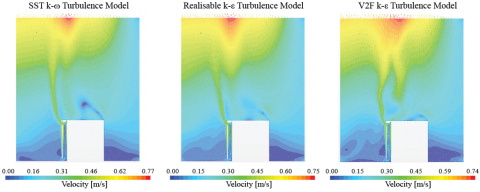
Considering the partially open cavity (Figure 12), the k-ω turbulence model (solid yellow lines) tends to overestimate the velocity ratios near the lateral edges of the domain, especially at the lowest probe lines. More intense variations among the models are expected inside the perturbated areas like around the inlet and outlet sections, but, in general, good accordance is underlined. Moreover, the V2F (solid orange lines) and the Realisable k-ε (solid blue lines) formulations exhibit a quasi-identical behaviour in the estimations, both qualitatively and quantitatively.
More appreciable differences are, instead, estimated for the DSF fully open cavity (Figure 13). In this case, the velocity profile calculated by adopting different formulations is more variable. The most intense ventilation is ensured by the Realisable k-ε model, the solid blue lines in the charts, especially in the intermediate space of the cavity and around the probe lines localised at the upper part of the air channel.
Figure 9. Velocity profiles referred to the 2D partially open cavity
Figure 10. Velocity profiles referred to the 2D fully open cavity
Figure 11. Velocity profiles referred to the 3D fully open cavity
On the other hand, the SST k-ω represented by the solid yellow lines in the graphs predicts the lowest velocities compared to the others and, in general, underestimates the expected velocity magnitudes. An intermediate condition between the Realisable k-ε and the SST k-ω model is, finally, obtained by adopting the V2F k-ε formulation. This phenomenon becomes more appreciable near the inlet and outlet section of the multi-layered façade.
A similar trend is also obtained with the three-dimensional model, as depicted in Figure 14. The investigated turbulence formulations describe almost the same ventilation at the inlet zone, and no significant differences can be seen among the obtained results. Also in this case, the SST k-ω model tends to overestimate the velocity magnitudes, especially along the lateral surfaces of the channel and around the probe lines localised in the upper part of the DSF cavity. In general, the results underline significant variations expected inside the intermediate area of the air channel, becoming much more intense at the bottom of the multi-layered façade.
Figure 12. Velocity profiles referred to the investigated probe lines for the 2D partially open cavity model
Figure 13. Velocity profiles referred to the investigated probe lines for 2D fully open cavity model
Figure 14. Velocity profiles referred to the investigated probe lines for the 3D fully open cavity model
The aim of the present research was to evaluate the velocity profiles inside and outside the air channel of a naturally ventilated Double Skin Façade, exploring different configurations, model domains and turbulence formulations. CFD simulations were carried on considering their capability in predicting the air fluxes in the case of complex technologies as multi-layered façades. Preliminary analyses were performed to check the correctness of the adopted simulation hypotheses and assumptions by comparing the obtained estimations with data collected from the literature review and the experimental campaign. Then, a more efficient DSF configuration was suggested and tested by generating bi- and three-dimensional models. Finally, multiple turbulence formulations were implemented, and intercomparisons were presented, highlighting the similarities and differences between the estimated values.
On the basis of the obtained results, the main conclusions of the work can be summarised as follows:
To increase the performance and the ventilation of DSF buildings, fully open inlet and outlet sections should be inserted. The presence, in fact, of more aerodynamic profiles reduces possible friction losses and ensures higher velocity rates, both inside and outside the air channel, in comparison to only partially open cavities.
Bi-dimensional models can describe with good approximation the ventilation profiles of simple DSF systems. The results underline their capability in predicting values inside and outside the air cavity that are in good accordance with the 3D estimations but with lower computational efforts and model complexity.
The implemented turbulence models, both the two k-ε (the V2F and Realisable) and the SST k-ω formulations, underline high correctness in the predictions. They estimate comparable velocity profiles in the whole domain and, specifically, inside the DSF channel. Moreover, reasonable differences are obtained near the interior layers of the air channel for most of the selected probe lines. Instead, more extreme variations are expected in the intermediate space of the cavity and in proximity to the outlet section.
|
DSF |
Double Skin Façade |
|
CFD |
computational fluid dynamics |
|
2D |
bi-dimensional |
|
3D |
three-dimensional |
|
m |
meters |
|
U-RANS |
Unsteady Reynolds-Averaged Navier Stokes |
|
SST |
Menter's shear stress transport |
|
k |
turbulent kinetic energy, m2 s-2 |
|
V2F |
velocity scale for the eddy viscosity |
|
°C |
degree Celsius |
|
min |
minutes |
|
v |
velocity, m s-1 |
|
L |
length of the DSF cavity, m |
|
s |
seconds |
|
h |
height of the probe lines |
|
in |
inlet |
|
out |
outlet |
|
Greek symbols |
|
|
ε, ω |
Dissipation rate of the turbulent kinetic energy, m2 s-3 |
|
Subscripts |
|
|
i |
internal |
|
e |
external |
[1] Ahmed, M.M.S., Abel-Rahman, A.K., Ali, A.H.H., Suzuki, M. (2015). Double Skin Façade: The state of art on building energy efficiency. Journal of Clean Energy Technologies, 4: 84-89. https://doi.org/10.7763/jocet.2016.v4.258
[2] Choi, W., Joe, J., Kwak, Y., Huh, J.H. (2012). Operation and control strategies for multi-storey double skin façades during the heating season. Energy and Buildings, 49: 454-465. https://doi.org/10.1016/j.enbuild.2012.02.047
[3] Uuttu, S. (2001). Study of Current Structures in Double-Skin Façades. Helsinki University of Technology.
[4] Catto Lucchino, E., Gelesz, A., Skeie, K., Gennaro, G., Reith, A., Serra, V., Goia, F. (2021). Modelling Double Skin Façades (DSFs) in whole-building energy simulation tools: Validation and inter-software comparison of a mechanically ventilated single-story DSF. Building and Environment, 199: 107906. https://doi.org/10.1016/j.buildenv.2021.107906
[5] Dickson, A. (2004). Modeling double-skin façades, M.Sc. Thesis, ESRU. University of Strathclyde, Glasgow, UK.
[6] Hensen, J.L.M., Bartak, M., Frantisek, D. (2002). Modeling and simulation of a double-skin façade system. ASHRAE Trans., 108: 1251-1259.
[7] Ji, Y., Cook, M.J., Hanby, V., Infield, D.G., Loveday, D. L., Mei, L. (2008). CFD modelling of naturally ventilated double-skin façades with Venetian blinds. Journal of Building Performance Simulation, 1: 185-196. https://doi.org/10.1080/19401490802478303
[8] Safer, N., Woloszyn, M., Roux, J.J. (2005). Three-dimensional simulation with a CFD tool of the airflow phenomena in single floor double-skin façade equipped with a venetian blind. Solar Energy, 79: 193-203. https://doi.org/10.1016/j.solener.2004.09.016
[9] Paassen, A.H.C., Voorden, M. (2000). Development of simplified tools for evaluation energy performance of double façades. Int Build Phys Conf.
[10] Hanby, V.I., Cook, M.J., Infield, D.G., Ji, Y., Loveday, D.L., Mei, L., Holmes, M.J. (2008). Nodal network and CFD simulation of airflow and heat transfer in double skin façades with blinds. Building Services Engineering Research and Technology, 29: 45-59. https://doi.org/10.1177/01436244080290010401
[11] Tao, Y., Fang, X., Chew, M.Y.L., Zhang, L., Tu J., Shi, L. (2021). Predicting airflow in naturally ventilated double-skin façades: Theoretical analysis and modelling. Renewable Energy, 179: 1940-1954. https://doi.org/10.1016/j.renene.2021.07.135
[12] Xu, L., Ojima, T. (2007). Field experiments on natural energy utilisation in a residential house with a double skin façade system. Building and Environment, 42: 2014-2023. https://doi.org/10.1016/j.buildenv.2005.07.026
[13] Zöllner, A., Winter, E.R.F., Viskanta, R. (2002). Experimental studies of combined heat transfer in turbulent mixed convection fluid flows in double-skin-façades. International Journal of Heat and Mass Transfer, 45: 4401-4408. https://doi.org/10.1016/S0017-9310(02)00160-6
[14] Ding, W., Hasemi, Y., Yamada, T. (2005). Natural ventilation performance of a double-skin façade with a solar chimney. Energy and Buildings, 37: 411-418. https://doi.org/10.1016/j.enbuild.2004.08.002
[15] Naylor, D. Collins, M. (2008). Evaluation of an approximate method for predicting the u-value of a window with a between-panes louvered shade. International Symposium on Advances in Computational Heat Transfer. https://doi.org/10.1615/ichmt.2004.cht-04.710
[16] Marjanovic, L., Cook, M., Hanby, V., Rees, S. (2005). CFD modelling of convective heat transfer from a window with adjacent venetian blinds. Ninth International IBPSA Conference, Montréal, Canada, pp. 709-716.
[17] Papakonstantinou, K.A., Kiranoudis, C.T., Markatos, N.C. (2000). Numerical simulation of air flow field in single-sided ventilated buildings. Energy and Buildings, 33: 41-48. https://doi.org/10.1016/S0378-7788(00)00063-3
[18] Liddament, M.W. (1992). The Role and Application of Ventilation Effectiveness in Design. Conf Pap Proc Int Symp Room Air Convect Vent Eff., 59-75.
[19] Montelpare, S., D’Alessandro, V., Lops, C., Costanzo, E., Ricci, R. (2019). A Mesoscale-Microscale approach for the energy analysis of buildings. IOP Conf. Series: Journal of Physics: Conf. Series 1224. https://doi.org/10.1088/1742-6596/1224/1/012022
[20] Dama, A., Angeli, D., Larsen, O.K. (2017). Naturally ventilated double-skin façade in modeling and experiments. Energy and Buildings, 144: 17-29. https://doi.org/10.1016/j.enbuild.2017.03.038
[21] Chen, Q., Srebric, J. (2002). A procedure for verification, validation, and reporting of indoor environment CFD analyses. HVAC and R Research, 8: 201-216. https://doi.org/10.1080/10789669.2002.10391437
[22] Pasut, W., De Carli, M. (2012). Evaluation of various CFD modelling strategies in predicting airflow and temperature in a naturally ventilated double skin façade. Applied Thermal Engineering, 37: 267-274. https://doi.org/10.1016/j.applthermaleng.2011.11.028
[23] Kalyanova, O. (2008). Double-Skin Façade – Modelling and Experimental Investigations of Thermal Performance.
[24] Larsen, O.K., Heiselberg, P., Jensen, R.L. (2014). Experimental data and boundary conditions for a Double-Skin Façade building in external air curtain mode. DCE Tech Memo., 38: 1-24.
[25] Kalyanova, O., Heiselberg, P., Felsmann, C., Poirazis, H., Strachan, P., Wijsman, A. (2009). An empirical validation of building simulation software for modelling of double-skin façade (DSF). Eleventh International IBPSA Conference, Glasgow, Scotland, pp. 1107-1114. http://www.sbi.dk/download/bsim/BS09_P493.pdf.
[26] Versteeg, H., Malalasekera, W. (1995). An Introduction to Computational Fluid Dynamics. Educational Building. 1-503.
[27] Coussirat, M., Guardo, A., Jou, E., Egusquiza, E., Cuerva, E., Alavedra, P. (2008). Performance and influence of numerical sub-models on the CFD simulation of free and forced convection in double-glazed ventilated façades. Energy and Buildings, 40: 1781-1789. https://doi.org/10.1016/j.enbuild.2008.03.009
[28] Janssens, B., Bosschaerts, W. (2016). Study of the airflow window. Energy Procedia, 85: 303-310. https://doi.org/10.1016/j.egypro.2015.12.256
[29] CD-ADAPCO. (2008). STAR CCM+ User Guide (Version 4.02). 1-406.
[30] Lops, C., Germano, N., Matera, S., D’Alessandro, V., Montelpare, S. (2021). CFD Modelling of naturally ventilated double skin façades: Comparisons among 2D and 3D models. TECNICA ITALIANA-Italian Journal of Engineering Science, 65: 330–336. https://doi.org/10.18280/ti-ijes.652-429