Saidjon Sheralievich Tavarov* | Alexander Ivanovich Sidorov | Olamafruz Olimovich Sultonov
© 2021 IIETA. This article is published by IIETA and is licensed under the CC BY 4.0 license (http://creativecommons.org/licenses/by/4.0/).
OPEN ACCESS
The article examines the influence of variable factors on the operating mode of the urban electrical network (the presence of other energy sources, house designs, climatic and meteorological factors, the welfare of the population). The coefficient of accounting for variable factors is derived. To assess the impact on the network operating mode, a computer model was built, the use of which made it possible to develop a method, and on its basis, a device that allows you to control the network operating mode.
electrical networks, variable factors, voltage unbalance, network mode control device
Electricity consumption in urban electrical networks continues to be relevant due to the constant increase in electrical loads caused by household electrical appliances. The problem of control and management of operating modes in urban electrical networks is no less urgent due to the use of single-phase electrical consumers by household consumers, which affect the energy efficiency of networks. Improving the energy efficiency of urban electrical networks, in particular, by household electrical consumers, is possible with the correct forecasting of electricity consumption, taking into account the most significant factors.
The mode of operation of electrical networks, in particular, urban networks with public utilities, differs significantly from the electrical networks of industrial enterprises. This difference is associated with the use of three-phase electrical receivers, while in urban electrical networks; most of them are single-phase electrical receivers. It manifests itself in the form of uneven power consumption, leading to unbalance of currents and voltages, as well as the appearance of currents and voltages on the neutral conductor [1-5].
The unevenness of power consumption is significantly influenced by the well-being of the population, the provision of consumers with other energy sources (heat and hot water supply and gas supply), the construction of residential buildings and climatic and meteorological factors [4, 5], hereinafter referred to as variable factors. Determination of the dependence of the unevenness of power consumption on the above variable factors is very important for the urban electrical network of Dushanbe. This is due, first of all, to the need to reduce electricity losses and improve the reliability of the power supply system.
To improve the quality of the voltage in the distribution network, it is necessary to balance the voltages, for which balancing devices are used in the transformer [6-8], which increases the cost of 6-10/0.4 kV transformers. Note that after balancing the voltage, the transformer operates in overload mode. To eliminate this mode, a semiconductor converter with renewable energy sources (RES) can be connected in parallel to the transformer. Depending on the location of consumers, you can choose the type of RES source. For an urban network, this can be a solar panel (Figure 1a), and for rural networks, a mini hydroelectric power station with a semiconductor converter (Figure 1b). When solar panels (SP) operate in parallel with a city grid or mini-hydro electric power plants with a semiconductor converter (S/C) in rural networks, due to the control of semiconductor converters, voltage unbalance is completely reduced, thereby increasing the quality of electricity, reducing overload.
Figure 1. Block diagram of RES connection to the network depending on the location of consumers
2.1 Theoretical part
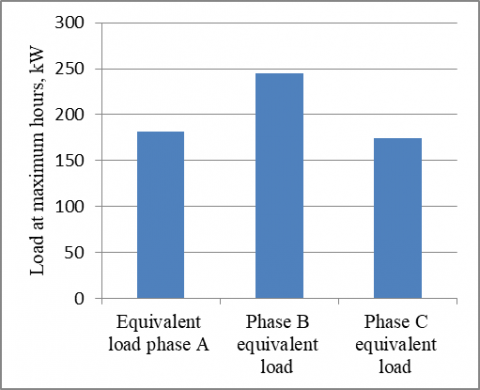
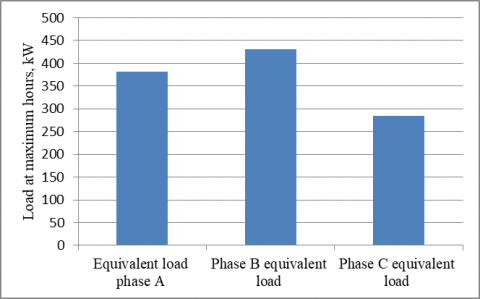
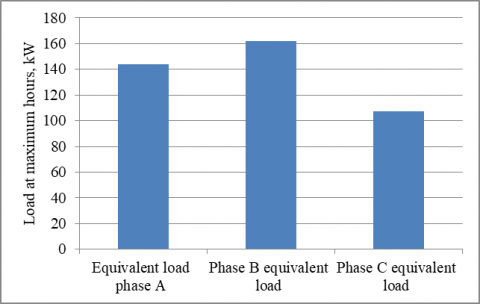
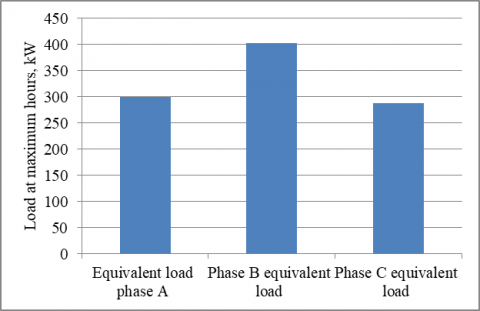
Based on the developed method of forecasting power consumption and the factor of accounting for variable factors [9] based on the data of monthly power consumption on winter days for groups of consumers connected to five consumer transformer substations 6/0.4 kV, receiving power from one cell of the Aviator substation in Dushanbe equivalent electrical loads at peak hours were determined (Figures 2-6).
Note that the main irregularities in power consumption are observed in the winter period in the evening and morning highs [10-14]. The number of consumers, according to the survey, connected to each phase was:
- for TS B3 - 20;
- for TS B4 - 53;
- for TS B5 - 20;
- for TS B6 - 20;
- for TS B2 - 33.
Modelling the factor accounting for variable factors$-\alpha_{i}$, we perform according to the previously obtained equation [9]:
$\alpha_{i}=\left(\left(t_{i} \cdot h+s\right) /(s+k)\right)$, (1)
where, $\left(\mathrm{t}_{\mathrm{i}} \cdot \mathrm{h}+\mathrm{s}\right)$·- generalizing coefficient, taking into account temperature, geographic (height above sea level) and constructive and technological coefficients;
s - consumer welfare, an analogue of income in the Tornquist function;
k - coefficient that takes into account the dynamics and seasonal fluctuations in consumer welfare;
i – a month of observation.
It should be noted that according to the studies carried out for these sections of the electrical network, the duration of the evening maximum load was 3-3.5 hours [9, 15].
According to the total readings of electricity meters installed at consumers and connected to different phases obtained during maximum hours (winter and evening days) using the derived equation of power consumption given in a previously published work [9] and based on the analysis of the data obtained, it was possible to put forward an assumption about the dependence of power consumption on some parameters. The method of achieving the goal was mathematical modelling and the proposal of the coefficient for accounting for variable factors -$\alpha_{i}$, Eq. (1). Application, which for a real operating electrical distribution network of 6/0.4 kV made it possible to establish the difference in the total electrical load in phases during peak hours.
The solution shows that the values $\alpha_{i}$ are in the range from 0.273 to 0.4286, which exceeds the values set by OJSC «Barki Tojik» for single-phase household consumers.
Based on the results obtained (Figures 2-6), it was found that the relative difference in the load between the phases during the hours of maximum is in the range from 10.8 to 36.16%, which also confirms the unevenness of the load across the phases during the hours of maximum.
Figure 2. Equivalent load during peak hours for TS B3
Figure 3. Equivalent load during peak hours for TS B4
Figure 4. Equivalent load during peak hours for TS B5
Figure 5. Equivalent load during peak hours for TS B6
Figure 6. Equivalent load during peak hours for TS B2
To assess the operating mode of the considered electrical network in the Matlab environment, a computer model was looked at. All parameters of the considered sections of the investigated electrical network with a voltage of 6-0.4 kV (brand, cross-section and length of cable lines (CL), types and capacities of transformer consumer substations (TCS) (ТS В2-В6)) correspond to a real electrical network. Table 1 shows the raw data for this network.
Figure 7 shows in the form of blocks a computer model of a part of the urban electrical network with the specified parameters corresponding to Table 1, and the equivalent load connected to it during the maximum hours for the phases of household consumers (Figures 2-6). In this case, block B1 corresponds to the power supply. To clarify the content of the blocks, as an example, Figure 8 shows section B3 of the considered part of the urban electrical network.
According to Figure 8, the section of the city electrical network consists of a 6 kV supply cable, a 6/0.4 kV step-down consumer transformers, a 0.4 kV supply cable, a measuring device and an equivalent single-phase electrical load. All parameters of both this section (Figure 8) and the entire urban electrical network under consideration (Figure 7) were set following the above data.
Table 1. Initial data of the simulated electrical network
|
S/N |
Name |
В3 |
В4 |
В5 |
В6 |
В2 |
|
|
1 |
Type and capacity of TCS |
OT-400 |
OT -1000 |
OT -400 |
OT -400 |
OT -630 |
|
|
2 |
Brand and section, KL-0.4 kV, mm2 |
XLPE AC -4×150 |
XLPE AC 4×185 |
XLPE AC -4×185 |
XLPE AC -4×150 |
XLPE AC -4×185 |
|
|
3 |
Length of cable line-0.4 kV, m. |
220 |
300 |
280 |
350 |
347 |
|
|
Plots |
|||||||
|
S/N |
Name |
Cell №8-В1 |
В1-В3 |
В2-В5 |
В3-В4 |
||
|
1 |
Brand and section, KL-6 kV, mm2 |
aluminum lead armored -3×185 |
aluminum lead armored -3×240 |
aluminum lead armored -3×185 |
aluminum lead armored -3×185 |
||
|
2 |
Length of cable line-6 kV, m. |
550 |
450 |
538 |
307 |
||
Figure 7. Computer model of a part of the urban electrical network in the form of blocks (B1-B6)
Figure 8. Section of the considered part of the urban electrical network
2.2 Practical part
Using the constructed computer model of the urban electrical network (Figure 7) with the help of measuring instruments, the operating mode of the urban electrical network was assessed with a change in variable factors. The operating mode of the city electrical network was assessed according to the following parameters:
- voltage asymmetry;
- current asymmetry;
- currents of direct, reverse and zero sequences;
- voltages of direct, reverse and zero sequences.
The results of modelling the operating mode during the hours of maximum loads, obtained in the Matlab environment using measuring instruments, are presented in Table 2.
The results of modelling the operating mode during the hours of maximum loads given in Table 2 confirm the influence of variable factors on the operating mode, especially during the hours of maximum loads. A violation leads to a decrease in the quality of electricity and a decrease in the reliability of the power supply system.
Thus, when developing methods for monitoring and controlling the modes of operation of urban electric networks in the conditions not only of Dushanbe but also of the entire Republic of Tajikistan, it is necessary to take into account the variable factors that are given and described in this work.
Table 2. Results of modelling the operating mode during the hours of maximum loads
|
S/N |
Name |
В3 |
В4 |
В5 |
В6 |
В2 |
|
|
1 |
Voltage unbalance, V |
phase A |
198.9 |
157.6 |
197.5 |
184.9 |
167.2 |
|
phase B |
173.1 |
144.9 |
171.1 |
173.6 |
138.8 |
||
|
phase C |
200.7 |
182.6 |
199.2 |
207.7 |
168.6 |
||
|
2 |
Straight voltage, reverse and zero sequences, V |
U1 |
190.8 |
161.6 |
189.1 |
188.6 |
158.1 |
|
U2 |
4.56 |
7.08 |
4.71 |
5.44 |
5.97 |
||
|
U0 |
13.45 |
15.32 |
13.67 |
14.93 |
13.56 |
||
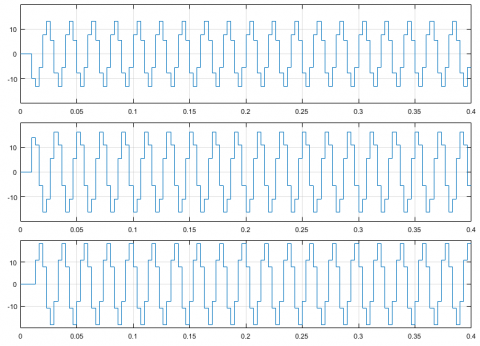
To solve the problem of voltage asymmetry, the following method and device for controlling the mode of the urban electrical network are proposed: In cases of connected unbalanced loads: Pa ≠ Pb ≠ Pc. The indicator of the oscilloscope of a three-phase meter installed at the consumer both in Figure 8 and in other sections of Figure 7 will look like Figure 9.
Figure 9. Voltage unbalance in section B3
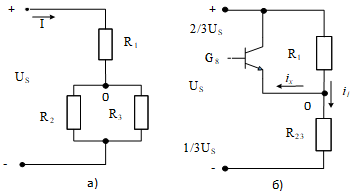
Figure 10. The original equivalent circuit without balancing (a) and the equivalent circuit with balancing (b)
To solve the problem of balancing the voltage, the following method is proposed (Figure 10). With the help of additional resistance (in Figure 10, b this is a controlled key G8), we add or subtract the current to the common point of the star, in order in this case to ensure a voltage drop across the resistance R2, equal to 2/3Us.
After adding, we get a timing diagram of the balancing current (Figure 11).
Figure 11. Balancing current
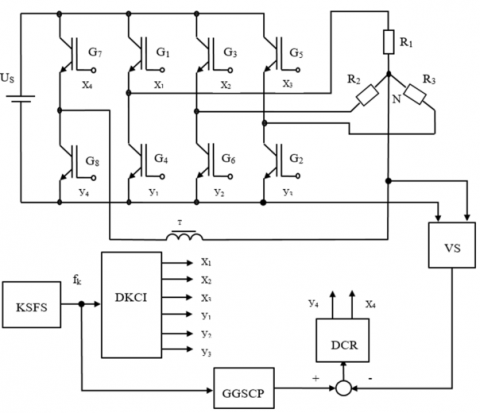
Figure 12. Implementation diagram of the balancing device
For the balancing operation to be carried out automatically by introducing feedback on the voltage of the common point of the star relative to the bus minus the source, it is necessary to put a voltage sensor of this point relative to the body. This is because the system additionally connects the common point to the plus or minus bus and, according to the voltage sensor signals, affects the current regulator, which is shown in Figure 12 [6-8].
A block diagram of a device that implements the stated principle is shown in Figure 12, where it is indicated: G1 – G6 - main power switches of the voltage inverter; G7, G8 - keys of an additional stand designed for voltage balancing; R1 – R3 - load resistance.
The device works as follows. The given switching frequency of the keys fk = 300 Hz is created by the KSFS and fed to the DKCI, which generates pulses for controlling the inverter keys with a frequency of 50 Hz and a duration of 180 el. gr. Due to this, a three-phase output voltage is formed at the output of the inverter. In symmetrical operation, the potential of the common point relative to the minus bus varies from 0.33 to 0.66Un. Since the potential periodically changes from cycle to switching cycle, it can be conventionally assumed that the potential is high at an even cycle, and low at an odd cycle.
In this case, one of the pulses at the DKCI output, for example, x1, can be taken as the reference point. Then, using the GGSCP, we can form the value of the potential of the common point Uon corresponding to the symmetric load at even and odd cycles. In the case of unbalanced load, the waveform at the neutral point Uof changes. Having determined the voltage difference Uon and Uof, we can use the Th. using the signals x4, y4 to form a current that compensates for the asymmetry. For this, a discrete current regulator operating at a given cycle can be used, realizing, for example, a proportional-integral (PI) control law. The regulator acts on keys G7 and G8, changing the duty cycle of their control voltage. At high frequency, these switches together with the choke Th. form a current source.
Based on the previously obtained results of modelling the operating mode during the hours of maximum loads (Table 2) using the developed method and the network operating mode control device for the remaining sections, this device was connected to control the established operating model. The results are shown in Table 3.
As can be seen from the results obtained, the proposed method allows you to control the operating mode of the urban electrical network. At the same time, the results obtained do not exceed the permissible signs.
Table 3. Results of the established network operation mode
|
S/N |
Name |
В3 |
В4 |
В5 |
В6 |
В2 |
|
|
1 |
Voltage unbalance, V |
phase A |
222 |
240.2 |
243.5 |
235.4 |
245.3 |
|
phase B |
191.5 |
230.5 |
222.7 |
228.5 |
218.8 |
||
|
phase C |
225.5 |
243.2 |
242 |
242.1 |
247.8 |
||
|
2 |
Straight voltage, reverse and zero sequences, V |
U1 |
212.8 |
240.2 |
243.5 |
242.2 |
237.1 |
|
U2 |
4,233 |
0,167 |
0,092 |
0,027 |
0,15 |
||
|
U0 |
17.30 |
20.48 |
14.70 |
14.27 |
19.23 |
||
Based on the derived factor of accounting for variable factors and according to the data on the electricity consumption of household consumers during the hours of maximum loads, the loads were determined in phases during the hours of the evening maximum. It was found that variable factors due to the absence of other energy sources have a significant impact on the operating mode. To assess the operating mode of the urban electrical network in the Matlab environment, a computer model was built, with the help of which the operating mode of the electrical network was simulated. The results of modelling the mode of operation of the urban electric network confirmed the influence of variable factors on its mode of operation, especially during peak load hours. On the basis of the results obtained for the control of the operating mode of the urban electric network, a method and device are proposed that made it possible to control the operating mode of the urban electric network without violating the permissible values.
|
VS |
zero point voltage sensor relative to the minus bus of the power supply |
|
KSFS |
key switching frequency setting |
|
DKCI |
distributor of key control impulses |
|
GGSCP |
generator of the set point voltage of the common point |
|
DCR |
discrete current regulator |
|
fk |
switching pulse counter |
|
T |
Throttle |
[1] Valeev G.S., Dzyuba M.A., Valeev R.G. (2016). Modelling daily load schedules of distribution networks with voltage of 6-10 kV in cities and towns in conditions of limited initial information. Bulletin of South Ural State University. Series Power Engineering, 16(2): 23-29. https://doi.org/10.14529/power160203
[2] Omorov T.T., Takyrbashev B.K., Osmonova R.Ch. (2020). On the problem of mathematical modelling of a three-phase asymmetric distribution network. Power Engineering: Research, Equipment, Technology, 22(1): 93-102. https://doi.org/10.30724/1998-9903-2020-22-1-93-102
[3] Vyalkova S.A., Nadtoka I.I. (2020). Forecasting daily graphs active energy consumption of a megapolis taking into account forecast data of daylight illumination. Russian Electromechanics, 63(5): 67-71. http://dx.doi.org/10.17213/0136-3360-2020-5-67-71
[4] Repkina N.G. (2015). Research of factors affecting the accuracy prediction daily power consumption. Russian Electromechanics, 2: 41-43. http://dx.doi.org/10.17213/0136-3360-2015-2-41-43
[5] Sidorov A., Tavarov, S. (2021). Enhancing reliability of electricity supply of city electric networks cities of Dushanbe. Bulletin of Electrical Engineering and Informatics, 10(1): 46-54. http://dx.doi.org/10.11591/eei.v10i1.2114
[6] Suresh D., M. Rao D., Sukumar G.D. (2016). Reduced rating hybrid DSTATCOM for three-phase four wire distribution system. IEEE 1st International Conference on Power Electronics, Intelligent Control and Energy Systems (ICPEICES): 1-4. http://dx.doi.org/10.1109/ICPEICES.2016.7853646
[7] Mokhtari, M., Golshannavaz, S., Nazarpour, D., Aminifar, F. (2011). Design of an asymmetrical three-phase inverter for load balancing and power factor correction based on power analysis. Journal of Electrical Engineering & Technology, 6(3): 293-301. http://dx.doi.org/10.5370/JEET.2011.6.3.293
[8] Tavarov S.S., Sidorov A.I. (2021). Power consumption modeling in urban electric networks of 0.4–10 kV of the Republic of Tajikistan. Advances in Systems, Control and Automations, 739: 866-876. https://doi.org/10.1007/978-3-030-71119-1_84
[9] Tavarov, S.S., Sidorov, A.I., Kalegina, Y.V. (2020). Model and algorithm of electricity consumption management for household consumers in the republic of Tajikistan. Mathematical Modelling of Engineering Problems, 7(4): 520-526. https://doi.org/10.18280/mmep.070403
[10] Aqdas, N., Muhammad, U.J., Nadeem, J., Tanzila, S., Musaed, A., Khursheed, A. (2019). Short-Term electric load and price forecasting using enhanced extreme learning machine optimization in smart grids. Energies, 12(5): 866-876. http://dx.doi.org/10.3390/en12050866
[11] To, W.M., Lee, P.K.C., Lai, T.M. (2017). Modeling of monthly residential and commercial electricity consumption using nonlinear seasonal models-the case of Hong Kong. Energies, 10(7): 885-894. https://doi.org/10.3390/en10070885
[12] Seunghyoung, R., Jaekoo, N., Hongseok, K. (2017). Deep neural network based demand side short term load forecasting. Energies, 10(1): 3-11. http://dx.doi.org/10.1109/SmartGridComm.2016.7778779
[13] Sidorov, A.I., Tavarov, S.S., Khanzhina, O.A. (2020). The algorithm of electricity consumption control by household consumers based on smart electricity meters in the Republic of Tajikistan. Global Smart Industry Conference (GloSIC): 15-19. https://doi.org/10.1109/GloSIC50886.2020.9267815
[14] Claudio, B.M., Carlos, H.C., Roberto, C., Doris, S., Mark, S., Alessandro, C., Helmo, K., Morales, P. (2017). Experimental evaluation of a CPT-based 4-leg active power compensator for distributed generation. IEEE Journal of Emerging and Selected Topics in Power Electronics, 5(2): 747-759. https://doi.org/10.1109/JESTPE.2016.2633064
[15] Sidorov, A.I., Tavarov, S.S. (2020). Method for forecasting electric consumption for household users in the conditions of the Republic of Tajikistan. International Journal of Sustainable Development and Planning, 15(4): 569-574. https://doi.org/10.18280/ijsdp.150417