Elisa Kusrini* | Suci Miranda
© 2021 IIETA. This article is published by IIETA and is licensed under the CC BY 4.0 license (http://creativecommons.org/licenses/by/4.0/).
OPEN ACCESS
Performance measurement in supply chain management is essential to facilitate the company to achieve effectiveness and efficiency to meet customer satisfaction. One of the models to measure performance in the supply chain is SCOR version 12. This model presents a business process framework, performance indicators, best practices, and unique technologies to support communication and collaboration between supply chain partners to increase the effectiveness of supply chain management and the effectiveness of supply chain improvements. This research used SCOR 12.0 to identify the performance metrics within the supply chain. A make-to-order small-medium enterprise (SMEs) in Yogyakarta, Indonesia, is the object of the research. We portrayed the business scope diagram by identifying the process elements in each tier (plan, source, make, deliver, return, enable) and decomposing each Process into performance attributes, i.e., Reliability, responsiveness, agility, cost, and asset management efficiency. We obtained three performance attributes (Reliability, responsiveness, and cost) based on observation and interviews, 52 performance metrics spread into 47 process elements. The SMEs can use the performance metric framework to measure supply chain management performance in make-to-order products.
performance measurement, performance metric, SCOR 12, supply chain management
Economic growth has encouraged the company to conduct development and improvement, correlated with competition [1]. Competition becomes a challenge for companies to keep their position in the market to fulfill the customer need and gain more customers [2]. Maintaining customer satisfaction is a key to achieve success and continuity of the business [3].
Customer satisfaction generating from a good supply and Supply Chain Management (SCM) is a set to integrate all actors involve efficiently. Thus, the product is produced and distributed in the right quantities, to the correct location, and at the right time to minimize system-wide cost while satisfying service level requirements [4]. Yet, according to Greenwood and Van Buren III [5], SCM is complex and inconsistent, needs good communication from all stakeholders. To maintain it, the company needs to measure the SCMP (Supply Chain Management Performance). Analysis performance of supply chain management is an essential aspect for the success [6] and to ensure whether or not the performance is still effective and efficient for fulfilling customer satisfaction [7].
Since supply chain management performance is essential for long-term business, it requires to be measured. A process reference model is a concept of business process reengineering, benchmarking, and process measurement into a cross-functional framework. The reference model of supply chain operations (SCOR) is a management tool used to address, improve, and provide supply chain management decisions within a company and with company suppliers and customers [8]. This model describes the business processes needed to meet customer demand. It also helps explain procedures throughout the supply chain and provides a basis for improving these processes. The model catches the "as-is" of a circle for business process reengineering and obtains the "candidate" desired condition. They are benchmarking means that the model measures the operational performance of similar companies and set internal targets based on the results of "best-in-class." Once the result in "best-in-class" performance is gained, characterizing management practices and software solutions can build a best practices analysis.
A literature review of more than 450 papers from 1998 to 2018 was conducted by Ka et al. [9]. Related to SCOR, 2.16% of articles have applied the SCOR approach in various areas such as small and medium enterprises in India and pharmaceutical supply chain distributors. They identified the critical performance to reduce the complexities of the Supply Chain using SCOR and the combination of SCOR and BSC, and SCOR and DEA. There are the most commonly used approaches to supporting Supply Chain Management to achieve better performance; Key Performance Indicators (KPIs), Balanced Scorecard (BSC), Total Cost of Ownership, and Life Cycle Assessments (TCO/LCA), and Maturity Assessments [10]. The KPIs are a few strategically important metrics provided by Supply Chain Council, namely SCOR.
SCOR is a tool for evaluating, communicate all tiers when deciding. SCOR integrates all the business processes, performance metrics, practices, and people skills into the unified structure. The scope of SCOR describes the business activities that can be linked to each other with all phases of satisfying customer demand. Six primary management processes support the model (Plan, Source, Make, Deliver, Return, Enable) and Performance attributes (Reliability, Responsiveness, Agility, Cost, and Asset Management) [8].
SCOR is a process-based performance measurement method with many advantages. SCOR has a framework that captures the consensus view of supply chain management. It provides a unique framework that links business processes, metrics, best practices, and technology for support communication among supply chain partners using a common language to communicate supply chain definitions, metrics, and best practices to all interested parties. SCOR applies detailed supply chain metrics to measure supply chain performance, provides alignment of metrics and activities across organizational boundaries, and defines a shared repository of supply chain performance terms and tools [8, 11].
However, on the other hand, SCOR has many weaknesses. One of the main difficulties is the complexity of SCOR, making it easy to miss something and generate an invalid model for supply chain action. For implementing the SCOR model, Organizations must conduct extensive training [11]. Modeling by SCOR requires a good knowledge of the actual operation of the activities and conducting studies in the field [12]. Based on the Ref. [13], implementation of SCOR in the automotive sector has many metrics proposed by the SCOR. This step makes the task of selecting and tracking all these metrics long and tedious.
Although it has weaknesses, the score is very effective for measuring SCM performance. Application of SCOR in make-to-order (MTO) small-medium enterprises (SME) is still rarely done. Small and medium-sized enterprises (SME) are a key to creating new economic sources in Indonesia and have contributed toward gross domestic product in Indonesia [1]. Hence, this sector has an essential role in improving. Therefore, this study aims to identify the performance metrics within its supply chain based on SCOR 12 management processes and performance attributes. Measuring the score of supply chain performance is excluded. It is required to determine the standard description of the management process and frame the relationship among those legal processes. It does not quantify the performance yet.
Furthermore, it has not been found any similar company measured its supply chain performance. Thus, we built the standard metrics based on our case study, an SME producing jerseys such as a t-shirt and short pants. The results found will be used for Process reengineering within the company and benchmark similar companies to measure their supply chain performance.
We conducted several stages of the research. The first stage is observing business processes by identifying the flow of material and information within the company. The second stage decomposes the Process into elements/activities. The next step is to identify performance indicators based on the score dictionary and verify the proposed performance indicators.
We conducted the study in an SME in Yogyakarta, Indonesia, producing a make-to-order jersey. The data were obtained by survey, observation, and interviews with the owner and operators. The operators are from the production and administration departments. The interviews consist of open-ended questions and a questionnaire. The study applied SCOR 12 model consisted of 6 core management processes (plan, source, make, deliver, return, and enable) and five performance attributes (Reliability, responsiveness, agility, costs, and asset management).
Regarding precise performance for SMEs, KPI is selected based on observation of Process, and proposed KPI is distributed to the company (owner and staff) to evaluate and validate them. We provided several possible performance metrics that could match with the company's condition to the Interviewees. Interviewees were allowed to suggest new indicators and to rejected proposed indicators.
The study produces three models to support the objectives:
1. The business process for make-to-order SMEs. It is pictured “as-is” condition for the standard description of the management process.
2. The material flow focuses on level 2 process connectivity.
3. The workflow or process models: highlights information, material, and workflow; communication, people, and system interaction.
The processes obtained in level 2 are decomposed into level 3, called performance attributes. It defines its ability to compete successfully in its chosen market for each process level defined in level 2. It is used for the standard metrics to measure the process framework.
We obtained three models based on business process observations and interviews: business scope, thread diagrams, and workflow/process diagrams. These three models are to understand the processes that occur in each department and describe the flow of material and information between operations. Based on the process workflow, the Process is decomposed into more detailed elements to determine the performance attributes and metrics that we proposed to measure SME performance.
3.1 Business process
The supply chain case study is a make-to-order jersey product at an SME in Yogyakarta, Indonesia. It has never measured its performance of the supply chain. The company found that it has taken a long time to deliver product delivery while expanding its market share by increasing the production quantity each month. To improve the performance, the company needs to understand its current implementation of supply chain management. Before measuring its supply chain performance, building the KPI (Key Performance Indicator) related to a clothes factory is required.
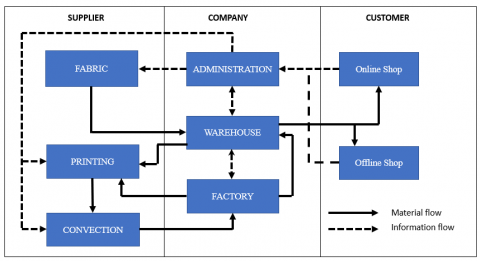
The leading company activities are designing the logo printing and packaging. Other suppliers, namely printing company carry out different suppliers to print the logo on the jersey fabric and confection company to sew the jersey ordered. Thus, it has two kinds of suppliers: goods suppliers for Fabric and service suppliers for printing and sewing.
The business process in SME jersey is as follows. Customers place orders offline or online. Administrative staff plan material requirements and place orders for fabrics to suppliers. The supplier will send the Fabric according to the purchase order. According to the customer's order, the design staff designs the clothing logo and sends it to a partner (third party) called the printing department along with the Fabric. Then, the printing department will send the printed Fabric to a confection partner for sewing. After completion, the confection sends the clothes to the company warehouse for packaging. The product is ready to be sent to the customer. Figure 1 shows the Business Proses.
3.2 Thread diagram
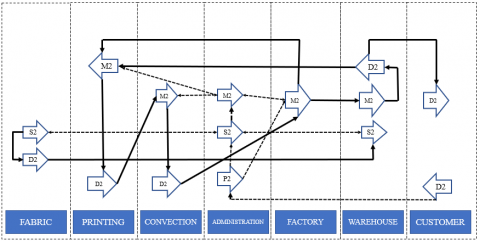
In terms of understanding the Process conducted in each tier, a thread diagram determines the material and information flow among stories. This diagram identifies level 2 consisted of process categories of each tier decomposed from the business scope diagram. The Process carried out in each section is described by level 2 processes in the SCOR 12 model with make-to-order categories, namely Source Make-To-Order (S2), Make-To-Order (M2), Deliver Make-To-Order product (D2). Solid lines represent material flow, and dash lines represent information flow. According to the thread diagram in Figure 2, material flow from Fabric to the customer with the sequence of process activities.
Figure 1. Business process diagram
Figure 2. Thread diagram
As shown in Figure 2, plan, source, and make Processes are in administration. The operators prepare the packaging in the warehouse before delivering the ordered jersey to the customer, both offline and online. This study did not include the make Process at fabric suppliers. The company only collects some amount of Fabric if it lacks material at the warehouse. Each tier is customer and supplier as well one to another. For instance, printing service is a warehouse customer that the warehouse will send the material to the printing. The printing service becomes a supplier for confection which the printing service delivers the logo printed on the materials to the confection for sewing.
3.3 Process models
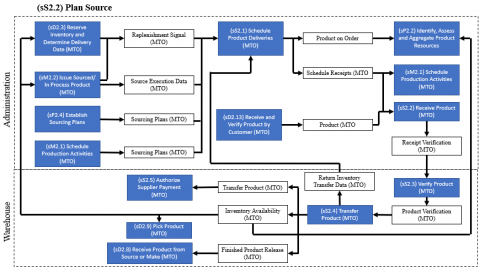
Process models describe the workflows with the SCOR processes and present detailed process element information for each level 2 process category. It was required to determine the process element (level 3) by observing process business to create a workflow and then choosing all performance elements related to MTO (make-to-order) based on SCOR 12 standard process terminology. SCOR 12 has explained in detail the workflow of each performance element. The workflow Source process, as an example, as illustrated in Figure 3.
Reserve Inventory and Determine Delivery (sD2.3), Issues Sourced/In Process Product (sM2.2), Establish Sourcing Plans (sP2.4), and Schedule Production Activities (sM2.1) are the predecessor of Schedule Product Deliveries (sS2.1). These process elements produce different documents used for sS2.1. The output of sS2.1, product on order, is the input for other performance elements, i.e., sP2.2, sM2.1, and sS2.2. Receipt verification (MTO) obtained in administration is employed to verify products conducted in the warehouse. The rest process has a similar Process of workflow identification. They do not stand alone but are preceded by other performance elements, whether carried out by a department or another department.
We obtained these metrics for the Key Performance Indicator provided by SCOR 12. For instance, there are four performance elements and four performance metrics in each element's plan process. In contrast, we excluded other performance elements such as Plan Supply Chain, Plan Make, Plan Delivery, Plan Return, and Plan Enable. Plan sources identify material resources, balance product resources with product requirements, and establish sourcing plans to meet supply chain requirements. According to SCOR 12 model, in sP2, one performance metric measures each performance element (sP2.2- sP2.4) but sP2.1. It has two metrics: Reliability (RL. 3.37) and responsiveness (RS. 3.41). Yet, we did not use RL. 3.37 (forecast accuracy) since the product is make-to-order, the company has never counted any forecast since the product is make-to-order. Table 1. describes an example of a Key Performance Indicator of the Plan Process.
Figure 3. Plan source workflow
Table 1. Example of key performance indicator of plan process
|
Supply Chain Operation Reference Version 12.0 |
||||
|
Level 1 |
Level 2 |
Level 3 |
Performance Metrics |
Performance Attribute |
|
(sP) Plan |
(sP2) Plan Source |
(sP2.1) Identify, Prioritize, and Aggregate Product Requirements |
(RS. 3.41) Identify, Prioritize and Aggregate Product Requirements Cycle Time |
Responsiveness |
|
|
|
(sP2.2) Identify, Assess and Aggregate Product Resources |
(RS. 3.38) Identify, Assess, and Aggregate Product Resources Cycle Time |
Responsiveness |
|
|
|
(sP2.3) Balance Product Resources with Product Requirements |
(RS. 3.12) Balance Product Resources with Product Requirements Cycle Time |
Responsiveness |
|
|
|
(sP2.4) Establish Sourcing Plans |
(RS. 3.29) Establish Plans Cycle Time |
Responsiveness |
3.4 Process categories and process elements
Performance attributes consist of Reliability, responsiveness, agility, cost, and assets management. Reliability, responsiveness, and cost are associated with customer-facing, while cost and assets management focuses on internal performance. In this study, we found two attributes in customer orientation, and an attribute was internal. Reliability means performing tasks as expected: on time, the correct quantity, the right quality. Responsiveness is the speed of performing the processes, including cycle-time metrics.
In comparison, costs refer to operating the supply chain processes such as material costs, labor costs, and management and transportation cost. In this study, we found two attributes in customer orientation, and an attribute was internal. According to [8], several performance metrics measure each performance element (level 3). Yet, this study did not involve all metrics but those that match the company's supply chain based on the interview with the owner and operators. We identified 47 process elements (level 3) and 52 performance metrics spread within the entire supply chain based on the business scope diagram above. Of 52, 28 metrics are performance attributes of responsiveness followed by Reliability (18 metrics) and cost (6 metrics). The following Table 2 shows the detailed performance metrics.
According to the SCOR model, several process elements applied the same metrics: Order Management Costs (CO. 3.14) found in sD. 2.1 (Process Inquiry and Quote), sD. 2.2 (Receive, Configure, Enter, and Validate order), sD. 2.3 (Reserve Inventory and Determine Delivery Date), sD. 2.4 (Consolidate Orders), sD. 2.5 (Build Loads), and sD. 2.6 (Route Shipments). These process elements belong to Delivery Make-to-Order Product (sD2). Another repeated metrics was RL. 3.33 (Delivery Item Accuracy), RL. 3.34 (Delivery Location Accuracy), RL. 3.35 (Delivery Quantity Accuracy), RL. 2.22 (Delivery Performance to Customer Commit Date), RL. 2.4 (Perfect Condition), and RL. 2.3 (Documentation Accuracy), which was also in the sD2 process category. In enable Process, Manage Supply Chain Asset (sE4), the same metrics will measure all process elements involved: RS. 3.56 (Manage Capital Asset Cycle Time), RS. 3.64 (Manage Integrated Supply Chain Capital Asset Cycle Time, and RS. 3.67 (Manage MAKE Equipment and Facilities Cycle Time).
Enable Process related to establishing, maintaining, and monitoring information, relationships, resources, assets, business rules, compliance, and contract required to operate the supply chain and monitoring and managing the supply chain's overall performance, SCOR explained. Manage supply chain human resources (sE4) and Manage supply chain assets (sE5) were considered in this study, particularly any activities to ensure staff is available at the proper levels and other activities necessary to sustain supply chain execution. In this case, the company has three suppliers for providing material (Fabric) and service (printing and sewing). As we mentioned before, the main activities within the company are designing the logo for the jersey, packing, and shipping the orders. Choosing suppliers for printing and sewing is also part of this enable Process of managing supply chain human resources to satisfy the skills and competency requirement. However, we do not include the training and hiring processes but focusing on identifying the skill/resource requirement, matching the available skill/resource with the condition, determining training/education for staff, and determining the hiring process.
3.5 Performance attributes and performance metrics
There are six metrics of costs in Deliver, Return, Enable. They are order management costs (CO. 3.14), cost to deliver (CO. 2.4), cost to verify product (CO. 3.10), cost to return (CO. 2.5), cost to make (CO. 2.3), and direct labor cost (CO. 3.13). The process elements of CO. 2.3, CO. 2.4, CO. 2.5, and direct labor cost (CO. 3.13) are part of CO. 1.1 (Total Supply Chain Management Cost), which is one of 10 strategic metrics (level-1 metrics). They are in level 2, so all metrics provided for each level 3 will measure level 2. Cost to make (CO. 2.3) is the sum of costs associated with Make consists of CO. 3.11 (Direct Material Cost), CO. 3.12 (Indirect Cost Related to Production), and CO. 3.13 (Direct Labor Cost). Cost to deliver is also be measured by CO. 3.14 (Order Management Costs) and CO. 3.15 (Order Delivery Costs). While the cost to return is the sum of the cost to return to sources (CO. 3.16) and customer (CO. 3.17). The rest of the costs are not part of strategic metrics. When the company wants to conduct a supply chain measurement, it must ensure each definition and formula of performance metrics explained in SCOR 12. Direct labor cost (CO. 3.13) is the direct cost of production labor but does not include COGS (cost of goods sold). The direct labor cost is labeled CO. 2.8 (direct labor cost), which counts the direct cost of production labor. Both have the same metric name but different meanings.
We found only nine metrics in Reliability that goes into part of 10 strategic metrics (RL. 1.1 Perfect Order Fulfillment), including delivery location accuracy (RL. 3.34), delivery item accuracy (RL. 3.33), and delivery quantity delivery accuracy (RL. 3.35), whereas the others left out of them. Similar to costs, RL. 2.2, RL. 2.3, and RL. 2.4 means that they will be measured by all metrics provided for each. Perfect condition (RL. 2.4), for instance, has five performance metrics considered in perfect condition: RL. 3.12 (% of fault installations), RL. 3.24 (% orders/lines received damage-free), RL. 3.41 (orders delivered damage-free conformance), RL., 3.42 (orders delivered defect-free conformance), and RL. 3.55 (warranty and returns). Furthermore, we must have a well-understanding of defect and damage definition. Defect represents the condition of the product not being intact, e.g., manufacture defect while damage is associated with injury or harm, such as suspected damages found to boxes delivered. Some shipping claims state that inspection is required before the trucker leaves the premises if any box has damage. The misunderstanding of both metrics may lead to incorrect data obtained and the wrong measurement as well.
These proposed metrics were discussed and approved by the interviewees, so they did not suggest any new metrics nor eliminate them. The most performance attribute belongs to responsiveness. All performance metric identified is shown in Table 3.
As we stated before that SCOR has many weaknesses. The complexity of SCOR has been found during the research that it can lead to miss something and generate an invalid model for supply chain action [11]. It also requires a good knowledge of both understanding the SCOR guidance and the actual operation of the activities in the field [12]. Moreover, converting the SCOR explanation to an easy language is the most challenging task of the research. It is required to have a deep learning of the SCOR model. Otherwise, we can have a misinterpretation of each definition in the book. Despite the weaknesses, the performance measurement using SCOR can benefit any company to improve their business, including SMEs. Small and medium-sized enterprises (SME) are a key to creating new economic sources in Indonesia and have contributed toward gross domestic product in Indonesia [1]. Hence, this sector has an essential role in improving SMEs producing clothes. We did not measure the score of supply chain performance but determining the KPIs. These metrics can be helpful as a standard for assessing the Supply Chain performance in the future.
Table 2. Process categories and process elements
|
Level 1 |
Level 2 |
Level 3 |
|
(sP) Plan |
(sP2) Plan Source |
(sP2.1) Identify, Prioritize, and Aggregate Product Requirements |
|
|
|
(sP2.2) Identify, Assess and Aggregate Supply Chain Product Resources |
|
|
|
(sP2.3) Balance Product Resources with Product Requirements |
|
|
|
(sP2.4) Establish Sourcing Plan |
|
(sS) Source |
(sS2) Source Make-To-Order Product |
(sS2.1) Schedule Product Deliveries |
|
|
|
(sS2.2) Receive Product |
|
|
|
(sS2.3) Verify Product |
|
|
|
(sS2.4) Transfer Product |
|
|
|
(sS2.5) Authorize Supplier Payment |
|
(sM) Make |
(sM2) Make-To-Order |
(sM2.1) Schedule Production Activities |
|
|
|
(sM2.2) issue Sourced/In Process Product/Identity Service |
|
|
|
(sM2.3) Produce and Test |
|
|
|
(sM2.4) Package |
|
|
|
(sM2.5) Stage Finished Product |
|
(sD) Deliver |
(sD2) Deliver Make-To-Order Product |
(sD2.1) Process Inquiry and Quote |
|
|
|
(sD2.2) Receive, Configure, Enter and Validate Order |
|
|
|
(sD2.3) Reserve Inventory and Determine Delivery Date |
|
|
|
(sD2.4) Consolidate Orders |
|
|
|
(sD2.5) Build Loads |
|
|
|
(sD2.6) Route Shipments |
|
|
|
(sD2.8) Receive Product from Source or Make |
|
|
|
(sD2.9) Pick Product |
|
|
|
(sD2.10) Pack Product |
|
|
|
(sD2.11) Load Product and Generate Shipping Docs |
|
|
|
(sD2.12) Ship Product |
|
|
|
(sD2.13) Receive and Verify Product by Customer |
|
|
|
(sD2.14) Install Product |
|
|
(sDR1) Deliver Return Defective Product |
(sDR1.1) Authorize Defective Product Return |
|
|
|
(sDR1.2) Schedule Defective Return Receipt |
|
|
|
(sDR1.3) Receive Defective Product (includes verify) |
|
|
|
(sDR1.4) Transfer Defective Product |
|
(sE) Enable |
(sE4) Manage Supply Chain Human Resource |
(sE4.1) Identify Skills/Resource Requirement |
|
|
|
(sE4.2) Identify Availabe Skills/Resources |
|
|
|
(sE4.3) Match Skills/Resources |
|
|
|
(sE4.4) Determine Hiring/Redeployment |
|
|
|
(sE4.5) Determine Training/Education |
|
|
|
(sE4.6) Approve, Prioritize and Launch |
|
|
(sE5) Manage Supply Chain Assets |
(sE5.1) Schedule Aset Management Activities |
|
|
|
(sE5.2) Take Aset Off-line |
|
|
|
(sE5.3) Inspect and Troubleshoot |
|
|
|
(sE5.4) Install and Configure |
|
|
|
(sE5.5) Clean, Maintain, and Repair |
|
|
|
(sE5.7) Inspect Maintenance |
|
|
|
(sE5.8) Reinstate Asset |
Table 3. Performance metrics framework
|
|
COST |
RELIABILITY |
RESPONSIVENESS |
|
1 |
(CO. 2.3) Cost to Make |
(RL. 3.11) % of Faultiness Invoice |
(RS. 3.4) Package Cycle Time |
|
2 |
(CO. 2.5) Cost to Return |
(RL. 3.18) % Orders/Lines Processed Complete |
(RS. 3.5) Authorized Defective Return Cycle Time |
|
3 |
(CO. 2.4) Cost to Deliver |
(RL. 3.19) % Orders/ Lines Received Defect Free |
(RS. 3.8) Authorize Supplier Payment Cycle Time |
|
4 |
(CO. 3.10) Cost to Verify Product |
(RL. 3.20 % Orders/Lines Received On-Time to Demand Requirement |
(RS. 3.12) Balanced Product Resources with Product Requirements Cycle Time |
|
5 |
(CO. 3.13) Direct Labor Cost |
(RL. 3.27) % Schedule Change within Supplier’s Lead Time |
(RS. 3.16) Build Loads Cycle Time |
|
6 |
(CO. 3.14) Order Management Cost |
(RL. 3.21) % Orders/Lines Received with correct content |
(RS. 3.18) Receive Product from Make/Source Cycle Time |
|
7 |
|
(RL. 3.25) % Product Transferred ON-Time to Demand Requirement |
(RS. 3.29) Establish Plans Cycle Time |
|
8 |
|
(RL. 3.26) % Product Transferred without Transaction Errors |
(RS. 3.38) Identify, Assess and Aggregate Product Resources Cycle Time |
|
9 |
|
(RL. 3.33) Delivery Item Accuracy |
(RS. 3.41) Identify, Prioritize and Aggregate Product Requirements Cycle Time |
|
10 |
|
(RL. 3.34) Delivery Location Accuracy |
(RS. 3.50) Issue Sourced/ In-Process Product Cycle Time |
|
11 |
|
(RL. 3.35) Delivery Quantity Accuracy |
(RS. 3.56) Manage capital asset cycle time |
|
12 |
|
(RL. 3.41) Orders Delivered Damage Free Conformance |
(RS. 3.64) Manage integrated supply chain capital assets cycle time |
|
13 |
|
(RL. 3.42) Orders Delivered Damage Free Conformance |
(RS. 3.67) Manage MAKE equipment and facilities cycle time |
|
14 |
|
(RL. 3.49) Achievement of production schedule |
(RS. 3.95) Pack Product Cycle Time |
|
15 |
|
(RL. 3.103) Receive and Verify Product Cycle Time |
(RS. 3.96) Pick Product Cycle Time |
|
16 |
|
(RL. 2.1) % of Orders Delivered in Full |
(RS. 3.101) Produce and Test cycle time |
|
17 |
|
(RL. 2.2) Delivery Performance to Customer Commit Date |
(RS. 3.102) Receive and Verify Product by Customer Cycle Time |
|
18 |
|
(RL. 2.3) Documentation Accuracy |
(RS. 3.104) Receive Defective Product Cycle Time |
|
19 |
|
(RL. 2.4) Perfect Condition |
(RS. 3.110) Receive Product from Source to Make Cycle Time |
|
20 |
|
|
(RS. 3.114) Release Finished Product to Deliver Cycle Time |
|
21 |
|
|
(RS. 3.115) Reserve Inventory & Determine Delivery Date Cycle Time |
|
22 |
|
|
(RS. 3.117) Route Shipments Cycle Time |
|
23 |
|
|
(RS. 3.118) Schedule Defective Return Receipt Cycle Time |
|
24 |
|
|
(RS. 3.126) Ship Product Cycle Time |
|
25 |
|
|
(RS. 3.128) Stage Finished Product Cycle Time |
|
26 |
|
|
(RS. 3.136) Transfer Defective Product Cycle Time |
|
27 |
|
|
(RS. 3.139) Transfer Product Cycle Time |
A performance measurement system (PMS) is essential for improving business, mainly for the long term. Measuring the Supply chain performance improves business, so a company understands its current situation and determines a better strategy for the future. It is required the performance metrics to quantify the SC performance. Based on the results, this make-to-order company obtained 52 performance metrics within its supply chain from 3 suppliers to 2 customers (offline and online) spread into 47 process elements (level 3). However, Aramyan et al. [14] suggested that not all metric is measured. For further research, we can request the interviewees to rank performance indicators listed following perceived importance for their company, using a five-point Likert scale, with 1 "not important at all" to measure performance and 5 "very important" provided in a questionnaire. We will eliminate the performances metrics with a score of less than four [14]. We must assist the interviewees from any company while scoring the KPIs. Explaining the meaning of each metric can help reduce any subjectivity from the interviewees.
We can adjust the framework since we obtained it from the particular case study. To determine a standard set of KPI for a make-to-order, SME producing jersey or similar product, adding some SMEs will create a better comparison among them and generalize the metrics to fit many companies' conditions. Moreover, we suggest that each tier can be measured using similar process categories to develop a clear view of the whole supply chain performance. Each chain is allowed to adjust the metrics provided by our study due to different objectives. Thus, we can use the KPIs to evaluate the performance of the chains, not only the SME itself. Another performance measurement can be applied, such as the SCOR model combined with the Balanced Scorecard.
[1] Gupta, S., Malhotra, N.K., Czinkota, M., Foroudi, P. (2016). Marketing innovation: A consequence of competitiveness. Journal of Business Research, 69(12): 5671-5681. https://doi.org/10.1016/J.JBUSRES.2016.02.042
[2] Angelova, B., Zekiri, J. (2011). Measuring customer satisfaction with service quality using American Customer Satisfaction Model (ACSI Model). International Journal of Academic Research in Business and Social Sciences, 1(3): 232. https://doi.org/10.6007/IJARBSS.V1I2.35
[3] Durukan, T., Bozaci, I. (2011). The role of individual characteristics on customer loyalty. International Journal of Business and Social Science, 2(23).
[4] Simchi-Levi, D., Kaminsky, P., Simchi-Levi, E. (2007). Designing and Managing the Supply Chain 3e with Student CD. McGraw-Hill Education.
[5] Greenwood, M., Van Buren III, H.J. (2010). Trust and stakeholder theory: Trustworthiness in the organisation–stakeholder relationship. Journal of Business Ethics, 95(3): 425-438. https://doi.org/10.1007/S10551-010-0414-4
[6] Agami, N., Saleh, M., Rasmy, M. (2012). Supply chain performance measurement approaches: Review and classification. Journal of Organizational Management Studies, 2012: 1–20. https://doi.org/10.5171/2012.872753
[7] Gunasekaran, A., Patel, C., McGaughey, R.E. (2004). A framework for supply chain performance measurement. International Journal of Production Economics, 87(3): 333-347. https://doi.org/10.1016/J.IJPE.2003.08.003
[8] Hausman, W.H. (2004). Supply chain performance metrics. In the Practice of Supply Chain Management: Where Theory and Application Converge, 62: 61-73. https://doi.org/10.1007/0-387-27275-5_4
[9] Ka, J.M.R., Ab, N.R., Lb, K. (2019). A review on supply chain performance measurement systems. Procedia Manufacturing, 30: 40-47. https://doi.org/10.1016/j.promfg.2019.02.007
[10] Liebetruth, T. (2017). Sustainability in performance measurement and management systems for supply chains. Procedia Engineering, 192: 539-544. https://doi.org/10.1016/j.proeng.2017.06.093
[11] Lee, M.C., Chang, T. (2010). Developing a lean design for Six Sigma through supply chain methodology. International Journal of Productivity and Quality Management, 6(4): 407-434. https://doi.org/10.1504/IJPQM.2010.035891
[12] Lemghari, R., Sarsri, D., Okar, C., Es-satty, A. (2019). Supply chain performance measurement in the automotive sector: A structured content analysis. Uncertain Supply Chain Management, 7(4): 567-588. https://doi.org/10.5267/J.USCM.2019.6.002
[13] Lepori, E., Damand, D., Barth, B. (2013). Benefits and limitations of the SCOR model in warehousing. IFAC Proceedings Volumes, 46(9): 424-429. https://doi.org/10.3182/20130619-3-RU-3018.00174
[14] Aramyan, L.H., Lansink, A.G.O., Van Der Vorst, J.G., Van Kooten, O. (2007). Performance measurement in agri‐food supply chains: A case study. Supply Chain Management: An International Journal, 12(4): 304-315. https://doi.org/10.1108/13598540710759826