Mohammad Hossein Ahmadi* | Omid Mohammadi | Milad Sadeghzadeh | Fathollah Pourfayaz | Ravinder Kumar | Giulio Lorenzini
© 2020 IIETA. This article is published by IIETA and is licensed under the CC BY 4.0 license (http://creativecommons.org/licenses/by/4.0/).
OPEN ACCESS
Solar chimney is one of the attractive approaches to produce power from a clean source of renewable energy. In this investigation, a potentiometric study is carried out to find out a best location for construction of a solar chimney in different climates of Iran, in the Middle East. With this objective, three locations with different weather climates were chosen, i.e. Tehran, Semnan, and Bandar Abbas. These locations were chosen due to their different climatic conditions and solar irradiation. The used weather conditions are extracted for the middle day of summer, 6th August. The output power of the solar chimney plant was assessed as a function of various thermo-physical properties such as ambient pressure, ambient temperature, and local average solar irradiation. Three different typical geometry size were designed to assess the effect of ambient pressure on the output power meanwhile ambient temperature and solar irradiation is supposed to be the same for all cases. It is concluded that the output power is not significantly changed for different selected cities. In addition, Genetic algorithm (GA) is used to optimize the geometry size, performance, and economic factors of the solar chimney in three different cities. It is obtained from GA algorithm that Bandar-Abbas is the best location to construct a solar chimney. The collector diameter of 1544.82m and chimney height of 823.35m is calculated as the optimized geometry of the solar chimney for constructing in Bandar-Abbas city. Moreover, performance and economic considerations resulted that the solar chimney in Bandar-Abbas is able to produce 167.18 MW output work and the net present value after a 25 years of 6350.3. Exergy assessment resulted that the solar chimney in Bandar-Abbas is the most destructive exergy condition since the input ambient temperature and the bigger geometry size of this solar chimney. After Bandar-Abbas, Semnan and Tehran were ranked, respectively.
solar chimney, solar radiation intensity, exergy, optimization
Solar energy is a vast available source of renewable energy. Its utilization is considered one of the cleanest sources since there is no toxic products or any greenhouse gases (GHGs) production in the exploitation of solar energy. Currently, this type of energy can be employed from several approaches such as photovoltaic (PV), heating applications, thermal electricity production, and solar architecture. In common solar thermal systems, an electrical generator is driven by the produced steam of solar thermal processes. One of the recent applications of using solar energy is a solar chimney. This application is established by merging the concepts of chimneys, solar collectors, and turbines. The solar radiation transmits through the built transparent cover and heats the soil and ground under the cover. Thus, the existed air under the cover is heated and a temperature gradient will be achieved. Due to the presence of the temperature gradient, a buoyancy forces makes the air to circulate and an ascending airflow will be provided in the tower. This airflow can drive the located turbines through the center of the lid to move and generate electricity [1-3]. This idea was firstly established by Schaich and a sample model was built in the 1980s [2]. The sample model of a solar chimney was developed and formed the first real-size solar chimney in Manzanares, Spain (1981-82) [4]. This solar chimney was exploited from 1982 to1989, and in the last three years, local grid connection was also practical [3]. Haaf et al. reported the detailed operational information and tests' results of the first sample model [5, 6]. Australians are investing on a solar chimney plant with the capacity of 200MW [7].
Assessments based on the Manzanares plant demonstrated that solar chimney power production plant has this capability to compete mutually with other 100MW conventional power plants with respect to economic and performance evaluation [8]. Cost models are provided in order to assess the feasibility of new large-scale solar chimney power production plants. Energy production costs and a comparison among solar chimney power production plant and coal-based power plants and combined cycle power plants were investigated by Schlaich [3]. In another research, Schlaich et al. [9] also studied the cost values for each component in the solar chimney power plant and considered fixed economic factors to obtain levelised electricity costs for different power production plants. Bernardes [10] studied the impact of size and capacity on the costs for plants and also performed a sensitivity analysis on the effect of the levelised electricity costs on economic factors. In a similar work, a comprehensive cost model comprising a compatible model with different power conversion unit and also a comparison of the obtained results from the literature was presented by Fluri et al. [11].
The solar chimney is an attractive concept and several investigations have been performed in this field so far. Zhou et al. [12] reviewed the development flow of the solar chimneys comprehensively. Both experimental and numerical studies with respect to physical characterizations and economic developments were included in this review. In overall, the authors concluded solar chimney power production system has this potential to be a significant player in the world direction toward development.
The analyses over solar chimneys were mostly focused on the 1st law of thermodynamics. Most of the recent researches which evaluated through the 2nd law of thermodynamics were concentrated on solar drying approaches [13-19]. One of the few investigations that conducted 2nd law analysis on a solar chimney power production (SCPP) was performed by Petela [20]. Petela assessed the total energy performance of the SCPP through exergy analysis. The study was aimed to find out a simple practical model to interpret the performance of the SCPP. However, the presented model was made out of several assumptions and not based on real experimental outputs.
Bernardes et al. [21] investigated the laminar natural convection heat transfer inside the chimney under steady state assumptions. This investigation was followed and enhanced by Maia et al. [22]. In addition, the authors implemented the model on unsteady turbulent conditions and the outputs were validated by others reported experimental data. Chergui et al. [23] studied a laminar natural convection air flow and presented a model based on the finite volume method to solve the Navier– Stokes and energy equations. The mesh geometry was defined as 1/22(24_24 cells) and validation was conducted based on the reported results of the benchmark solution by Vahl Davis [24]. Pastohr et al. [25] employed Fluent software to simulate the solar chimney. A numerical solution was implemented in the Reynolds-averaged Navier–Stokes equations for a typical turbine and heat conduction equation was also considered to forecast the ground temperature. Ming et al. [26] presented a solution of the Navier–Stokes and energy equations for the airflow and also, transport equations for the variables of the turbulent condition. Various mathematical models for each of the components (the collector, the chimney, and the energy storage layer under the solar chimney) were established to be utilized as boundary conditions of Navier-Stokes, Energy, and transport equations, respectively. Numerical modeling was based on the Manzanares built-prototype. Ming et al. [27] applied the CFD approach to solar chimney systems to obtain an acceptable numerical solution. The authors assessed the impact of pressure drop, solar radiation, heat transfer, output power, and wasted energy for the modeled solar chimney. The outputs demonstrated that for a solar chimney at the selected geometry (40m for chimney height and 1500m for the collector radius), a 5-blade simple turbine is able to produce 10MW and the efficiency of 50% for the selected turbine.
Ming et al. studied an adjusted solar chimney power production system [28] with this aim to determine an output power and also for freshwater generation from out of the air. It is concluded that a direct relationship exists between freshwater generation and natural rainfall. Guo et al. [29] reported the optimal ratio of the turbine pressure drop in a solar chimney power plant by performing a numerical solution. The investigation output was a prediction model to primarily evaluate the performance of the system for the ideal pressure drop ratio of turbines.
Multi objective optimization is a reliable tool for engineering studies [30-32]. Solving a multi-objective problem is a complex task as it requires simultaneous satisfaction of different and periodically contradictory objective functions. In order to solve this kind of problems, evolutionary algorithm (EA) has been introduced since 18th [33]. In a multi objective issue, the intention is to obtain an assortment of routes so that the objective functions are applied for each solution at an almost importance procedure [34]. The outcome is a large group of solutions named Pareto frontier presenting possible solutions all through the functions zone. Multi objective optimization method has been generally utilized throughout the thermodynamics of energy systems in a great number of studies [35-69].
In this investigation, a potentiometric study is carried out to find out a best location for construction of a solar chimney in different climates of Iran, in the Middle East. With this objective, three locations with different weather climates were chosen, i.e. Tehran, Semnan, and Bandar Abbas. These locations were chosen due to their different climatic conditions and solar irradiation. The used weather conditions are extracted for the middle day of summer, 6th August. The output power of the solar chimney plant were assessed as a function of various thermo-physical properties such as ambient pressure, ambient temperature, and local average solar irradiation. Three different typical geometry size were designed to assess the effect of ambient pressure on the output power meanwhile ambient temperature and solar irradiation is supposed to be the same for all cases. It is concluded that the output power is not significantly changed for different selected cities. In addition, Genetic algorithm (GA) is used to optimize the geometry size, performance, and economic factors of the solar chimney in three different cities.
The utilized balance equations set were extracted shown by Celma and Cuadros [15], and Hepbasli [70]. Parameters including work and heat interactions, the exergy rates, the exergy losses, and the exergy efficiency were obtained by applying balance equations set. The mass conservation equation can be generally stated as follows:
$\dot{m}_{a o}=\dot{m}_{a i}$ (1)
here, m ̇ represents the mass flow rate and subscripts ai and ao indicate the inlet and the outlet airflow, respectively. The mass conservation equation is changed to the following form for the drying air and moisture:
$\dot{m}_{m p}+\dot{m}_{w i}=\dot{m}_{w o}$ (2)
where, subscripts wi, wo, and mp indicate the inlet humidity mass flow, the outlet humidity mass flow, and the moisture mass flow from the ground, respectively. The moisture mass conservation equation can be modified by considering the inflow and outflow specific humidities of $\omega_{a i}$ and $\omega_{a o}$, as follows:
$\dot{m}_{m p}+\dot{m}_{a i} \omega_{a i}=\dot{m}_{a o} \omega_{a o}$ (3)
The overall energy balance equation, Eq. (4), states that the total input energy flows are equal to the total energy outputs:
$\sum \dot{E}_{i n}=\sum \dot{E}_{o u t}$ (4)
$\dot{Q}=\dot{m}_{a o}\left(h_{a o}+\frac{V_{a o}^{2}}{2}\right)-\dot{m}_{a i}\left(h_{a i}+\frac{V_{a i}^{2}}{2}\right)$ (5)
Eq. (5) is employed to specify the total heat rate of $\dot{Q}$. It is supposed that there is no energy usage in the system due to the absence of turbine in the system. The air inlet and outlet velocity to the selected system is indicated by Vai and Vao, respectively. h is the specific enthalpy and subscripts ai and ao indicate the inlet and outlet of the system. EES (Engineering Equation Solver) software were used to obtain these values by applying the available correlations.
The exergy balance equation can be commonly expressed as follows:
$\sum \dot{E} x_{i n}-\sum \dot{E} x_{o u t}=\sum \dot{E} x_{l o s t}$ (6)
In Eq. 6, $\dot{E} x$ is the exergy flow rate and subscripts in, out, and lost indicate the inflow, outflow, and wasted flow, respectively, then, Eq. (6) can be rewritten as follows [71]:
$\dot{E} x_{\text {heat}}-\dot{E} x_{\text {work}}+\dot{E} x_{\text {mass,in}}-\dot{E} x_{\text {mass}, \text {out}}$$=\dot{E} x_{l o s t}$ (7)
The exergy flow rate associated with the heat transfer expressed as:
$\dot{E} x_{h e a t}=\left(1-\frac{T_{0}}{T_{k}}\right) \dot{Q}$ (8)
where, $\dot{Q}$ and Tk indicate the heat transfer rate through the system boundary and temperature at a specific location of k (here k is considered as ground), respectively. The selected reference temperature is stated as T0. The terms of $\dot{E} x_{\text {work}}$ which is associated to the direct work interactions to the system is neglected.
$\dot{E} x_{m a s s, i n}$ represents the amount of exergy which is created because of the entering airflow to the system. Similarly, $\dot{E} x_{\text {mass}, \text {out}}$ is the amount of exergy that is associated to the exit airflow and also to the water removed from the ground ($\dot{E} \mathcal{X}_{W}$).
$\dot{E} x_{\text {mass}, \text {in}}=\dot{m}_{a i} \psi_{a i}$ (9)
$\dot{E} x_{\text {mass}, \text {out}}=\dot{m}_{\text {ao}} \psi_{\text {ao}}+\dot{E} x_{w} v$ (10)
$\dot{E} x_{w}=\dot{m}_{m p} \psi_{w o}$ (11)
Hence, the exergy outflow is expressed as:
$\dot{E} x_{\text {mass}, \text {out}}=\dot{m}_{\text {ao}} \psi_{\text {ao}}+\dot{m}_{m p} \psi_{w o}$ (12)
$\psi$ is defined as the specific exergy flow and can be simply calculated as follows:
$\psi=\left(h-h_{0}\right)-T_{0}\left(s-s_{0}\right)$ (13)
In Eq. (13), h and s are the specific enthalpy (kJ/kg) and specific entropy (kJ/kgK), respectively. Exergy flow at the inlet and outlet of the studied system can be calculated as [72]:
$\psi_{a i}$$=\left(C_{p, a i}+\omega_{a i} C_{p, v}\right) T_{0}\left(\frac{T_{a i}}{T_{0}}-1-\ln \frac{T_{a i}}{T_{0}}\right)$$+\left(1+1.6078 \omega_{a i}\right) R_{a} T_{0} \ln \frac{P_{a i}}{P_{0}}$$+R_{a} T_{0}\left(\left(1+1.6078 \omega_{a i}\right) \ln \left(\frac{1+1.6078 \omega_{0}}{1+1.6078 \omega_{a i}}\right)\right.$$\left.+1.6078 \omega_{a i} \ln \frac{\omega_{a i}}{\omega_{0}}\right)$ (14)
$\psi_{a o}=\left(C_{p, a o}+\omega_{a o} C_{p, v}\right) T_{0}\left(\frac{T_{a o}}{T_{0}}-1-\ln \frac{T_{a o}}{T_{0}}\right)+$$\left(1+1.6078 \omega_{a o}\right) R_{a} T_{0} \ln \frac{P_{a o}}{P_{0}}+R_{a} T_{0}((1+$$\left.1.6078 \omega_{a o}\right) \ln \left(\frac{1+1.6078 \omega_{0}}{1+1.6078 \omega_{a o}}\right)+1.6078 \omega_{a o} \ln \frac{\omega_{a o}}{\omega_{0}}$ (15)
In Eqns. (14) and (15), Ra and P0 are the ideal air constant and the dead state pressure, respectively. T, $C_{p, v}$, and $\omega_{0}$ indicate the air temperature, the specific heat of the water vapor, and the specific humidity of the flow in the reference state, respectively.
Here, water is assumed as an incompressible matter. Thus, the specific exergy flow at the outlet is calculated as follows [71]:
$\psi_{w o}=C\left(T_{a o}-T_{0}-T_{0} \ln \frac{T_{a o}}{T_{0}}\right)$ (16)
It is supposed that the exit temperature, Tao, is equal for both air and water. In the Equation (16), C represents the specific heat of water. Hence, the exergy loss is obtained as follows [71]:
$\dot{E} x_{l o s t}=\left(1-\frac{T_{0}}{T_{k}}\right) \dot{Q}+\dot{m}_{a i} \psi_{a i}-\dot{m}_{a o} \psi_{a o}$$-\dot{m}_{m p} \psi_{w o}$ (17)
In other words, the amount of exergy loss is equal to the irreversibility rate, I:
$\dot{E} x_{l o s t}=I$ (18)
In this study, the exergy efficiency, ε, is defined as:
$\varepsilon=\frac{\dot{E} x_{o u t}}{\dot{E} x_{i n}}=1-\frac{\dot{E} x_{l o s t}}{\dot{E} x_{i n}}$ (19)
3.1 Benefit analysis
Utilizing solar chimneys for power production have two main advantages, i.e. generated electricity can be sold to the network grid and in addition, the amount of carbon credit due to the decrease in production of GHGs emissions.
Benefit of electricity sale
The price of solar-assisted electricity ($P_{S}$) and the total annual electricity output ($E_{S}$) are the two major factor that affect the amount of benefit from selling the generated electricity to the grid. Local government usually provide economic incentives by regulating some offer to buy the solar electricity higher than other conventional power plants to support and assist solar industry to develop. This settled price is facing an annual fixed augmentation proportional to the inflation rate (θ). The produced electricity usually consumed in situ in the plant, or sold and delivered to the utility. Since the in situ consumption of the electricity in the plant is too low in comparison to the amount of sold power to the utility, here we assumed that all the generated electricity is delivered and sold to the utility. Hence, the following equation, Eq. (20) is used to calculated the amount of benefit from the electricity sale in the kth year ($B_{E}^{k}$) [71]:
$B_{E}^{k}=E_{S} P_{S}(1+\theta)^{k-1}$ (20)
n indicates the life span of the plant and k is the numerator (k=1, . . ., n).
3.1.1 Benefit of carbon credits
Solar power plants produce zero amount of GHGs. Therefore, this specific feature make them predominant over other conventional coal-fired or natural gas-fired power plants. It is assumed that the price of carbon credits ($P_{C}$) is proportional to the inflation rate of θ and it is annually increasing. Thus, decreasing the amount of carbon dioxide emission in the kth year ($B_{C}^{k}$) resulted in the benefit ($B_{C}^{k}$):
$B_{C}^{k}=0.9 E_{S} P_{C}(1+\theta)^{k-1}$ (21)
3.1.2 Total benefits
Summing up the two values of carbon credits benefit and electricity sale benefit resulted the total benefits of a solar power plant ($B^{k}$) in the kth year:
$B^{k}=B_{E}^{k}+B_{C}^{k}$ (22)
3.2 Cost analysis
Items including the principal and interest of loans, repayment period, the operation and maintenance cost, and the tax cost have effect on the total costs of a solar chimney power plant.
3.2.1 Initial investment
In this investigation, the initial investment cost during the construction period is indicated by $C_{C}$. It is assumed that Banks provided all the required investment cost and loans are going to be repaid in mth year. In overall, two methods are available for repaying the loans, i.e. matching interest repayment law and equal principal repayment approach. In matching interest repayment law borrowers are allowed to repay the same amount of loans every period. On the other hand, in the equal principle repayment approach an option is provided for the borrowers to repay equal principal and different amount of interest every period. In the latter method, a constant principal is repaid every period. Thus, the interest cost is decreased in each period. Therefore, the calculated total interest cost of matching interest repayment law is higher than that of equal repayment approach. Zhou et al. [73] conducted matching interest repayment law to assess the solar power plants' cost. Here, with this aim to decrease the interest cost, equal principal repayment approach is employed. Thus, the principal repaid in the ith year ($C_{P}^{i}$) is calculated as follows:
$C_{P}^{i}=\frac{C_{C}}{m}$ (23)
Here, the debt ($C_{D}^{i}$) after repayment of the principal and interest in the ith year is:
$C_{D}^{i}=C_{C}-(i-1) C_{P}^{i}$ (24)
The amount of interest in the ith year ($C_{I}^{i}$) is given by [71]:
$C_{I}^{i}=C_{D}^{i} r$ (25)
In Eq. (25) i is the numerator (i = 1, … , m) and r indicates the interest rate of loans.
3.2.2 Operation and maintenance (O & M) cost
In order to achieve a nearly constant performance during the total service period from a solar power plant some expenses are required to maintenance and repair the collector, chimney and PCU. In overall, these expenses are classified as the operation and maintenance cost. The required operation and maintenance cost in the first operation year is indicated by $C_{O}^{1}$ and assumed that the cost augmented with the constant inflation rate of θ. Finally, the operation and maintenance cost in the kth year is calculated as [71]:
$C_{O}^{k}=C_{O}^{1}(1+\theta)^{k-1}$ (26)
where, k = 1, . . ., n.
3.3 Cost-benefit analysis
In Economic analysis, it is vital for all of the solar power production plants to discount the net cash flow in each year of the total service period. Profitability of a plant is moderately dependent on the selection of the discount rate. Zhou et al. [73] applied the typical discount approach considering the inflation rate. This method is deficient since the risk of the project is not considered. Because the service periods of RCSCPPs surpassed 100 years, in this investigation the risk adjusted discount rate method (RADRM) is utilized. The standard discount rate is regulated in term of the risk degree by RADRM model where the net present value approach is combined with the capital asset pricing method. μ is the risk free discount rate. b denotes the risk return rate. Q indicates the risk degree. Therefore, the risk-regulated discount rate (ρ) is stated as follows:
$\rho=\mu+\mathrm{bQ}$ (27)
In Eq. (27) b is obtained by calculating the difference between the investment return rate demanded by the project and the minimum return rate dividing the coefficient of medium risk. Calculating the standard deviation of present value dividing total present value of benefits in the service period resulted the parameter of Q.
Therefore, the net present value (NPV) in the kth year calculated as follows:
$\mathrm{NPV}^{k}=\frac{B^{k}-C^{k}}{(1+\rho)^{k}}$ (28)
Accordingly, total NPV (TNPV) becomes:
$\mathrm{TNPV}=\sum_{k=1}^{n} \mathrm{NPV}^{k}$ (29)
In this investigation, August 6th of 2017, which had appropriate radiation and temperature condition, was considered as the reference for calculations. Average values of these parameters were used through the day. Moreover, various climate conditions were considered for the case study.
4.1 Selecting powerplant location
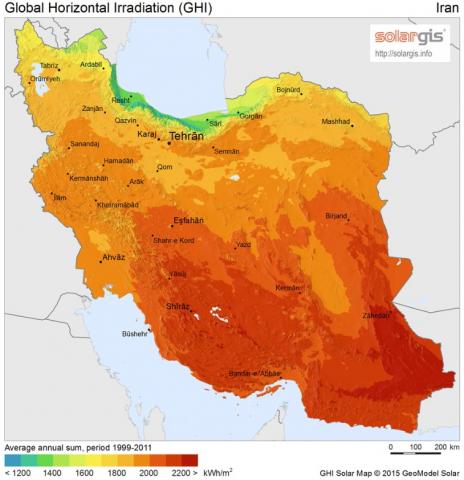
Data on the solar radiation intensity were extracted from the Solargies corporate website in order to select locations with different climate conditions. Figure 1 shows the average annual solar radiation intensity in Iran. By considering the amount of radiation in different parts of the country, cities of Tehran, Semnan, and Bandar Abbas were selected as the case study.
Temperature, pressure, and solar radiation are the climate data required for modeling. Ambient temperature and pressure on August 6th, were extracted from Meteorological organization. The data are represented in Table 1.
Table 1. Average values of temperature, pressure and radiation intensity on August 6th
|
City |
Date |
Average temperature (°C) |
Average Pressure (kPa) |
Average radiation intensity (W/m2) |
|
Tehran |
6/8/2017 |
30.26 |
8948.33 |
577.636 |
|
Semnan |
6/8/2017 |
31.25 |
8931.51 |
610.229 |
|
Bandar Abbas |
6/8/2017 |
55.05 |
10123.62 |
618.583 |
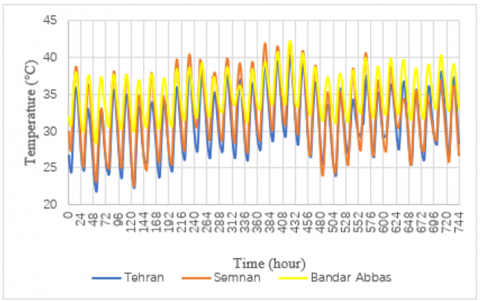
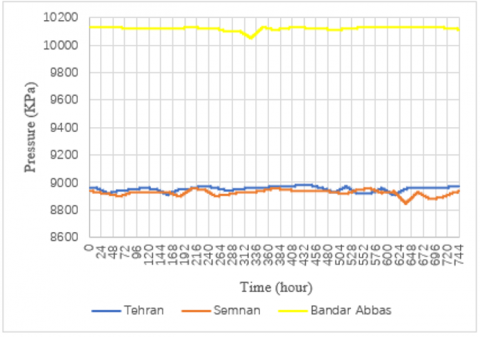
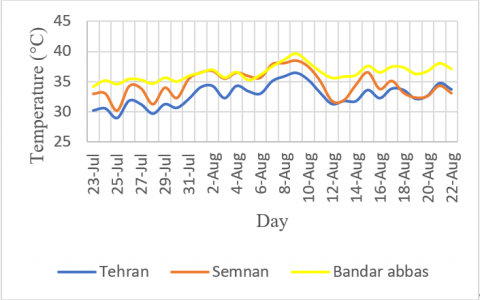
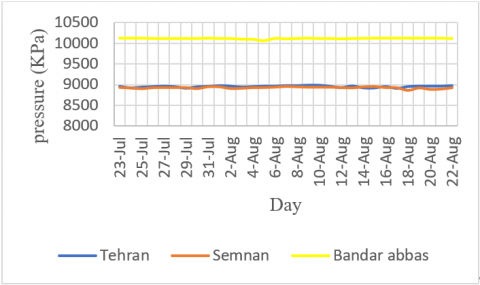
Obtained data for solar radiation intensity, ambient temperature and ambient pressure in three selected cities from July 23th until August 22th are shown in Figures 2, 3 and 4.
As illustrated in Figures 2, 3 and 4, Bandar Abbas has the most appropriate conditions for solar chimney power plant, since it has the highest radiation intensity among the considered cities. In addition, its ambient temperature has the highest value among these three cities.
Figure 1. Annual average solar radiation map of Iran [74]
Figure 2. Radiation intensity in the three cities from July 23th until August 22th
Figure 3. Ambient temperature in the three cities from July 23th until August 22th
Figure 4. Ambient pressure in the three cities from July 23thuntil August 22th
4.2 The effect of ambient pressure
In order to determine the most appropriate city for solar chimney power plant, the effect of pressure should be considered by other results. Tehran and Semnan had similar ambient pressure; while the ambient pressure in Bandar Abbas was significantly higher than the two other cities.
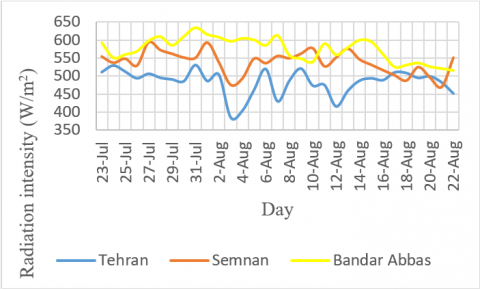
Average values of the three parameters during daylight hours, which is the operation time of a power plant, are shown in Figures 5, 6 and 7 in order to get better insight into ambient conditions.
As shown in Figure 5, the average value of solar radiation intensity in the most of the cases was maximum for Bandar Abbas during daylight from July 23th until August 22th. The second rank in this parameter belonged to Semnan. On August 10th and 22th, the average daily radiation intensity for Semnan was more than Bandar Abbas. In most days, Tehran had the minimum average daily intensity of radiation; while on August 17th, 20th and 21th the values of this parameter were slightly higher than Semnan.
Figure 5. Average radiation intensity during daylight from July 23th until August 22th
Figure 6. Average ambient temperature during daylight from July 23th until August 22th
Figure 7. Average ambient pressure during daylight from July 23th until August 22th
A similar trend for average ambient temperature during daylight was observed based on the data. Generally, the highest value of this parameter belonged to Bandar Abbas and Semnan and the minimum belonged to Tehran. Due to the dependency of the ambient temperature on the radiation intensity, this trend is quite reasonable. Only the value of this parameter on august 7th was higher for Semnan compared with Bandar Abbas and on August 17th and 21th was higher for Tehran compared with Semnan.
As shown in Figure 7, the maximum and minimum average ambient pressure during daylight belonged to Bandar Abbas and Tehran, respectively. The difference in the value of this parameter was slight for Tehran and Semnan. The approximate value of the ambient pressure is 10130 kPa for Bandar Abbas, 8960 kPa for Semnan and 8920 kPa for Tehran during the period of experiment.
Using the input data, solar chimney power plant was modeled by the equations utilized in previous section. The modeling was conducted for the data obtained on 6th August which is in the middle of summer. Initially, three different designs were considered and the performance of solar chimney plant was compared in all three cities and designs.
The ambient temperature and radiation intensity were considered to be the same for all three designs in order to determine the effect of ambient pressure on the power plant. Power output was considered as output parameter to compare the performance of the power plants. Design parameters, including collector diameter and solar chimney length, and the ambient parameters, including average temperature and radiation intensity, are shown in Table 2. It should be mentioned that the defined dimensions were taken from the actual size of the power plants.
Table 2. Determined designs in order to comparison on power plant performance
|
Design |
Collector diameter (m) |
Chimney length (m) |
Average temperature (°C) |
Average radiation intensity (W/m2) |
|
First mode |
1250 |
550 |
36.5 |
530.69 |
|
Second mode |
1800 |
750 |
36.5 |
530.69 |
|
Third mode |
2000 |
1000 |
36.5 |
530.69 |
Comparison between the power plant performances in different modes has been shown in Table 3.
Table 3. Generated power for the three cities and designs
|
Design |
Power of Tehran power plant (MW) |
Power of Semnan power plant (MW) |
Power of Bandar Abbas power plant (MW) |
|
First mode |
9.170 |
9.170 |
9.172 |
|
Second mode |
28.802 |
28.803 |
28.806 |
|
Third mode |
160.151 |
160.152 |
160.155 |
On this scale (the pressure between 8900 and 10100 kPa), the pressure of ambient did not have significant effect on the performance of the system. The maximum difference in generated power was 4 KW. This phenomenon is due to the approximately equal pressure on input and output of the power plant and the ineffectiveness of pressure force on the performance. On the other hand, this parameter is effective on the value of exergy destruction; therefore, amount of exergy destruction as a one of the most important parameters of system performance was considered as shown in Table 4.
Based on the data, the dependency of exergy destruction on ambient pressure was higher compared with power output. In addition, by increasing the pressure, the rate of exergy destruction increased. Generally, the effect of ambient pressure on solar chimney power plant was low.
Table 4. Exergy destruction for the three cities and designs
|
Design |
Power of Tehran power plant (MW) |
Power of Semnan power plant (MW) |
Power of Bandar Abbas power plant (MW) |
|
First mode |
365.859 |
365.859 |
367.706 |
|
Second mode |
753.554 |
753.554 |
754.930 |
|
Third mode |
779.403 |
779.403 |
780.491 |
4.3 Optimization of the powerplant
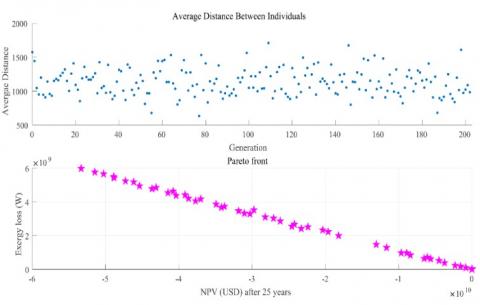
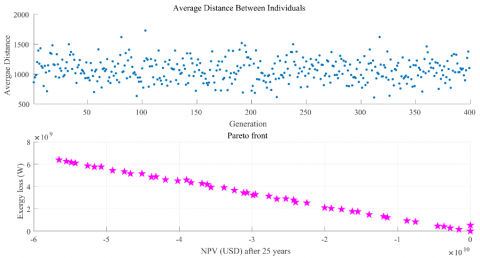
After analyzing the ambient pressure, optimum design of solar chimney power plant for the three cities of Tehran, Semnan and Bandar Abbas were determined using proposed model by the means of genetic algorithm. For this purpose, genetic algorithm tool in MATLAB was used. Pareto front chart and distribution of points, which studied in genetic algorithm in order to find optimum design in Tehran, are shown in Figure 8.
Figure 8. Pareto Front chart and distribution of responses for Tehran
The dimension of the optimal power plant, the target function mentioned in previous section and generated power of power plant for Tehran are reported in Table 5.
Table 5. Optimum design of Tehran power plant
|
Parameter (unit) |
Value |
|
Collector diameter (meter) |
1070.740 |
|
Chimney length (meter) |
733.232 |
|
Value of net present value after 25 years (dollar) |
985.413×10¹² |
|
The value of exergy destruction (MW) |
201.790 |
|
Output power (MW) |
98.198 |
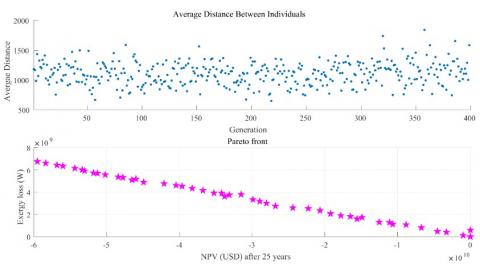
Based on the obtained results, an optimal solar chimney power plant with mentioned dimension in Tehran could have 98.198 MW power output. Figure 9 shows the beam directions and distribution of responses obtained by genetic algorithm in order to find the optimal structure of solar chimney power plant in Semnan. The optimum mode determined by this method is shown in Table 6. For Semnan, the power output of optimum mode was 160.672 MW.
Figure 9. Pareto Front chart and distribution of responses for Semnan
Table 6. Optimum design of Semnan power plant
|
Parameter (unit) |
Value |
|
Collector diameter (meter) |
1281.196 |
|
Chimney length (meter) |
807.343 |
|
Value of net present value after 25 years (dollar) |
2727.709×1012 |
|
The value of exergy destruction (MW) |
256.986 |
|
Output power (MW) |
160.672 |
Pareto front charts and distribution of responses for Bandar Abbas are illustrated in Figure 10. Optimum structural parameters and its results are reported in Table 7.
Figure 10. Pareto front chart and distribution of responses for Bandar Abbas
Based on the obtained results, optimum mode of Bandar Abbas power plant has the power output of 167.183 MW. By comparing optimum modes for solar chimney power plant in all the three considered cities, highest value of generated power belonged to Bandar Abbas and Semnan; while the minimum value belonged to Tehran. In addition, Net Present Value (NPV) had the same trend. After 25 years useful operation life of power plant, NPV of Bandar Abbas was more than twice of Semnan. This value for Semnan was more than three times higher than Tehran. Thus, in both terms of generated power and NPV, Bandar Abbas had the maximum and Tehran had the minimum values.
Table 7. Optimum design of Bandar Abbas power plant
|
Parameter (unit) |
Value |
|
Collector diameter (meter) |
1544.823 |
|
Chimney length (meter) |
823.353 |
|
Value of net present value after 25 years (dollar) |
6350.361×1012 |
|
The value of exergy destruction (MW) |
272.309 |
|
Output power (MW) |
167.183 |
Exergy destruction had such this rate, though it was considered as undesirable parameter. The difference in exergy destruction among the three cities was not significantly. The value of exergy destruction is related to power plant dimension. It is reasonable according to the relations of entropy and exergy.
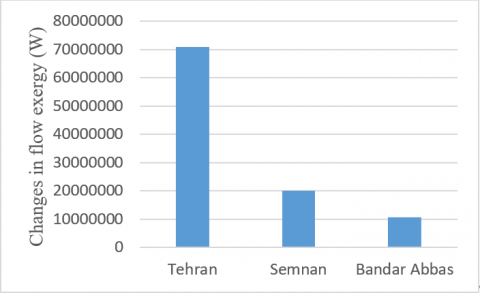
In order to get better comparison on optimum designs of power plants, parameters of flow exergy, thermal exergy, work exergy on input and output of the power plant, value of net exergy destruction and NPV were investigated. Figure 11 shows the difference in thermal exergy between inlet and outlet of the power plants.
Figure 11. Exergy difference between inlet and outlet of power plants
As shown in Figure 11, for the three cities, the outlet flow exergy was more than inlet. This performance was mainly due to increase of temperature inside the power plant which its source was input thermal energy received from the sun. This temperature difference for each of the studied city is shown in Table 8.
Table 8. Inlet and outlet temperature of optimum power plants in the three cities
|
City |
Inlet temperature of power plant (°C) |
Outlet temperature of power plant (°C) |
|
Tehran |
36.51 |
896.91 |
|
Semnan |
38.47 |
857.32 |
|
Bandar Abbas |
39.61 |
712.65 |
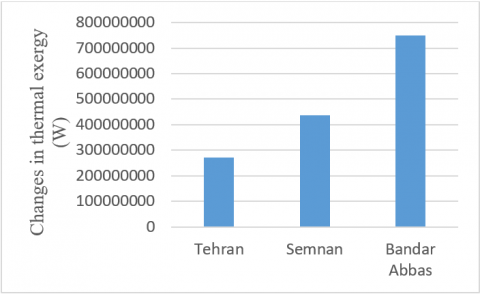
As represented in Table 8, the minimum increase in temperature in the outlet of power plant and minimum temperature difference in the inlet and outlet of the designed power plant belonged to Bandar Abbas. According to Figure 11 and Table 8, maximum difference in flow exergy belonged to Tehran. It means that flow had more exergy in the outlet of power plant and exergy was not used properly. In addition, minimum difference in flow exergy belonged to Bandar Abbas. It means that flow exergy changed to work exergy with higher efficiency. Figure 12 shows the values of input thermal exergy to the power plants.
Figure 12. Input thermal exergy to the power plants
As shown in Figure 12, the maximum and minimum thermal exergy input belonged to Bandar Abbas and Tehran, respectively. This observation is attributed to higher dimension of power plant and appropriate ambient conditions, such as higher ambient temperature and more radiation intensity, in Bandar Abbas.
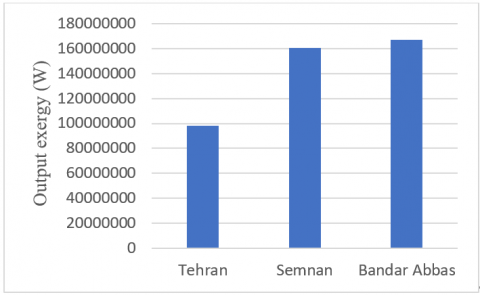
Figure 13 shows output exergy from power plants. This parameter is equal to the power output of the power plant. Bandar Abbas was ranked first and Semnan was ranked second in this parameter. For Bandar Abbas power plant, there was maximum receiving thermal exergy and minimum thermal exergy was converted into flow exergy. Therefore; it led to generate maximum output exergy. Second rank in thermal, flow and output exergy belonged to Semnan. Tehran was ranked third in thermal and output exergy and was ranked first in flow and exergy.
Figure 13. Output exergy from the power plants
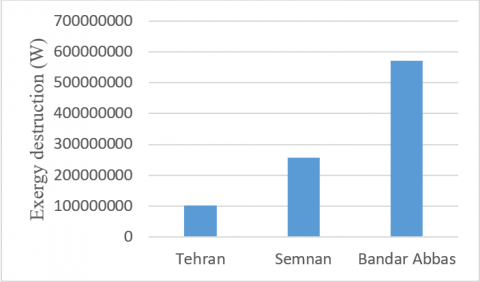
The small difference between output exergy of Bandar Abbas and Semnan was attributed to the value of exergy destruction. Figure 14 shows the value of exergy destruction for the three cities.
As shown in Figure 14, maximum exergy destruction belonged to Bandar Abbas. It was significantly higher than values of the two other cities. Much difference in exergy distribution of Bandar Abbas compared with the two other cities was mainly attributed to two separate parameters. Firstly it was due to the high difference in the ambient pressure of Bandar Abbas compared with the two other cities. The value of exergy destruction of the power plant placed in this city was more. Secondly, the size of power plant is an important reason for increasing exergy destruction, since elements such as surface friction affect this subject.
Figure 14. Exergy destruction for the power plants of the three cities
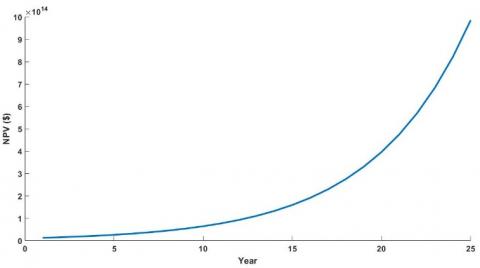
Economic issues were investigated after considering the physical operation of the power plant. In order to economical evaluation of the power plants, NPV was considered. The value of this parameter during 25 years useful working of power plant in Tehran is shown in Figure 15.
As represented in Figure 15, during first 10 years, the value of NPV would not grow significantly due to the high initial capital required for constructing a solar chimney power plant with this size. After this period, the rate of this parameter grows dramatically. On the other hand, the useful life of power plant is 25 years, it would not have proper performance after this period.
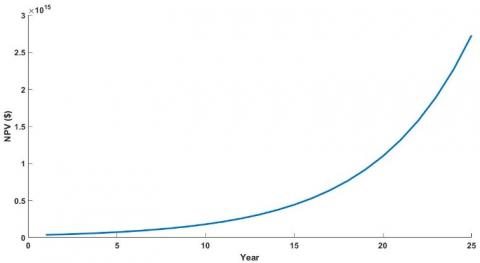
Figure 16 shows the NPV during 25 years for Semnan solar chimney power plant.
Figure 15. NPV vs year for Tehran power plant
As shown in Figure 16, the NPV begins to progressive growth after 13 years. While this trend begins at a later time compared with Tehran, its rate of increasing is more in comparison with Tehran. Therefore; NPV of Semnan power plant is more compared with Tehran power plant. It is due to the larger dimension of the Semnan power plant requiring more cost, also generates more electricity.
NPV for Bandar Abbas during 25 years useful life of solar chimney power plant is shown in Figure 17.
Figure 16. NPV vs year for Semnan power plant
Figure 17. NPV vs year for Bandar Abbas power plant
Similar to Semnan power plant, due to the larger dimension and initial capital requirement, Bandar Abbas solar chimney power plant begins its upward trend after a long time. In addition, there is more increase in NPV for Bandar Abbas power plant due to the larger dimension and more initial capital requirement.
Generally, Bandar Abbas is the most appropriate site for building a solar chimney power plant. Exergy destruction of the Bandar Abbas power plant in optimum mode is more compared with the two other cities and the performance of the power plant is significantly better in the value of generated power and profitably.
In this investigation, three different locations in Iran with different climatic conditions were studied to determine the most appropriate place to build a solar chimney for power production purpose. The selected cities are Tehran, Semnan, and Bandar-Abbas which are belong to three different weather conditions. Thermo-physical and economic analysis were made to evaluate the selected cases. With this regard, all the parameters are considered as a function of collector diameter and solar chimney length. The calculations were made based on the weather condition on 6th August. The reason for choosing this day is having the most radiation intensity and ambient temperature that creates favorable conditions for a solar power plant. It was determined that in terms of ambient conditions, Bandar Abbas has the better conditions compared with the two other cities. In addition, thermodynamic analysis demonstrated that increase in ambient pressure doesn’t affect power output of the system. It is due to the increase in the pressure of inlet and outlet of the power plant. On the other hand, it was determined that increase in pressure leads to increase in exergy destruction. It is considered as a negative point in Bandar Abbas.
Besides thermodynamic evaluation, genetic algorithm (GA) were used to obtain the optimum designs of solar chimney power plant was determined for each of the three city. In the GA algorithm work exergy of solar chimney power plant, as power output of the power plant, and initial, repairing and maintaining costs were determined as goal functions. The ultimate goal of this functions is to find an optimum design that simultaneously has the highest output and the lowest cost. Optimization results for each case is calculated as follows:
The Optimum design of each case is obtained as follows:
- For Tehran: collector diameter 1070.740 meter and chimney length 733.242 meter.
- For Semnan: collector diameter 1281.196 meter and chimney length 807.343 meter.
- For Bandar Abbas: collector diameter 1544.823 meter and chimney length 823.353 meter.
Exergy analysis for the optimum design of each case illustrated that to Bandar-Abbas has the maximum of input exergy and output work and Tehran has the minimum input thermal exergy and output work among the three studied cities, since it has less radiation intensity, less ambient temperature and smaller dimension of power plant. On the other hand, Maximum exergy destruction belonged to optimum design of Bandar Abbas. It is due to the higher dimension of its power plant and more ambient pressure compared with the other two cities. Economic analysis shows that maximum NPV after 25 years useful life of power plant is related to optimum design of Bandar Abbas. Finally, this investigation demonstrates that after Bandar-Abbas, Semnan is ranked second in terms of power plant performance and economic issues and Tehran is the last case in this ranking.
[1] Xu, G.L., Ming, T.Z., Pan, Y., Meng, F.L., Zhou, C. (2011). Numerical analysis on the performance of solar chimney power plant system. Energy Conversion and Management, 52(2): 876-883. https://doi.org/10.1016/j.enconman.2010.08.014
[2] Dai, Y.J., Huang, H.B., Wang, R.Z. (2003). Case study of solar chimney power plants in Northwestern regions of China. Renewable Energy, 28(8): 1295-1304. https://doi.org/10.1016/S0960-1481(02)00227-6
[3] Schlaich, Jörg. (1995). The Solar Chimney: Electricity from the Sun. Edition Axel Menges.
[4] dos Santos Bernardes, M.A., von Backström, T.W. (2010). Evaluation of operational control strategies applicable to solar chimney power plants. Solar Energy, 84(2): 277-288. https://doi.org/10.1016/j.solener.2009.11.009
[5] Haaf, W., Friedrich, K., Mayr, G., Schlaich, J. (1983). Solar chimneys part I: principle and construction of the pilot plant in Manzanares. International Journal of Solar Energy, 2(1): 3-20. https://doi.org/10.1080/01425918308909911
[6] Haaf, W. (19484). Solar chimneys: Part ii: Preliminary test results from the Manzanares pilot plant. International Journal of Sustainable Energy, 2(2): 141-161. https://doi.org/10.1080/01425918408909921
[7] Hamdan, M.O. (2011). Analysis of a solar chimney power plant in the Arabian Gulf region. Renewable Energy, 36(10): 2593-2598. https://doi.org/10.1016/j.renene.2010.05.002
[8] Schlaich, J., Schiel, W., Friedrich, K. (2000). Solar Chimneys. Encyclopedia of Physical Science and Technology. Third Edition. London: Academic Press, 1-11.
[9] Schlaich, J., Bergermann, R., Schiel, W., Weinrebe, G. (2004). Sustainable electricity generation with solar updraft towers. Structural Engineering International, 14(3): 225-229. https://doi.org/10.2749/101686604777963883
[10] Santos, B. (2004). Technische, ökonomische und ökologische Analyse von Aufwindkraftwerken. Forschungsbericht / Institut für Energiewirtschaft und Rationelle Energieanwendung.
[11] Fluri, T.P., Pretorius, J.P., Van Dyk, C., Von Backström, T.W., Kröger, D.G., Van Zijl, G.P.A.G. (2009). Cost analysis of solar chimney power plants. Solar Energy, 83(2): 246-256. https://doi.org/10.1016/j.solener.2008.07.020
[12] Zhou, X.P., Wang, F., Ochieng, R.M. (2010). A review of solar chimney power technology. Renewable and Sustainable Energy Reviews, 14(8): 2315-2338. https://doi.org/10.1016/j.rser.2010.04.018
[13] Dincer, I., Sahin, A.Z. (2004). A new model for thermodynamic analysis of a drying process. International Journal of Heat and Mass Transfer, 47(4): 645-652. https://doi.org/10.1016/j.ijheatmasstransfer.2003.08.013
[14] Kavak, A.E., Midilli, A., Bicer, Y. (2006). The first and second law analyses of thermodynamic of pumpkin drying process. Journal of Food Engineering, 72(4): 320-331. https://doi.org/10.1016/j.jfoodeng.2004.12.011
[15] Celma, A.R., Cuadros, F. (2009). Energy and exergy analyses of OMW solar drying process. Renewable Energy, 34(3): 660-666. https://doi.org/10.1016/j.renene.2008.05.019
[16] Boulemtafes-Boukadoum, A., Benzaoui, A. (2011). Energy and exergy analysis of solar drying process of Mint. Energy Procedia, 6: 583-591. https://doi.org/10.1016/j.egypro.2011.05.067
[17] Panwar, N.L., Kaushik, S.C., Kothari, S. (2012). A review on energy and exergy analysis of solar dying systems. Renewable and Sustainable Energy Reviews, 16(5): 2812-2819. https://doi.org/10.1016/j.rser.2012.02.053
[18] Saidur, R., BoroumandJazi, G., Mekhlif, S., Jameel, M. (2012). Exergy analysis of solar energy applications. Renewable and Sustainable Energy Reviews, 16(1): 350-356. https://doi.org/10.1016/j.rser.2011.07.162
[19] Aghbashlo, M., Mobli, H., Rafiee, S., Madadlou, A. (2013). A review on exergy analysis of drying processes and systems. Renewable and Sustainable Energy Reviews, 22: 1-22. https://doi.org/10.1016/j.rser.2013.01.015
[20] Petela, R. (2009). Thermodynamic study of a simplified model of the solar chimney power plant. Solar Energy, 83(1): 94-107. https://doi.org/10.1016/j.solener.2008.07.001
[21] dos Santos Bernardes, M.A., Valle, R.M., Cortez, M.F.B. (1999). Numerical analysis of natural laminar convection in a radial solar heater. International Journal of Thermal Sciences, 38(1): 42-50. https://doi.org/10.1016/S0035-3159(99)80015-4
[22] Maia, C.B., Ferreira, A.G., Valle, R.M., Cortez, M.F.B. (2009). Theoretical evaluation of the influence of geometric parameters and materials on the behavior of the airflow in a solar chimney. Computers & Fluids, 38(3): 625-636. https://doi.org/10.1016/j.compfluid.2008.06.005
[23] Chergui, T., Larbi, S., Bouhdjar, A. (2010). Thermo-hydrodynamic aspect analysis of flows in solar chimney power plants—A case study. Renewable and Sustainable Energy Reviews, 14(5): 1410-1418. https://doi.org/10.1016/j.rser.2010.01.017
[24] de Vahl Davis, G. (1983). Natural convection of air in a square cavity: a bench mark numerical solution. International Journal for Numerical Methods in Fluids, 3(3): 249-264. https://doi.org/10.1002/fld.1650030305
[25] Pastohr, H., Kornadt, O., Gürlebeck, K. (2004). Numerical and analytical calculations of the temperature and flow field in the upwind power plant. International Journal of Energy Research, 28(6): 495-510. https://doi.org/10.1002/er.978
[26] Ming, T.Z., Liu, W., Pan, Y., Xu, G.L. (2008). Numerical analysis of flow and heat transfer characteristics in solar chimney power plants with energy storage layer. Energy Conversion and Management, 49(10): 2872-2879. https://doi.org/10.1016/j.enconman.2008.03.004
[27] Ming, T.Z, Liu, W., Xu, G.L., Xiong, Y.B., Guan, X.H., Pan, Y. (2008). Numerical simulation of the solar chimney power plant systems coupled with turbine. Renewable Energy, 33(5): 897-905. https://doi.org/10.1016/j.renene.2007.06.021
[28] Ming, T., Gong, T., de Richter, R.K., Liu, W., Koonsrisuk, A. (2016). Freshwater generation from a solar chimney power plant. Energy Convers Manage, 113: 189-200. https://doi.org/10.1016/j.enconman.2016.01.064
[29] Guo, P., Li, J., Wang, Y., Wang, Y. (2016). Evaluation of the optimal turbine pressure drop ratio for a solar chimney power plant. Energy Convers Manage, 108: 14-22. https://doi.org/10.1016/j.enconman.2015.10.076
[30] Özyer, T., Zhang, M., Alhajj, R. (2011). Integrating multi-objective genetic algorithm based clustering and data partitioning for skyline computation. Appl Intell, 35: 110-122. https://doi.org/10.1007/s10489-009-0206-7
[31] Beatrice, O., Brian, J.R., Franklin, H. (2006). Multi-objective genetic algorithms for vehicle routing problem with time windows. Applied Intelligence, 24: 17-30. https://doi.org/10.1007/s10489-006-6926-z
[32] Blecic, I., Cecchini, A., Trunfio, G. (2007). A decision support tool coupling a causal model and a multi-objective genetic algorithm. Appl Intell, 26: 125-137. https://doi.org/10.1007/s10489-006-0009-z
[33] Veldhuizen, D.A.V., Lamont, G.B. (2000). Multi objective evolutionary algorithms analyzing the state-of-the-art. Evol Comput, 8(2): 125-47. https://doi.org/10.1162/106365600568158
[34] Konak, A., Coit, D.W., Smith, A.E. (2006). Multi-objective optimization using genetic algorithms: A tutorial. Reliability Engineering & System Safety, 91: 992-1007. https://doi.org/10.1016/j.ress.2005.11.018
[35] Ahmadi, M.H., Hosseinzade, H., Sayyaadi, H., Mohammadi, A.H., Kimiaghalam, F. (2013). Application of the multi-objective optimization method for designing a powered Stirling heat engine: design with maximized power, thermal efficiency and minimized pressure loss. Renew Energy, 60: 313-22. https://doi.org/10.1016/j.renene.2013.05.005
[36] Ahmadi, M.H., Sayyaadi, H., Mohammadi, A.H., Marco, A. (2013). Barranco-Jimenez. Thermo-economic multi-objective optimization of solar dish-Stirling engine by implementing evolutionary algorithm. Energy Conversion and Management, 73: 370-380. https://doi.org/10.1016/j.enconman.2013.05.031
[37] Ahmadi, M.H., Sayyaadi, H., Dehghani, S., Hosseinzade, H. (2013). Designing a solar powered Stirling heat engine based on multiple criteria: Maximized thermal efficiency and power. Energy Conversion and Management, 75: 282-291. https://doi.org/10.1016/j.enconman.2013.06.025
[38] Ahmadi, M.H., Dehghani, S., Mohammadi, A.H., Feidt, M., Marco, A. (2013). Barranco-Jimenez. Optimal design of a solar driven heat engine based on thermal and thermo-economic criteria. Energy Conversion and Management, 75: 635-642. https://doi.org/10.1016/j.enconman.2013.07.078
[39] Ahmadi, M.H., Ahmadi, M.A., Mohammadi, A.H., Mehrpooya, M., Feidt, M. (2014). Thermodynamic optimization of Stirling heat pump based on multiple criteria, Energy Conversion and Management, 80: 319-328. https://doi.org/10.1016/j.enconman.2014.01.031
[40] Ahmadi, M.H., Ahmadi, M.A., Shafaei, A., Ashouri, M., Toghyani, S. (2016). Thermodynamic analysis and optimization of the Atkinson engine by using NSGA-II. International Journal of Low-Carbon Technologies, 11(3): 317-324. https://doi.org/10.1093/ijlct/ctv001
[41] Toghyani, S., Kasaeian, A., Ahmadi, M.H. (2014). Multi-objective optimization of Stirling engine using non-ideal adiabatic method. Energy Conversion and Management, 80: 54-62. https://doi.org/10.1016/j.enconman.2014.01.022
[42] Ahmadi, M.H., Ahmadi, M.A., Mehrpooya, M., Pourkiaei, S.M., Khalili, M. (2016). Thermodynamic analysis and evolutionary algorithm based on multi-objective optimisation of the Rankine cycle heat engine. International Journal of Ambient Energy, 37(4): 363-371. https://doi.org/10.1080/01430750.2014.973121
[43] Ahmadi, M.H., Mohammadi, A.H., Dehghani, S. (2013). Evaluation of the maximized power of a regenerative endoreversible Stirling cycle using the thermodynamic analysis. Energy Conversion and Management, 76: 561-570. https://doi.org/10.1016/j.enconman.2013.07.082
[44] Ahmadi, M.H., Ahmadi, M.A., Mohammadi, A.H., Feidt, M., Pourkiaei, S.M. (2014). Multi-objective optimization of an irreversible Stirling cryogenic refrigerator cycle. Energy Conversion and Management, 82: 351-360. https://doi.org/10.1016/j.enconman.2014.03.033
[45] Ahmadi, P., Dincer, I., Rosen, M.A. (2013). Thermodynamic, modeling and multi-objective evolutionary-based optimization of a new multigeneration energy system. Energy Convers Manage, 76: 282-300. https://doi.org/10.1016/j.enconman.2013.07.049
[46] Ahmadi, M.H., Mohammadi, A.H., Dehghani, S., Barranco-Jimenez, M.A. (2013). Multi-objective thermodynamic-based optimization of output power of Solar Dish-Stirling engine by implementing an evolutionary algorithm. Energy Conversion and Management, 75: 438-445. https://doi.org/10.1016/j.enconman.2013.06.030
[47] Ahmadi, M.H., Mohammadi, A.H., Pourkiaei, S.M. (2016). Optimisation of the thermodynamic performance of the Stirling engine. International Journal of Ambient Energy, 37(2): 149-161. https://doi.org/10.1080/01430750.2014.907211
[48] Sayyaadi, H., Ahmadi, M.H., Dehghani, S. (2014). Optimal design of a solar-driven heat engine based on thermal and ecological criteria. J. Energy Eng., 141(3): 04014012. https://doi.org/10.1061/(ASCE)EY.1943-7897.0000191
[49] Ghoujdi, I.E., Hadiannasab, H., Bidi, M., Naeimi, A., Ahmadi, M.H., Nazari, M.A., Ming, T.Z. (2018). Multiobjective optimization design of the solar field and reverse osmosis system with preheating feed water using Genetic algorithm. Energy Science & Engineering, 6(6): 624-642. https://doi.org/10.1002/ese3.237
[50] Jokar, M.A., Ahmadi, M.H., Sharifpur, M., Meyer, J.P., Pourfayaz, F., Ming, T.Z. (2017). Thermodynamic evaluation and multi-objective optimization of molten carbonate fuel cell-supercritical CO2 Brayton cycle hybrid system. Energy Conversion and Management, 153: 538-556. https://doi.org/10.1016/j.enconman.2017.10.027
[51] Ahmadi, M.H., Ahmadi, M.A. (2015). Thermodynamic analysis and optimization of an irreversible Ericsson cryogenic refrigerator cycle. Energy Convers Manage, 89: 147-55. https://doi.org/10.1016/j.enconman.2014.09.064
[52] Ahmadi, M.H., Ahmadi, M.A., Mehrpooya, M., Sameti, M. (2015). Thermo-ecological analysis and optimization performance of an irreversible three-heat-source absorption heat pump. Energy Conversion and Management, 90: 175-183. https://doi.org/10.1016/j.enconman.2014.11.021
[53] Ahmadi, M.H., Ahmadi, M.A., Feidt, M. (2014). Performance optimization of a solar-driven multi-step irreversible brayton cycle based on a multi-objective genetic algorithm. Oil & Gas Science and Technology – Rev. IFP Energies Nouvelles, 71(1). https://doi.org/10.2516/ogst/2014028
[54] Ahmadi, M.H., Mehrpooya, M., Abbasi, S., Pourfayaz, F., Bruno, J.C. (2017). Thermo-economic analysis and multi-objective optimization of a transcritical CO2 power cycle driven by solar energy and LNG cold recovery. Thermal Science and Engineering Progress, 4: 185-196. https://doi.org/10.1016/j.tsep.2017.10.004
[55] Ahmadi, M.H., Nabakhteh, M.A., Ahmadi, M.A., Pourfayaz, F., Bidi, M. (2017). Investigation and optimization of performance of nano-scale Stirling refrigerator using working fluid as Maxwell–Boltzmann gases. Physica A: Statistical Mechanics and Its Applications, 483: 337-350. https://doi.org/10.1016/j.physa.2017.04.079
[56] Hamdy, M., Hasan, A., Siren, K. (2010). Optimum design of a house and its HVAC systems using simulation-based optimisation. International Journal of Low-Carbon Technologies, 5(3): 120-124. https://doi.org/10.1093/ijlct/ctq010
[57] Sadatsakkak, S.A., Ahmadi, M.H., Ahmadi, M.A. (2015). Thermodynamic and thermo-economic analysis and optimization of an irreversible regenerative closed Brayton cycle. Energy Conversion and Management, 94: 124-129. https://doi.org/10.1016/j.enconman.2015.01.040
[58] Sadatsakkak, S.A., Ahmadi, M.H., Bayat, R., Pourkiaei, S.M., Feidt, M. (2015). Optimization density power and thermal efficiency of an endoreversible Braysson cycle by using non-dominated sorting genetic algorithm. Energy Conversion and Management, 93: 31-39. https://doi.org/10.1016/j.enconman.2014.12.088
[59] Ahmadi, M.H., Ahmadi, M.A., Feidt, M. (2015). Thermodynamic analysis and evolutionary algorithm based on multi-objective optimization of performance for irreversible four-temperature-level refrigeration. Mechanics & Industry, 16(2): 207. https://doi.org/10.1051/meca/2014080
[60] Ahmadi, M.H., Ahmadi, M.A., Sadatsakkak, S.A. (2015). Thermodynamic analysis and performance optimization of irreversible Carnot refrigerator by using multi-objective evolutionary algorithms (MOEAs). Renewable and Sustainable Energy Reviews, 51: 1055-1070. https://doi.org/10.1016/j.rser.2015.07.006
[61] Ahmadi, M.H., Ahmadi, M.A., Pourfayaz, F. (2015). Performance assessment and optimization of an irreversible nano-scale Stirling engine cycle operating with Maxwell-Boltzmann gas. The European Physical Journal Plus, 130(9): 1-13. https://doi.org/10.1140/epjp/i2015-15190-5
[62] Ahmadi, M.H., Mehrpooya, M. (2015). Thermo-economic modeling and optimization of an irreversible solar-driven heat engine. Energy Conversion and Management, 103: 616-622. https://doi.org/10.1016/j.enconman.2015.06.088
[63] Sahraie, H., Mirani, M.R., Ahmadi, M.H., Ashouri, M. (2015). Thermo-economic and thermodynamic analysis and optimization of a two-stage irreversible heat pump. Energy Conversion and Management, 99: 81-91. https://doi.org/10.1016/j.enconman.2015.03.081
[64] Ahmadi, M.H., Ahmadi, M.A. (2016). Multi objective optimization of performance of three-heat-source irreversible refrigerators based algorithm NSGAII. Renewable and Sustainable Energy Reviews, 60: 784-794. https://doi.org/10.1016/j.rser.2015.12.181
[65] Ahmadi, M.H., Mehrpooya, M., Pourfayaz, F. (2016). Exergoeconomic analysis and multi objective optimization of performance of a Carbon dioxide power cycle driven by geothermal energy with liquefied natural gas as its heat sink. Energy Conversion and Management, 119: 422-434. https://doi.org/10.1016/j.enconman.2016.04.062
[66] Ahmadi, M.H., Ahmadi, M.A., Mellit, A., Pourfayaz, F., Feidt, M. (2016). Thermodynamic analysis and multi objective optimization of performance of solar dish Stirling engine by the centrality of entransy and entropy generation. International Journal of Electrical Power & Energy Systems, 78: 88-95. https://doi.org/10.1016/j.ijepes.2015.11.042
[67] Ahmadi, M.H., Ahmadi, M.A., Pourfayaz, F. (2016). Thermodynamic analysis and evolutionary algorithm based on multi-objective optimization performance of actual power generating thermal cycles. Applied Thermal Engineering, 99: 996-1005. https://doi.org/10.1016/j.applthermaleng.2016.01.122
[68] Ahmadi, M.H., Ahmadi, M.A., Pourfayaz, F., Bidi, M. (2016). Thermodynamic analysis and optimization for an irreversible heat pump working on reversed Brayton cycle. Energy Conversion and Management, 110: 260-267. https://doi.org/10.1016/j.enconman.2015.12.028
[69] Ahmadi, M.H., Ahmadi, M.A., Mehrpooya, M., Feidt, M., Rosen, M.A. (2016). Optimal design of an Otto cycle based on thermal criteria. Mechanics & Industry, 17(1): 111. https://doi.org/10.1051/meca/2015049
[70] Hepbasli, A. (2008). A key review on exergetic analysis and assessment of renewable energy resources for a sustainable future. Renewable and Sustainable Energy Reviews, 12: 593-661. https://doi.org/10.1016/j.rser.2006.10.001
[71] Maia, C.B., Silva, J.C., Cabezas-Gómez, L., Hanriot, S.M., Ferreira, A.G. (2013). Energy and exergy analysis of the airflow inside a solar chimney. Renewable and Sustainable Energy Reviews, 27: 350-361. https://doi.org/10.1016/j.rser.2013.06.020
[72] Alpuche, M.G., Heard, C., Best, R., Rojas, J. (2005). Exergy analysis of air cooling systems in buildings in hot humid climates. Applied Thermal Engineering, 25: 507-17. https://doi.org/10.1016/j.applthermaleng.2004.07.006
[73] Zhou, X.P., Yang, J.K., Wang, F., Xiao, B. (2009). Economic analysis of power generation from floating solar chimney power plant. Renew Sustain Energy Rev., 13: 736-49. https://doi.org/10.1016/j.rser.2008.02.011
[74] https://solargis.com/maps-and-gis-data/download/iran/, accessed on 10 September 2019.