Dhuha Radhi | Ali Mohammed Hussein Mohsen | Ammar Abdulkadhim*
OPEN ACCESS
The two-phase fluid flow had many engineering applications like the fluidized bed, combustion, separation and collection of ducts, nuclear waste disposal, etc. which is the motivation for the researchers to investigate this phenomenon. In present investigation an experimental facility was developed to study the two-phase flow behavior inside a rectangular channel with rectangular obstructions with various air/water flow rates. The flow arrangement, air bubble generation along with pressure drop and pressure fluctuations were monitored in the present work. The experimental data was recorded using four pressure transducers and the air-water flow behavior was visualized with a camcorder for air flow rates of 8.3, 16.6, and 25 L/min and different water flow rates of 5, 10, 15 and 20 L/min. The results showed that by increasing the water or air flow rate values, the shape, size and amount of air bubbles in the water change accordingly. Higher water flow rate causes the flow to become highly turbulent and frothy. Furthermore, significant increase in the pressure difference along the channel was observed after increasing the gas and fluid discharge values.
two-phase flow, rectangular obstructions, flow rate
Two-Phase (Liquid-Gas) fluid flow exists in nature and in engineering applications wildly due to its importance. Some of these applications are heat ventilation and air conditioning, nuclear reactors, heat exchangers and fluidized bed Bin et al. [1]. Multiphase (gas-liquid) fluid flow inside vertical pipe can be represented by many regimes which they are bubbly, slug, annular and droplet flow. The void fraction impacts on the flow regimes. In the bubbly and slug fluid flow, a spectrum of various sizes in the bubbles is obtained. When the volume fraction of the gas increases, a broader bubble size distribution is achieved because of the coalescence of bubbles and break up. However, dispersed bubbly fluid flows with low gas volume fraction are shown to be mono-dispersed. The interfacial area is mainly necessary and imperative for mass, momentum and heat transfer between the dispersed and the continuous phase. This area cannot be simulated under the assumptions of just the void fraction and the mean diameter. However, the individual size of bubbles can affect the forces acting on it. Among the leading forces to lateral migration of the bubbles, i.e. forces acting perpendicularly in relation with the drag force, the bubble lift force was seen to change by changing the bubble size Krepper et al. [2]. Shedd et al. [3] presented an augmentation in the heat transfer of two-phase flow by microgrooved tubes.
Höhne et al. [4] illustrated experimentally and numerically using interfacial area density model to simulate the two-horizontal flow regimes using ANSYS CFX. Degawa et al. [5] examined numerically using vortex techniques to simulate the water-air bubbly fluid flow around tandem circular cylinder. Zhou et al. [6] numerically investigated the influence of Reynolds number on the vortex distribution and the dispersions of the particle around a circular cylinder by implementing the Lattice Boltzmann and the non-equilibrium extrapolation techniques. Sajjadi et al. [7] demonstrated by using the Reynolds averaged Navier–Stokes (RANS) model in conjunction with lattice-Boltzmann computational approach. They developed K-Epsilon turbulent model to solve the RANS equations. Breugem et al. [8] used immersed boundary method in order to resolve the particle-laden approach. Zhou et al. [9] presented an immersed boundary-lattice Boltzmann approach to model viscous fluids flow with rigid particles. The studies in regards the pressure drop and flow inside characteristics with different shapes of abstraction in pipe for single phase is studied by many researchers like [10-16]. The impact of ribs on fluid flow is studies by man researchers. Habeeb et al. [17] studied the two-phase flow over multi-shapes of ribs. Al-Turaihi et al. [18] experimentally and numerically using ANSYS FLUENT for two phase flow over triangular ribs located inside rectangular channel. Abadie et al. [19] performed using 2D simulation and experiments to describe bubble and the slug length, velocities of bubbles and liquid film hold-up. Taha et al. [20] examined the slug flow within square capillaries including Newtonian liquids. They used volume of fluid of the CFD commercial code FLUENT for their numerical investigation. The validated their numerical results with that obtained from experimental data in the open literature. A comprehensive review for slug flow without phase change is presented by Bandara et al. [21]. Al-Kayiem et al. [22] investigated numerically the water-air flow inside a transparent pipe with diameter of 7.4 cm and 8 m length. They analysis the impact of the superficial on slug translational velocity.
Abdulkadir et al. [23] examined numerically the hydrodynamics behavior for slug fluid flow occurring within a combination of air-silicone oil flow inside a circular pipe Dalla et al. [24].
It can be seen from the comprehensive previous published works that the phenomenon of two-phase gas-liquid fluid flow is still has many challenging due to their applications. Beside that it may be noted that two-phase flow over rectangular obstacle is limited. For this reason the main contribution of the present work is to experimentally study the characteristics of the flow such as fluctuations, pressure drop and mass flow rate for two-phase (water-air) flow inside a rectangular channel with rectangular obstructions.
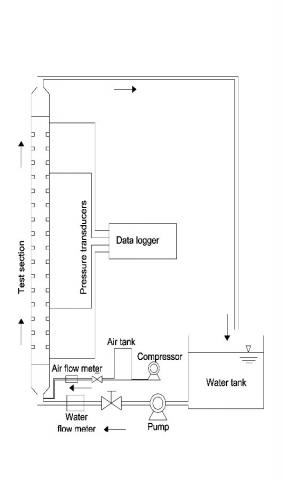
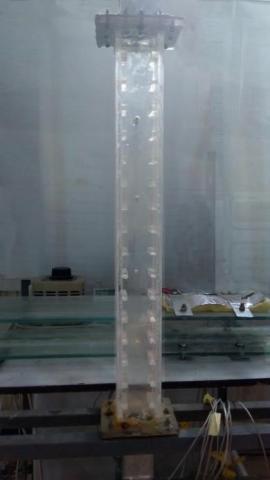
The experimental apparatus (shown in Figure 1) was constructed from a long rectangular channel of 8 cm in width, 6 cm in high, and a length of 70 cm. 16 Ribs (1cm x 1cm x 8cm) were placed on the inner side of each wall of the test section, and separated by a distance of 15 cm. The ribs are fabricated from Pyrex and fixed using LOCTITE Glass Glue on both sides of the channel at 3 cm from the test section entrance. A water pipe of 1.25 cm in diameter and an air pipe of 0.5 cm in diameter were joined and connected to the bottom of the channel. The water pumped with maximum flow rate of (43 L/min) and maximum head from a water tank of capacity of (0.5 m3). A flow meter is used to control the flow of water inside the rectangular section with range of (5-35 L/min). An air compressor (Makute type model 5050 BM and maximum pressure of 8 bars) was used to provide gas phase (air) into the test section. Four pressure transducers were mounted inside the rectangular channel to record the pressure values at different locations and study the effect of rectangular ribs on the pressure drop. A digital camera (Nikon D7000) was used to capture the flow behavior at different flow rates and visual data is parsed by using the AVS 8.1 video adapter software version. Four different values of water discharge of 5, 10, 15 and 20 L/ min along with three values of air discharge of 8.3, 16.6 and 25 L/ min were selected to conduct the study.
The experimental procedures can be summarized by the following:
Figure 1. Schematic diagram and actual photo of the experimental apparatus
3.1 Air and water discharge effects
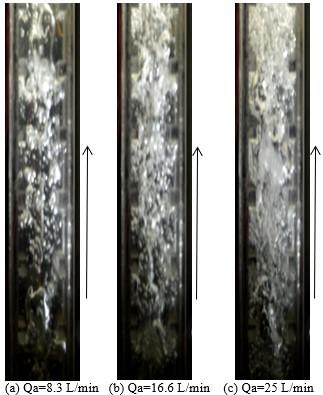
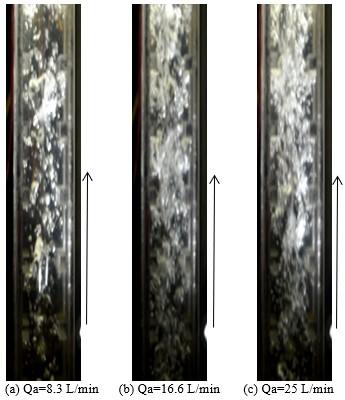
Figure 2 shows the two phase flow (air- water) behavior through rectangular ribs for air discharge Qw= 5 L/min) and water discharge Qa= 8.3, 16.6, 25 L/min respectively. At a very low air or water discharge rate, slug-droplet flow existed in the rectangle test section. Small bubbles collided with each other, while other larger bubbles of a bullet shape with a rectangular body contains a semicircular head and an elliptical nose and occupy more than half the length of the channel. The diameter of the bubble approaches the width of the channel. These bubbles are separated by liquid slugs and contain small dried bubbles. The small bubbles are irregularly distributed and small bubbles approach and merge together to form larger bubbles in the form of a bullet with a hemispherical nose and a blunt tail, whose diameters approaches the width of the channel.
When increasing the air flow rate, the bubbles amount (quantity) and size increase. Moreover, bubbles cavities generate cloud cavitation after using a particularly high air flow rate. The high gas flow rate leads to bubbly flow which appears to be highly foamy and individual bubbles cannot be identified to the naked eye as is illustrated in Figure 2(b) and Figure 2(c).
Figure 2. Air bubble behavior for Qw=5 L/min and Qa= 8.3, 16.6, 25 L/min respectively
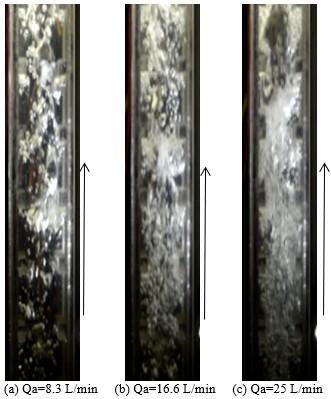
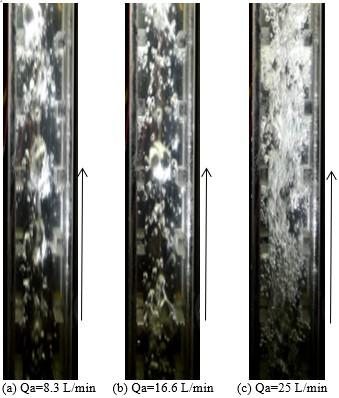
Figure 3. Air bubble behavior for Qw=10 L/min and Qa= 8.3, 16.6, 25 L/min respectively
Figure 4. Air bubble behavior for Qw=15 L/min and Qa= 8.3, 16.6, 25 L/min, respectively
Figure 5. Air bubble behavior for Qw=20 L/min and Qa= 8.3, 16.6, 25 L/min, respectively
Figure 3 shows the two-phase flow using water flow rate of Qw= 10 L/min and air flow rate of Qa= 8.3, 16.6, 20 L/min respectively. It can be seen that the flow become irregular and unsteady between the rectangular ribs as compared with previous case. The quantity and size of bubbles is greater, and there is an increase in the vortices between the ribs.
An additional increase in the water flow rate to 15 L/min increases the number of bubbles until a situation is reached where bubbles accumulate and larger bubbles form as shown in Figure 4. It is also observed that the flow became highly chaotic and frothy.
After further increase in water flow rate (Qw= 20 L/min), unstable behavior has been shown in Figure 5. Oscillatory motion between the bubbles and the ribs was developed and most bubbles converted to cloud flow. The flow appears to be more (disordered) turbulence and unsteady which generate more bubbles and waves.
3.2 Pressure fluctuations
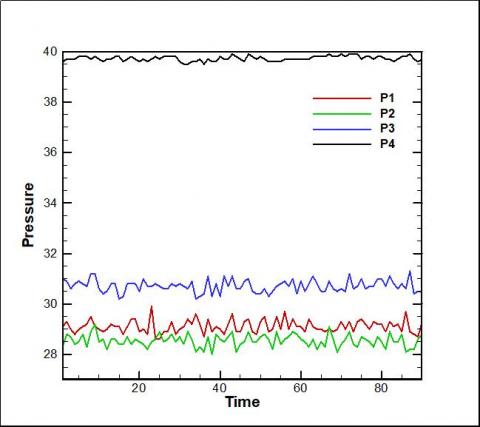
Figure 6 depicts the effect of gas-liquid flow on the pressure fluctuation inside the experimental facility for water and air discharge values of 5 L/min and 8.3 L\min respectively at four different locations along the rectangular channel. Four pressure sensors were fixed at four points along the test section and separated by a distance of 15 cm. These sensors were used to record the pressure fluctuations as a function of time.
Figure 6. Pressure fluctuation at four locations along the channel
3.3 Pressure difference
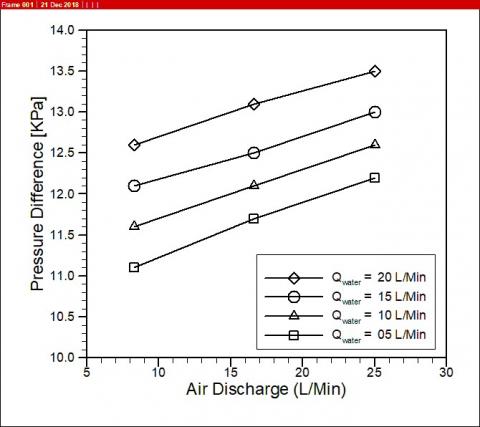
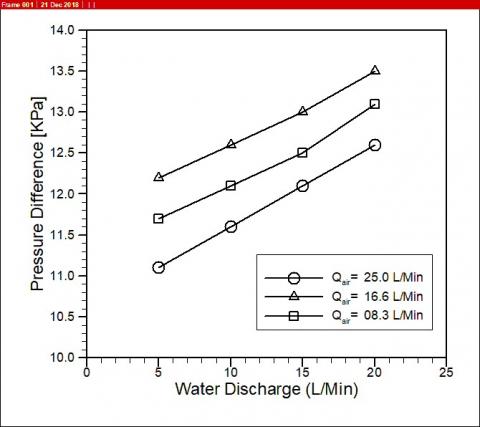
(a) different air discharge values for different water flow rates
(b) different water discharge values for different air flow rates
Figure 7. Pressure difference and flow rate
Figure 7(a) describes the relationship of air flow rate with differential pressure for different values of water flow rate, while Figure 7(b) describes the relationship of the water flow rate with mean pressure for different values of air flow rate. It is clearly shown that the mean pressure along the test section increases by increasing the air or water flow rates. The two phase flow behavior appears to be dependent on the mean pressure difference of the air and water as well as the design and configuration of the mixture. The unstable flow depends on pressure differentials.
The gas-liquid two-phase flow inside a rectangular channel with rectangular obstructions has been experimentally studied in the present work. Air and water were used in the study. The recorded data has shown that at low air flow rate slug-droplet flow existed inside the channel, and large bubbles in the form of a bullet of a hemispherical nose and blunt tail were developed. As the air flow increased from 8.3 to 25, the bubbly flow became highly foamy and individual bubbles could not be identified to the naked eye. Similarly, by increasing the water flow rate from 5 to 20, Oscillatory motion between the bubbles and the ribs was developed and most bubbles converted to cloud flow. The flow appeared to be more turbulence and unsteady which generated more bubbles and waves. Furthermore, any increase in the gas or liquid flow rates caused a noticeable decrease in the pressure inside the ribbed channel due the presence of rectangular obstructions.
[1] Bin C, Wang C, Wang ZW, Guo LJ. (2009). Investigation of gas-solid two-phase flow across circular cylinders with discrete vortex method. Applied Thermal Engineering 29(8-9): 1457-1466. https://doi.org/10.1016/j.applthermaleng.2008.06.025
[2] Krepper E, Krepper E, Beyer M, Frank T, Lucas D, Prasser HM. (2009). CFD modelling of polydispersed bubbly two-phase flow around an obstacle. Nuclear Engineering and Design 239(11): 2372-2381. https://doi.org/10.1016/j.nucengdes.2009.06.015
[3] Shedd TA, Newell TA. (2003). Visualization of two-phase flow through microgrooved tubes for understanding enhanced heat transfer. International Journal of Heat and Mass Transfer 46(22): 4169-4177. https://doi.org/10.1016/S0017-9310(03)00249-7
[4] Höhne T, Vallée C. (2010). Experiments and numerical simulations of horizontal two-phase flow regimes using an interfacial area density model. The Journal of Computational Multiphase Flows 2(3): 131-143. https://doi.org/10.1260/1757-482X.2.3.131
[5] Degawa T, Uchiyama T. (2008). Numerical simulation of bubbly flow around two tandem square-section cylinders by vortex method. Proceedings of the Institution of Mechanical Engineers, Part C: Journal of Mechanical Engineering Science 222(2): 225-234. https://doi.org/10.1243/09544062JMES697
[6] Zhou H, Mo G, Cen K. (2011). Numerical investigation of dispersed gas–solid two-phase flow around a circular cylinder using lattice Boltzmann method. Computers & Fluids 52: 130-138. https://doi.org/10.1016/j.compfluid.2011.09.007
[7] Sajjadi H, Salmanzadeh M, Ahmadi G, Jafari S. (2017). Lattice Boltzmann method and RANS approach for simulation of turbulent flows and particle transport and deposition. Particuology 30: 62-72. https://doi.org/10.1016/j.partic.2016.02.004
[8] Breugem WP. (2012). A second-order accurate immersed boundary method for fully resolved simulations of particle-laden flows. Journal of Computational Physics 231(13): 4469-4498. https://doi.org/10.1016/j.jcp.2012.02.026
[9] Zhou Q, Fan LS. (2014). A second-order accurate immersed boundary-lattice Boltzmann method for particle-laden flows. Journal of Computational Physics 268: 269-301. https://doi.org/10.1016/j.jcp.2014.02.038
[10] Lavasani AM, Bayat H. (2016). Numerical study of pressure drop and heat transfer from circular and cam-shaped tube bank in cross-flow of nanofluid. Energy Conversion and Management 129: 319-328. https://doi.org/10.1016/j.enconman.2016.10.029
[11] Bahiraei M, Gharagozloo K, Alighardashi M, Mazaheri N. (2017). CFD simulation of irreversibilities for laminar flow of a power-law nanofluid within a minichannel with chaotic perturbations: An innovative energy-efficient approach. Energy Conversion and Management 144: 374-387. https://doi.org/10.1016/j.enconman.2017.04.068
[12] Mashayekhi R, Khodabandehb E, Bahiraeic M, Bahramid L, Toghraiee D, Akbaria OA. (2017). Application of a novel conical strip insert to improve the efficacy of water–Ag nanofluid for utilization in thermal systems: a two-phase simulation. Energy Conversion and Management 151: 573-586. https://doi.org/10.1016/j.enconman.2017.09.025
[13] Ranjbarzadeh R, Isfahani AM, Afrand M, Karimipour A, Hojaji M. (2017). An experimental study on heat transfer and pressure drop of water/graphene oxide nanofluid in a copper tube under air cross-flow: Applicable as a heat exchanger. Applied Thermal Engineering 125: 69-79. https://doi.org/10.1016/j.applthermaleng.2017.06.110
[14] Zeeshan M, Nath S, Bhanja D. (2017). Numerical study to predict optimal configuration of fin and tube compact heat exchanger with various tube shapes and spatial arrangements. Energy Conversion and Management 148: 737-752. https://doi.org/10.1016/j.enconman.2017.06.011
[15] Ahmed M, Yaseen M, Yusoff M. (2017). Numerical study of convective heat transfer from tube bank in cross flow using nanofluid. Case Studies in thermal Engineering 10: 560-569. https://doi.org/10.1016/j.csite.2017.11.002
[16] Abed EM, Fathi AA. (2018). Experimental and numerical investigation of metastable flow of refrigerant R-22 through capillary tube. The Iraqi Journal for Mechanical and Materials Engineering 18(1): 41-62. https://doi.org/10.32852/iqjfmme.Vol18.Iss1.72
[17] Habeeb LJ, Al-Turaihi RS. (2013). Experimental study and CFD simulation of two-phase flow around multi-shape obstacles in enlarging channel. American Journal of Mechanical Engineering 1(8): 470-486. https://doi.org/10.12691/ajme-1-8-1
[18] Al-Turaihi RS. (2016). The effect of the two phase flow (water–air) over triangle ribs on heat transfer coefficient in vertical rectangular duct. European Journal of Scientific Research 140(3): 248-262.
[19] Abadie T, Aubin J, Legendre D, Xuereb C. (2012). Hydrodynamics of gas–liquid Taylor flow in rectangular microchannels. Microfluidics and Nanofluidics 12(1-4): 355-369. https://doi.org/10.1007/s10404-011-0880-8
[20] Taha T, Cui Z. (2006). CFD modelling of slug flow inside square capillaries. Chemical Engineering Science 61(2): 665-675. https://doi.org/10.1016/j.ces.2005.07.023
[21] Bandara T, Nguyen NT, Rosengarten G. (2015). Slug flow heat transfer without phase change in microchannels: A review. Chemical Engineering Science 126: 283-295. https://doi.org/10.1016/j.ces.2014.12.007
[22] Al-Kayiem HH, Mohmmed AO, Al-Hashimy ZI, Time RW. (2017). Statistical assessment of experimental observation on the slug body length and slug translational velocity in a horizontal pipe. International Journal of Heat and Mass Transfer 105: 252-260. https://doi.org/10.1016/j.ijheatmasstransfer.2016.09.105
[23] Abdulkadir M, Hernandez-Perez V, Lowndes IS, Azzopardi BJ, Dzomeku S. (2014). Experimental study of the hydrodynamic behaviour of slug flow in a vertical riser. Chemical Engineering Science 106: 60-75. https://doi.org/10.1016/j.ces.2013.11.021
[24] Dalla Maria L, Rosa ES. (2016). Void fraction and pressure waves in a transient horizontal slug flow. International Journal of Multiphase Flow 84: 229-244. https://doi.org/10.1016/j.ijmultiphaseflow.2016.05.008