OPEN ACCESS
According to Eurostat statistics, electrical energy covered 17.5% of the final energy consumptions in Italian households in 2015, and the electrical intensity increase of 8.9% from 2000 to 2015. ISTAT survey on energy consumption of households represents a valuable source of data for an extensive analysis of this topic. In order to evaluate these data, a model has been implemented in Matlab®, which calculates the electrical energy demand for lighting, electrical appliances, cooking appliances, DHW boilers, space heating and cooling.
The present paper describes the methodology and the main results obtained with the above ISTAT dataset, consisting of 20,000 records. The numerical model allows allocating the electrical energy consumption for each end-use, in order to obtain a reliable estimation of the households’ habits. Furthermore, it provides a useful tool applicable to the next surveys, in order to analyse the evolution of the electrical consumption of Italian households, to evaluate the potential energy savings of specific retrofit measures and to provide recommendations for policy actions supporting the improvement of the energy efficiency in the residential sector.
electrical energy demand, ecodesign, residential sector, statistical model
The knowledge of actual energy uses in the residential sector plays a central role in achieving the goals set by European Directives and the recent Clean Energy Package. According to Eurostat statistics as reported in [1], electrical energy covered 17.5% of the final energy consumption in Italian households in 2015, with an increase of 3% on the previous year; moreover, the electrical intensity increase of 8.9% in the period between 2000 and 2015. In such a context, ISTAT Survey on energy consumption of households represents a valuable source of data in order to estimate the electrical consumption according with the various end-uses [2]. The survey, conducted in 2013 on a sample of 20,000 households representative at regional level, provided information on the consumption habits, the characteristics and types of plant, and on the energy expenditures of Italian households specified by energy source. These data provide a comprehensive overview of the residential sector in the National energy context, and represent an official background for the development of future energy strategies addressed to domestic users.
In order to analyse these data, a model has been implemented in Matlab®, to calculate the electrical energy demand for lighting (traditional vs. energy savings light bulbs), electrical appliances, cooking appliances, DHW boilers, space heating and cooling. In particular, the electricity demand for space cooling is estimated by a regression model, while the energy for DHW is calculated basing on the average daily hot water demand per capita calibrated on statistical data. With regard to large domestic appliances, ovens and hobs, the model is based on the Ecodesign requirements and BATs.
In previous works [3-4], the authors already implemented a set of simulation tools for the evaluation of the energy consumption of households for space heating, DHW production and cooking based on ISTAT survey, focusing on traditional fuels, i.e. natural gas, diesel oil, LPG and biomass.
The present paper describes the updated methodology followed to analyse the electrical consumption among the various domestic end-uses, and the main results obtained with the above ISTAT dataset. The numerical model allows allocating the electrical energy consumption for each end-use on a record-by-record basis, in order to obtain a reliable estimation of the households’ habits.
The model that has been implemented for domestic electrical appliances followed the methodology provided in European Directives on the Ecodesign and Energy labelling, as they are representative of the actual energy use.
Records were classified in clusters according to the end-uses of electricity:
Cluster A: electricity used only for electrical appliances (ovens included), and for lighting;
Cluster B: electricity used as in Cluster A, plus for DHW production;
Cluster C: electricity used as in Cluster A, plus for electrical hobs;
Cluster D: electricity used as in Cluster A, plus for space cooling.
Each cluster was used for the definition of the main parameters of the model for specific end-uses, as described below. Electrical ovens were included in Cluster A because they are present in more than 80% of the dwellings that declared to use an oven. As found in a literature review, e.g. [5], and as confirmed by the results of the present model, energy consumption associated with electrical ovens is generally lower than that of electrical hobs. The possibility to include a large number of records in Cluster A was very important for a reliable estimation of the energy consumption of electrical appliances and lighting, which affected the calculation of the other end-uses, as detailed in the next sections.
The model uses information provided by 210 questions of the ISTAT survey.
2.1 Electrical appliances
Electrical appliances were divided into two groups. The former group collected white goods and the appliances with larger energy consumption, while the latter collected the small appliances. In particular, the first group included:
(1) Fridges;
(2) Freezers;
(3) Washing machines;
(4) Tumble dryers;
(5) Dishwashers;
(6) Range hoods;
(7) TVs;
(8) PCs;
while the second group included:
(1) Appliances for cleaning, i.e. vacuum cleaner, steam cleaner (floor scrubber), robotic vacuum cleaner, iron;
(2) Appliances for cooking, i.e. food processor and mixer, blender, coffee grinder, slicer, bread maker, coffee maker, toaster, microwave oven, grill;
(3) Other small appliances, i.e. printer, DVD player, video recorder, TV decoder, antenna, game console, humidifier/dehumidifier, HI-FI, fan, cordless, mobile phones, answering machine, FAX, camcorder, sewing machine;
(4) Auxiliary electrical equipment for space heating, DHW and solar thermal systems.
Even if the survey does not provide information on hair dryers, they were included in the model because in general their energy consumption may be not negligible (above all for large families).
Electrical appliances of the first group were modelled in a detailed way, while those of the second group were modelled by multiplying the average weekly energy consumption (which was assessed based on rules of thumbs obtained from a survey on the web) times the actual number of weeks of occupation of the dwelling. Whenever appropriate, the energy consumption in stand-by mode was accounted.
For the small appliances of the second group, the survey provided only information on their presence. Except for TV decoder and mobile phones, just one small appliance was considered whether present. On the contrary, TV decoder were assumed equal to the CRT TVs, and the number of mobile phones was assumed equal to the number per components of the family (with age between 10 and 80 years old). Similarly, the energy consumption of hair dryers was estimated basing on the number of occupants. These assumptions were considered realistic and acceptable, since the relative contribution on the energy consumption of such appliances is small.
Each appliance of the first group was modelled in a specific way, based on the methodology set by the European Commission for the energy labelling and the ecodesign requirements.
Refrigerators and freezers follow the mathematical frame found in Directive 94/2/EC [6], Directive 2003/66/EC [7] and UE Commission Delegate Regulation No. 1060/2010 [8] (that is valid since 2012). The model is the same, since the more recent regulations have simply adjusted and updated some parameters. The annual energy consumption of the household refrigerating appliance (AEC) was calculated with the following formula:
$A E_{\mathrm{C}}=S A E_{\mathrm{C}} \cdot \frac{E E I}{100}$ (1)
where EEI is the energy efficiency index correlated to the energy label of the appliance, while SAEC is the standard energy consumption, which was calculated with this equation:
$\mathrm{SAE}_{C}=\mathrm{V}_{e q} \cdot \mathrm{M}+\mathrm{N}$ (2)
In Eq. (2) Veq is the equivalent volume of the appliance, i.e. the sum of the equivalent volumes of all the n compartments, calculated in litres with this equation:
$V_{e q}=\sum_{c=1}^{n} V_{C} \cdot \frac{25-T_{C}}{20} \cdot F F_{C}$ (3)
where:
- n is the number of compartments,
- Vc is the volume of the c-th compartment, which was determined based on the classes of the fridge (small, medium, large, very large) provided by the survey,
- Tc is the nominal temperature of the compartments, equal to +5 °C for fresh food storage compartments and -18 °C for freezers,
- FFC, M, N, are correction factors reported in [6] to [8].
An average EEI was calculated for each year, according to the energy label of the refrigerating appliances sold in that year. This correlation was obtained from the Gfk data reported in [9] for year 2001 to 2009, and from the EU Commission report [10] for years 2010-203 (source data were taken from CECED and Gfk in TopTen). The ISTAT survey provided the classes of age of the appliances, the number of fridges, and the presence of a freezer compartment in the (main) fridge.
The annual energy consumption of washing machines was estimated following the methodologies provided in Directive 95/12/EC [11], for household washing machines sold until 2010, and then EU Regulation No. 1061/2010 [12]. There is an important difference between the approaches: the energy efficiency class in Directive 95/12/EC was related to the energy consumption per kg washed for a single standard 60°C cotton cycle using test procedures of harmonised standards. On the other hand, in EU Regulation No 1061/2010 the energy efficiency class refers to the annual energy consumption calculated in accordance with the technical specifications of EN 60456:2011, based on:
60 °C cotton programme at full and partial load;
40 °C cotton programme at partial load;
Left-on mode and off-mode.
The latter approach follows the general Ecodesign Eq. (1), and in this case, SAEC is calculated with the following equation:
$S A E_{C}=47.0 \cdot c_{0}+51.7$ (4)
where c0 is the rated capacity of the household washing machine (it is provided in three classes of capacity by the survey), while AEC is calculated using this relation:
$A E_{C}=E_{\tau} \cdot 220+\frac{\left\{p_{l} \cdot t_{l} \cdot 220+P_{0} \cdot\left[525,600-\left(t_{t}+\tau_{l}\right) \cdot 220\right]\right\}}{60 \cdot 1000}$ (5)
where 220 is the reference number of cycles in a year that is considered for the energy labelling, 525,600 is the number of minutes in a year, and the quantities in Eq. (5) refer to the standard cycle, in particular:
Et is the weighted energy consumption, also known as the European average consumption, in kWh;
Pl is the weighted power in ‘left-on mode’, in W,
P0 is the weighted power in ‘off-mode’, in W,
tt is the weighed programme time, in minutes,
tl is the time in ‘left-on mode’, in minutes.
The latter four quantities were estimated according to data found in the literature [13] - [14], while Et is the unknown that was found by means of Eq. (5). It corresponds to the weighted average of the different washing cycles as stated before:
$E_{t}=\left(3 \cdot E_{t, 60}+2 \cdot E_{t, 601 / 2}+2 \cdot E_{t, 401 / 2}\right) / 7$ (6)
where:
Et,60 is the energy consumption of the standard 60 °C cotton programme at full load,
Et,60 1/2 is the energy consumption of the standard 60°C cotton programme at partial load,
Et,40 1/2 is the energy consumption of the standard 40°C cotton programme at partial load.
The average consumption Et was then related to the above energy consumptions at temperature T and at partial load c/c0 with the following predictive correlation, which is used in Kilowattene, the simulation tool implemented by ENEA and the City of Bologna [14]:
$E(T, c)=E_{t} \cdot\left(0.28+0.0085 \cdot\left(\frac{c}{c_{0}}+0.98\right) \cdot(T-5)\right)$ (7)
ISTAT survey provided the annual number of washing cycles at low (30 °C), medium (assumed 60 °C), and high (90 °C) temperatures. Therefore, once calculated Et from Eq. (5), by using Eq. (7) and data from the survey it was possible to calculate accurately the annual energy consumption for each family based on the temperature of the cycles.
Eq. (7) was also used for washing machines sold before 2011 (for them Directive 95/12/EC applies) in order to find the energy consumption for each temperature level. Moreover, for these older appliances the energy consumption in stand-by modes was calculated according to the empirical correlation proposed by the developers of Kilowattene [14]:
$E_{s b}=0.63 *(1986-y)^{2} \cdot \exp ((1986-y) / 5.7)$ (8)
where Esb is the annual energy consumption in stand-by mode (in kWh/y) while y is the manufacturing year of the appliance. Eq. (8) is valid between 1986 and 2013.
Even though there is no coincidence between the old and the new methodology for the energy label, the model is able to account for the same contributions to the annual energy consumption of washing machines. The average energy efficiency index as a function of the year of purchase was obtained from [9] and [15].
Washer-dryers were modelled in a slightly different way, following Directive 96/60/EC [16] (which is still valid). The energy efficiency class was based on the energy consumption in kWh per kg of load for a complete operating cycle related to the standard 60 °C cotton cycle, and ‘dry cotton’ drying cycle. Also for these appliances, Eqs. (6) - (7) - for the correlation of the consumption to the temperature – and Eq. (8) – for the consumption in stand-by mode – were used.
As regards tumble dryers, the model referred to Directive 95/13/EC [17] (valid until 2012) and to Commission Delegate Regulation No 392/2012 [18]. The former Directive adopted a label’s classification related to a simple kWh/kg efficiency (consumption per cycle divided by the capacity) for a standard full load cycle. Instead, the latest Regulation is based on an EEI that assumes 160 drying cycles per year, of which 4 out of seven are assumed to be operated with half load filling, and includes off and stand-by modes. Moreover, SAEC was calculated with this formula:
$S A E_{C}=140 \cdot c_{0}^{0.8}$ (9)
Keeping in mind these specificities, the same approach of washing machines was adopted also for tumble dryers.
The model for dishwashers relied on Directive 97/17/EC [19] and EC Regulations No. 1059/2010 [20]. The former Directive correlates the energy efficiency class to the energy consumption in kWh for the single standard cycle that is compared to a reference energy consumption that depends on the place settings. Energy consumption in stand-by modes of dishwashers purchased before 2011 was calculated by means of Eq. (8). On the other side, the latest Regulation has a methodology similar to which is currently valid for washing machines. Therefore, Eqs. (1), (5) were used, by substituting 220 with 280 (i.e. the reference annual usage frequency for dishwashers), and SAEC is calculated as a function of the place settings (ps) with one of these formulas:
$S A E_{C}=7.0 \cdot p s+378$ (10)
$S A E_{C}=25.2 \cdot p s+126$ (11)
where Eq. (10) is valid for dishwashers with a rated capacity of 9 ps or less, while Eq. (11) applies for dishwashers with a rated capacity of 10 ps or more. Once calculated from Eq. (5), Et was multiplied times the actual number of cycles in a year for each family, and hence the annual energy consumption was obtained by considering also the contribution of stand-by modes.
Energy labelling for range hoods was introduced in 2015. Lacking a harmonised frame regulating the energy performance in the period under evaluation, the model considered the procedure for the calculation of the energy efficiency index prescribed in the Commission Delegated Regulation No 65/2014 [21], with the following assumption: hoods were characterised by an energy demand equivalent to energy label E until 2005, and to label C after 2005. Therefore, the electrical power at max efficiency of the domestic range hood (WBEP) was calculated, and the consumption was determined by multiplying WBEP times the length of a single cooking cycle (assumed equal to 30 minutes) times the usage frequency of the hob (corrected by the effective occupation in a year of the dwelling). The survey do not provide information on the presence of range hoods, nevertheless the model accounts for them whenever hobs are present (except for biomass hobs).
As regards televisions, the survey provides the number of TVs subdivided in CTR, plasma TVs, LCD and LED TVs, and provides the average daily number of hours subdivided into five classes (i.e. the average sum of hours in case more than one TV was used). Similarly, computers are subdivided into desktop and laptop, and the average daily number of hours of usage is available in classes. For each class, the model considered a reference value of the electrical power, which was set basing on a market survey, i.e. 70 W for CRTs, 280 W for plasma TVs, 140 W for LCD and 80 W for LED TVs. As regards PCs, these values were set: 360 W for desktop (monitor is included), and 35 W for laptops. Moreover, for both TVs and PCs a power consumption of 2 W was accounted for stand-by modes. Based on the data available, the average power was calculated as the mean of the power of the appliances weighted on the number of each type of TV (or PC). As regards the daily usage frequency, the average number of hour was considered for each class.
In order to improve the level of detail of the results, the model considered also the energy consumption of the electrical auxiliaries for space heating, DHW and solar thermal systems. Auxiliaries for space heating consists of circulating pumps, controls and valve actuators. As pumps are responsible of most of the electrical energy demand, auxiliaries have been considered for independent heating systems (local heating appliances were excluded). Energy consumption resulted by multiplying the average power (assumed equal to 30 W) times the number of hours of operation of the system during the heating season, according to the climate zones prescribed by the Italian decree DPR 412/93. Moreover, DHW systems (if not coincident with space heating systems) were assumed to absorb on average 5 W, while the presence of solar thermal systems was accounted with an electrical load of 10 W during operation (assumed equal to 2,000 h/y) and 2 W in stand-by.
2.2 Lighting
Lighting is responsible of in important part of the total electrical consumption in the residential sector. The survey provided information on the number of energy saving and traditional light bulbs, and, for each type, the number of bulbs turned on less than four hours, from 4 to 12 hours, and more than 12 hours in a typical winter day. Energy-saving light bulbs include fluorescent lamps, neon, led and new-generation halogen lamps as well, while traditional light bulbs include incandescent and old-generation halogen bulbs. Therefore, the reference power of energy-saving light bulbs was assumed equal to 20 W (in 2013 fluorescent bulbs where more common than led if compared to nowadays), and equal to 60 W for traditional light bulbs (a typical size of incandescent bulbs). Moreover, a reduction of use of 50% in the daily use of lighting was considered for six months in a year.
Based on the information on the classes of daily use, the model calculated the number of hours (for each range) that minimised the difference between the energy consumption of the model vs. the corresponding value from the survey. This calibration was done for each record of Cluster A, which collects households who used electricity only for the basic end-uses (i.e. electrical appliances and lighting), in order to improve the reliability of the results. Then, the mean number of hours of operation of light bulbs for each region so far calculated were applied to the other records, where electricity was used also for space heating, cooling, etc.
2.3 Domestic hot water
The annual energy demand for DHW was calculated according to the average daily hot water demand, with the following relation:
$Q_{D H W}=c_{w} \cdot V_{w \rho c c} \cdot \Delta_{w} \cdot \sum_{o c c} d_{o c c}$ (12)
where:
- cw is the thermal capacity of water, i.e. 1.162·10-3 kWh/kg/K;
- Vw,occ is the average daily hot water demand per capita (in litres);
- ΔTw is the temperature difference of water, calculated with a supply temperature of 40°C and mains temperature of 15°C;
- docc is the number of days in a year of occupation of the apartment by each component of the family.
For records of Cluster B (electrical uses for DHW production and for domestic appliances and lighting), the average daily hot water demand was determined for each record in the range 30 L to 120 L, in order to minimise the difference between the annual consumption between the model and the survey. Then, the mean of the values so far determined was applied to the records of the other clusters.
If solar collectors were available, the annual contribution of solar thermal was estimated by considering the number of solar collectors and the typical design solar fractions for DHW, and it was deducted from the net energy demand.
The model accounted only for the main/primary DHW heating system, as secondary DHW system were sporadic (present in just 3.3% of the records of the survey). The seasonal generation efficiencies were determined, as a function of the age (and hence of the level of insulation), i.e. 80% for systems and boilers older than 1990, 90% between 1990 and 2000 and 95% after 2000. As regards the heat pumps, reference SCOP were set according to the type of heat pump, i.e. SCOP = 3.0 for air, SCOP = 3.5 for superficial water and SCOP = 4.0 for ground-water and ground-source heat pumps. These values were related to year 2006, and the annual variation of SCOP was assumed equal to 4%, but limited to 4.5 (upper limit) and to a lower value (for systems older than 2001). Moreover, heat loss coefficients were associated with the presence of thermal energy storages and of recirculation piping. DHW recirculation was accounted in centralised systems installed after 1990 and in independent systems installed after 2000. The absence of water recirculation in the older systems was accounted by an extra hot water demand.
2.4 Cooking
In accordance with Eurostat guidelines [22] only ovens and hobs were considered, since small appliances (e.g. microwave ovens, kettles, coffee makers and toasters) generally have a sporadic or limited use, and they were accounted among the electrical appliances, as described in Section 2.1. Energy consumption was linked to the number of occupants, corrected in order to account for periods of non-occupation of the dwelling. The survey provided the usage frequency of ovens and hobs, and the classes of age and size for the ovens.
The model for ovens referred to the European Directive 2002/40/EC on Energy labelling [23], which applied before 2015. This directive provided the energy efficiency class according to the energy consumption of the oven related to the normalised load defined in Standard EN 50304 [24]. An average class was calculated for each year, according to the weighted average of the energy efficiency classes of ovens sold in that year. Data related to the sales of ovens in Italian market up to 2009 were taken from Gfk database [9], while the extrapolation up to 2013 was based on a market survey. Hence, the annual energy consumption was calculated for each record by multiplying the energy demand times the average usage frequency of the oven provided by Istat survey. The energy use in stand-by mode was accounted as well, by using Eq. (8).
As regards the hobs, no historical sales data were available and energy labelling did not apply before 2013. Therefore, the energy consumption of a single cooking cycle EChob was calculated as the ratio between the energy demand EDhob, i.e. the theoretic minimum energy in a single cooking cycle, and the average hob efficiency εhob:
$E C_{h o b}=\frac{E D_{h o b}}{\varepsilon_{h o b}}$ (13)
Normalised tests, which include heating up and keeping the temperature for a defined period, were considered representative of a typical household cooking process [25]. For records of Cluster C (electrical uses for appliances, lighting, ovens and hobs), the reference mass load per cooking cycle was determined for each record in order to minimise the difference between the annual consumption between the model and the survey, with the mass load variable between 0.5 kg and 2.0 kg. Similarly to DHW, the average mass load per cooking cycle was then applied to the records of the other clusters. Missing the data on the specific technology, electrical hobs were assumed inductive since 2005 and electrical resistance/halogen before 2005, based on a market survey. As no data on the age of the hobs were available from the Istat survey, the age of the oven was used. The efficiencies, adapted from [26] - [27], were set as follows:
Electrical resistance/halogen hobs: 60 %;
Induction hobs: 74%.
According to a market analysis, the normalised energy consumption (EChob) for induction hobs was assumed equal to 230 Wh/kg. Therefore, according to Eq. (13), it was possible to calculate the energy demand (EDhob) and, finally, the energy consumption in a single cycle for halogen hobs. Hence, the annual energy consumption was obtained by multiplying the energy demand per cycle times the number of occupants times the average usage frequency corrected by the actual occupation period.
2.5 Space cooling and heating
The model for space cooling was aimed at finding a correlation between the electrical consumption and four predictors: cooling degree-days (CDD, which represent the climate), seasonal EER (indicating the performance of the cooling machines), number of hours of use (h) and cooled floor surface of the dwelling (Af,cool). A correlation was obtained by means of Matlab robust regression tools [28]:
$E_{\text {cooling}}=f\left(C D D, E E R, h, A_{f, \text {cool}}\right)$ (14)
Unfortunately, the residence town couldn’t be used because of representativeness problems and the location was estimated based on the region and municipal typology (i.e. metropolitan area, periphery of the metropolitan area, municipalities with more or less than 50,000 residents, town located on the mountain or not). By using these data and the standard CDD provided by UNI 10349-2 [29], each record was associated with a value of CDD.
Reference EER were set according to the type of conditioner/heat pump (centralised, independent, fixed or portable) and to their technology (air, water or ground-source). An annual EER variation of 4% was assumed, limiting the upper values to 4.5 and the lower values for systems older than 2001 (the age of the cooling system is known).
The number of hours of use was estimated based on the frequency of use provided by the survey (in terms of average days during summer when the cooling system was turned on, and the number of hours of use in a day), and by assuming a cooling season of three months. The cooled floor surface of the dwelling was estimated by considering the total floor area and the ratio between the cooled rooms and all the rooms in the dwelling.
Most of the electrical space heating systems in the survey were secondary (only 13% of the household who declared an electrical space heating system used it as the main/unique system) and very little information was available for them. Therefore, the energy consumption for space heating was determined on the whole dataset by difference between the cumulative electrical bill and the sum of energy consumptions calculated for all the other end-uses. In order to obtain a reliable result, the models implemented for the other end-uses, and described before, had to be adequately comprehensive and reliable, and they were validated on the survey on a record-by record basis.
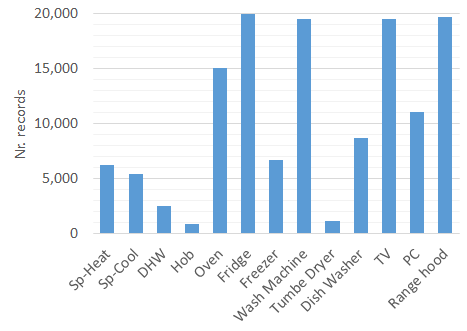
The number of records of the Istat survey where a specific end-use of electricity was present are reported in Figure 1. As expected, fridges, washing machines and TV were present in almost every record, while separate freezers and dishwashers were available in about 33% and 44% of the records, respectively. Tumble dryers, which are quite energy intensive, were available in 3% of the dwellings (almost 6% if washer-dryers are considered), while PCs were found in 55 % of the records. In this context, the median consumption for each electrical appliance is depicted in Figure 2. The most energy-consuming appliance are fridges, and then freezers and tumble-dryers follow, which result is in agreement with data found in the literature. Dishwasher and washing machines have a similar median annual energy consumption, around 193 kWh/y and 184 kWh/y, respectively. It must be highlighted that the calculated values strictly depend on the usage frequency declared by the households, and therefore they may deviate significantly from record to record. In fact, the model is able to account for the actual number of cycles record-by-record. Electricity was used only for electrical appliances and for lighting in 10,249 records (excluding records where photovoltaic or wind systems were present, because no data were available in order to separate their contribution).
As regards lighting, the median annual consumption of traditional light bulbs is similar to that of energy-saving light bulbs. This is because, in general, energy-saving bulbs were statistically used more frequently than traditional bulbs. The survey indeed confirmed that energy-savings light bulbs are a popular (and economical) solution for energy efficiency, in fact more than 53% of the households declared having replaced traditional bulbs with energy-saving bulbs in the five year before 2013. By summing the contributions of both types of light bulbs, the median annual EC calculated was 332.6 kWh/y.
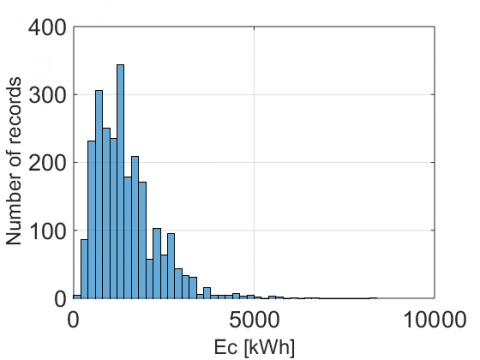
Cluster B collected 2,505 households (only 27 with heat pump) that used electricity as the main energy source for the production of DHW. The optimisation carried out resulted in an average daily hot water demand per capita of 49 L/d (at a supply temperature of 40°C). The annual energy consumption calculated by the model is depicted in Figure 3. The median Ec was equal to 1,303 kWh/y.
Energy consumption for cooking is reported in Figure 4. Electrical ovens are much more widespread than electrical hobs (15,029 ovens vs. 873 hobs), but on the other side, hobs have higher Ec. The median annual consumption of ovens and hobs resulted in 107 kWh/y and 404 kWh/y, respectively. The Ec for hobs was determined through the calibration of the average meal load per capita per cycle on the records of Cluster C, which mean value was 1.2 kg/pers.cycle.
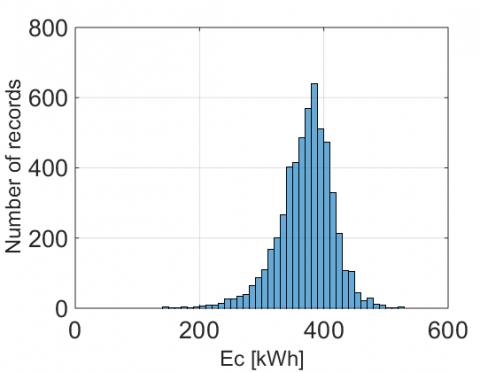
Space cooling was present in 5,448 records. The most common typologies were air conditioners (i.e. split) and air heat pumps. The annual energy consumption is shown in Figure 5, with a median Ec of 376 kWh/y. An issue encountered in the development of the model for space heating was the very poor correlation of the predictors used in the regression (i.e. CDD, EER, h, Af,cool ) with the energy consumption obtained from the survey (calculated as the difference between the total consumption and the contributions for lighting and electrical appliances, for records of Cluster D). Therefore, the model was not able to describe adequately the energy consumption for space cooling on a single record basis, and only the median value should be considered reliable of the whole dataset.
The results were compared with the electrical consumption calculated from the bill provided by the survey. In order to convert the bill costs into energy values (in kWh), the economic conditions of the protected market in the period between 2012 and 2013 set by the Italian National Authority - ARERA [30] were used, by considering the tariff for a domestic user in the main dwelling with a 3kW meter. The survey also indicated those families who changed operator in the last five years aiming at reducing the electrical bill (17% of the records). The switching of the electrical supplier was accounted by considering a "virtual" discount of 5% with respect to the protected market. Households who declared to have installed solar photovoltaic or wind systems (less than 3% records) were excluded from the analysis, since no additional information was available which could be used to estimate the share of the annual energy consumption covered by the RES systems.
Figure 1. Number of records for a specific electrical appliance and end-use
Figure 2. Median annual consumption of electrical appliances, kWh/y
Figure 3. Annual electrical consumption for DHW production, kWh/y
Figure 4. Electrical consumption for cooking appliances (kWh/y): hob (blue, right axis) and ovens (magenta, left axis)
Figure 5. Electrical consumption for space cooling, kWh/y
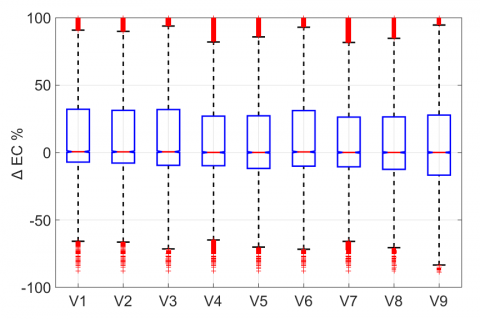
Note: Records included in each series: V1: electrical appliances + lighting + ovens; V2: electrical appliances + lighting + ovens + hobs; V3: electrical appliances + lighting + ovens + space cooling; V4: electrical appliances + lighting + ovens + DHW; V5: electrical appliances + lighting + ovens + space cooling + DHW; V6: electrical appliances + lighting + ovens + hobs + space cooling; V7: electrical appliances + lighting + ovens + hobs + DHW; V8: electrical appliances + lighting + ovens + hobs + space cooling + DHW; V9: all electrical equipment (also for space heating).
Figure 6. Percentage difference surveys vs. model
The percentage difference between the model and the survey was calculated on a record-by-record basis according to the following formula (subscript m and s refer to the model and to the survey, respectively):
$\Delta E C \%=\frac{E C_{s}-E C_{m}}{B C_{m}} \cdot 100 \%$ (15)
As shown in Figure 6, the model results are in good agreement with the energy consumption converted from the bill data. In fact, the interquartile range is limited to 40% and, most important, the median is close to 0 % in all the nine series of records that have been considered for the validation, each of them including a different combination of end-uses with electricity.
On a global point of view, the allocation of electricity among the various end-uses resulting from the implemented model applied to the ISTAT dataset can be summed-up as follow:
Electrical appliances and lighting: 77.9 %
Domestic hot water: 6.3%
Cooking: 5.7 %
Space cooling: 3.5 %
Space Heating: 6.6 %
The quota related to space heating is obtained by difference from the other percentages. As described in the Methodology, most of the electrical space heating systems in the survey were secondary systems and very little information was available for them. Nevertheless, validation confirmed the acceptability of this simplified approach.
The present paper describes the mathematical background and the main results obtained with the numerical code implemented in order to analyse the electrical energy consumption in households, based on ISTAT Survey on Italian households’ energy consumption.
The model is able to calculate the annual energy consumption for each record of the dataset, using different approaches in order to maximise the quantity and quality of information available from the survey. Hence, electrical appliances are modelled in a detailed way based on the Ecodesign normative, while the energy demand for lighting, DHW and hobs is obtained with a procedure that optimised the value of specific parameters, and space cooling was modelled by means of statistical regression by selecting four predictors. For the same reason, space heating was estimated by the difference between the energy consumption converted from the bill and the total contribution the single end-uses calculated by the code on a record-by-record basis. The good results obtained from the validation demonstrate the reliability of the model.
The numerical code allows allocating the electrical energy consumption for each end-use, in order to obtain a reliable estimation of the households’ habits. Furthermore, it provides a useful tool applicable to the next surveys, in order to analyse the evolution of the electrical consumption of Italian households, to evaluate the potential energy savings of specific retrofit measures and to provide recommendations for policy actions supporting the improvement of the energy efficiency in the residential sector.
This research was part of the Electric System Research project, implemented under the 2015-2017 Programme Agreement between the Italian Ministry for the Economic Development and ENEA.
[1] Agenzia nazionale efficienza energetica. (2017). Rapporto annuale efficienza energetica – Analisi e risultati delle policy di efficienza energetica del nostro Paese. Report RAEE-2017. ENEA, Rome, Italy. http://www.enea.it/it/seguici/pubblicazioni/pdf-volumi/raee-2017.pdf, accessed on Mar. 19, 2018.
[2] ISTAT. I consumi energetici delle famiglie. http://www.istat.it/it/archivio/142173, accessed on Mar. 20, 2018.
[3] Puglisi G, Zanghirella F, Ungaro P, Cammarata G. (2016). A methodology for the generation of energy consumption profiles in the residential sector. International Journal of Heat and Technology 34(3): 491-497. https://doi.org/10.18280/ijht.340320
[4] Caldera M, Puglisi G, Zanghirella F, Margiotta F, Ungaro P, Talucci V, Cammarata G. (2017). Proposal of a survey-based methodology for the determination of the energy consumption in the residential sector. International Journal of Heat and Technology 35(S1): S152-S158. https://doi.org/10.18280/ijht.35Sp0121
[5] Conti P. (2011). Definizione di una metodologia per l'audit energetico negli edifici ad uso residenziale e terziario. Report RdS/2011/143. ENEA, Rome, Italy. http://www.enea.it/it/Ricerca_sviluppo/documenti/ricerca-di-sistema-elettrico/risparmio-energia-settore-civile/rds-143.pdf, accessed on Mar. 19, 2018.
[6] European Commission. (1994). Directive 94/2/EC of 21 January 1994 implementing Council Directive 92/75/EEC with regard to energy labelling of household electric refrigerators, freezers and their combinations. Off. Journal of the EU.
[7] European Commission. (2003). Directive 2003/66/EC of 3 July 2003 amending Directive 94/2/EC implementing Council Directive 92/75/EEC with regard to energy labelling of household electric refrigerators, freezers and their combinations. Official Journal of the EU.
[8] European Commission. (2010). Delegated Regulation No. 1060/2010 of 28 September 2010 supplementing Directive 2010/30/EU of the European Parliament and of the Council with regard to energy labelling of household refrigerating appliances. Official Journal of the EU.
[9] Presutto M, Villani MG, Scarano D, Fumagalli S. (2011). Il mercato degli elettrodomestici e la sua evoluzione temporale. Report RdS/2010/255. ENEA, Rome, Italy. http://www.enea.it/it/Ricerca_sviluppo/documenti/ricerca-di-sistema-elettrico/tecnologie-riduzione-consumi/5-rapporto-indagine-mercato.pdf, accessed on Mar. 21, 2018.
[10] European Commission. (2016). http://www.ecodesign-fridges.eu/Documents/Household%20Refrigeration%20Review%20FINAL%20REPORT%2020160304.pdf, accessed on Mar. 20, 2018.
[11] European Commission. (1995). Directive 95/12/EC of 23 May 1995 implementing Council Directive 92/75/EEC with regard to energy labelling of household washing machines. Official Journal of the EU.
[12] European Commission. (2010). Delegated Regulation (EU) No 1061/2010 of 28 September 2010 supplementing Directive 2010/30/EU of the European Parliament and of the Council with regard to energy labelling of household washing machines. Official Journal of the EU.
[13] Boyano A et al. (2017). Ecodesign and Energy Label for Household Washing machines and washer dryers. Report EUR 28809 EN. JRC, European Commission. https://doi.org/10.2760/842340
[14] Kilowattene. Lavatrici. http://kilowattene.enea.it/KiloWattene-washing-info.html#, accessed on Mar. 22, 2018.
[15] ADEME. (2016). Energy efficiency of White Goods in Europe: monitoring the market with sales data. http://www.topten.eu/uploads/File/Market-Monitoring-2016-EN-Topten.eu.pdf, accessed on Mar. 22, 2018.
[16] European Commission. (1996). Directive 96/60/EC of 19 September 1996 implementing Council Directive 92/75/EEC with regard to energy labelling of household combined washer-driers. Official Journal of the EU.
[17] European Commission. (1995). Directive 95/13/EC of 23 May 1995 implementing Council Directive 92/75/EEC with regard to energy labelling of household electric tumble driers. Official Journal of the EU.
[18] European Commission. (2012). Delegated Regulation No. 392/2012 of 1 March 2012 supplementing Directive 2010/30/EU of the European Parliament and of the Council with regard to energy labelling of household tumble driers. Official Journal of the EU.
[19] European Commission. (1997). Directive 97/17/EC of 16 April 1997 implementing Council Directive 92/75/EEC with regard to energy labelling of household dishwashers, Official Journal of the EU.
[20] European Commission. (2010). Delegated Regulation No. 1059/2010 of 28 September supplementing Directive 2010/30/EU of the European Parliament and of the Council with regard to energy labelling of household dishwashers. Official Journal of the EU.
[21] European Commission. (2013). Delegated Regulation No. 65/2014 of 1 October 2013 supplementing Directive 2010/30/EU of the European Parliament and of the Council with regard to the energy labelling of domestic ovens and range hoods. Official Journal of the EU.
[22] Eurostat. (2013). Manual for statistics on energy consumption in households. http://ec.europa.eu/eurostat/documents/3859598/5935825/KS-GQ-13-003-EN.PDF/baa96509-3f4b-4c7a-94dd-feb1a31c7291, accessed on Mar. 19, 2018.
[23] European Commission. (2002). Directive 2002/40/EC of 8 May 2002 implementing Council Directive 92/75/EEC with regard to energy labelling of household electric ovens. Official Journal of the EU.
[24] CEI. (2001). Electric ovens for household use - Methods for measuring energy consumption. CEI EN Standard 50304.
[25] CEI. (2013). Household electric cooking appliances - Part 2: Hobs - Methods for measuring performance. CEI EN Standard 60350:2.
[26] ENEA. (2015). Efficienze dei sistemi di cottura. http://kilowattene.enea.it/KiloWattene-efficienza_sistemi_cottura.html#, accessed on Mar. 22, 2018.
[27] Hager TJ, Morawicki R. (2013). Energy consumption during cooking in the residential sector of developed nations: A review. Food Policy 40: 54-63. https://doi.org/10.1016/j.foodpol.2013.02.003
[28] Mathworks. MATLAB® Statistics Toolbox™ User Guide.
[29] UNI. (2016). Riscaldamento e raffrescamento degli edifici - Dati climatici - Parte 2: Dati di progetto. UNI Standard 10349:2.
[30] ARERA. Condizioni economiche per i clienti del mercato tutelato – Energia elettrica. https://www.arera.it/it/dati/condec.htm, accessed on Mar. 19, 2018.